
At a glance
- The McKinsey Global Institute previously identified 18 future arenas of competition—from AI services to space—that are increasingly writing the global growth story. Indeed, over the past three years, these 18 industries have grown roughly four times as fast as other industries in market cap and ten times as fast in revenue. Arenas are, by definition, the fastest-growing and most dynamic industries. As their scale and reach into the broader economy expand, it is fair to say that we are all in these arenas now.
- Since 2022, an “AI foundation” set of industries—semiconductors, cloud services, and AI software—has added $500 billion in revenues and $11 trillion in market cap. Infrastructure demand and investment have escalated rapidly in anticipation of AI deployment orders of magnitude larger than today. Companies that design and deploy computing power at scale have so far accrued most of the increase in market value and profit.
- Meanwhile, growth continues to surge in digital industries, while many physical arenas are poised to take off. Digital industries, such as e-commerce and digital advertising, are capturing a growing share of the attention economy, especially in emerging markets, even as chatbots reduce open-web traffic and agentic commerce creates new competitive fronts. Other arenas continue to escalate at varying paces, from robotaxis rolling out in dozens more cities worldwide to obesity drugs that are now six out of every 100 US prescriptions.
- Nine large competitors—we coin them “omniscalers”—are spending heavily and spanning multiple arenas. The nine omniscalers collectively generated over $700 billion in operating cash flow in 2025 and invested more than $800 billion in R&D and capital expenditures that same year. Their capabilities and financial capacity compound as they compete in arena after arena, expanding to generate revenues in as many as nine arenas.
- Companies headquartered in the United States and the Greater China region account for 90 percent of arenas’ market value today. US companies lead in 14 of the 18 arenas in market cap and ten in revenues. But China is gaining ground, especially when measured by revenue shares. The rest of the world stands by—for now.
Entering 2026, record-breaking investment in semiconductors, cloud services, and AI software and services is poised to transform how global companies create value. This fast-growing “AI foundation” for business is accelerating the growth of digital ecosystems and enabling new physical-world applications, from space and robotics to drones and other forms of “physical AI” that sense, decide, and act in the real world. At the same time, novel weight-loss therapies are reshaping pharmaceutical pipelines, electrification is advancing steadily, and geopolitics is increasingly influencing how critical industries are built up and protected—particularly through technology sovereignty and supply chain resilience policies.
All this has rapidly evolved since McKinsey Global Institute published The next big arenas of competition in 2024. We defined arenas as those industries with the highest growth rates and the most competitive dynamism, where market-share changes are the norm. With this definition, 12 arenas were identified by analyzing market data from 2005 to 2020.1 The original dozen included cloud services, e-commerce, biopharmaceuticals, and electric vehicles (EVs). Although these industries represented only about 10 percent of large-company revenues, they explained half the growth in market capitalization. They grew twice as fast as others, with roughly double the R&D intensity and triple the profitability.
Based on the markers of these 12 arenas over the last two decades, MGI identified 18 future arenas—industries showing early indications of the same potential to reshape the global economy over the next two decades. Some represent entirely new domains of competition, such as shared autonomous vehicles and space. Others, like semiconductors and e-commerce, reflect the ongoing evolution of earlier arenas as technology resets and investment cycles intensify. Throughout this report, we refer to all 18 as “future arenas,” likely to lead in growth and dynamism to 2040, even as this group is changing the business landscape today.2 Together, these 18 future arenas could generate $29 trillion to $48 trillion in revenues by 2040 (see sidebar “About the next big arenas of competition”).
About the next big arenas of competition
MGI published The next big arenas of competition in 2024 to answer two questions: Which industries are doing the most to reshape the world of business today? Which industries will do the most to reshape the world of business tomorrow?
To tackle these questions, MGI used a longitudinal, company-level data set tracking 2,970 companies from 2005 to 2020 to analyze the industries marked by two characteristics: They capture an outsize share of the economy’s growth, and market share within them changes hands to an outsize degree. The presence of these levels of growth and dynamism indicates that a new competitive game is underway, most often prompted by a new bundle of technologies and business models. These are what we call arenas. Over the last 20 years, 12 industries stood out on both growth and dynamism measured by shifting market shares across both revenue and market cap (Exhibit A).
Understanding arenas is important for a few reasons. For starters, they account for major shifts in investment, R&D, and value, as well as the emergence of many new and growing global corporations. Furthermore, once we started to recognize the factors that point to the potential formation of an arena, we could identify a set of future arenas. To do this future scouting, we scan for technology and business-model step changes that coincide with escalatory investment races. These conditions must also come with an addressable market that enables global scale—one that is large, growing, or both.
Applying this framework looking forward, MGI identified 18 potential arenas of the future that could significantly increase their share of global GDP and generate an estimated $2 trillion to $6 trillion in profits in our scenarios for 2040 (Exhibit B). This report focuses on the 18 future arenas, not to resize our original 2040 scenarios, but to see what is happening on the way.

In this 2026 update, we focus on the 18 future arenas to explore how competition is unfolding within them. With this focus, we see accelerating investment, shifting value pools, and a new industrial landscape emerging. Looking back now, even with just a few more years’ data, it seems our views were, if anything, conservative.
Chapter 1 presents evidence that the future arenas have far outgrown the rest of the economy since 2022 and are driving a disproportionate share of market value creation, which is why they are reshaping the technology frontier, capital flows, talent markets, and supply chains.3
Chapter 2 tells the story of recent dynamics across the arenas. To see the forest for the trees, we group them into five broad clusters with similar macro-level drivers: AI foundation, digitization, electrification, hard tech, and new bio-frontiers. Here we see the record-breaking surge in investment in AI and adjacent industries, the emergence of AI’s physical constraints, and how digital businesses are being recharged with significant implications for further growth potential. The chapter continues with a look at some technological step changes in batteries, autonomous vehicles, obesity drugs, and other arena-shaping developments in the physical realms.
Chapter 3 explores how a small group of highly cash-generative companies are expanding across arenas through the compounding effects of financial resources, innovation capabilities, and bold execution. We call them “omniscalers” to draw attention to their arena-spanning scope, which positions them to reuse their capacity to scale. At the same time, focused champions continue to compete vigorously: Nvidia, the world’s most valuable company at the time of writing, plays mainly in one arena—semiconductors.
Chapter 4 tracks the global race through a regional lens. US and Chinese companies figure most prominently, followed by players based in Europe and parts of advanced Asia. Differences in market structures shape these dynamics, alongside each region’s existing strengths.
Chapter 5 concludes with a strategy perspective to help CEOs, senior executives, and policymakers act on early signs of industrial shifts that are most relevant to companies and economies. From both defensive and offensive perspectives, how can companies and countries best prepare for the next big arenas of competition?
Growth takes off in future arenas
From AI, cloud services, and cybersecurity to more physical realms like space, robotics, and modular construction, the 18 arenas of the future are already economically significant—and they are pulling further ahead. Data through 2025 show that each of the 18 future arenas named in the flagship report are progressing broadly in line with the scenarios we modeled for 2040, and some even faster.
Future arenas are at the center of the global growth story
Since 2022, future arenas have expanded far faster than other industries, with market cap totals expanding four times as fast as non-arenas (29 percent per year from 2022 to 2025, compared with just 8 percent). Future arenas’ revenues climbed 11 percent per year during the same period—compared with a 1 percent growth rate in non-arenas, on average (Exhibit 1). As a result, future arenas accounted for about half of total market-cap growth and revenue growth over the past few years. As of 2025, the 18 arenas represented roughly $33 trillion in market capitalization and about $5 trillion in revenues. Capital expenditure and R&D investment also grew faster over the three-year period: Arenas expanded their investment spending at an annualized rate of about 14 percent, compared with 4 percent for non-arenas. By 2025, annualized investment among the arena companies exceeded $1 trillion. Arenas also earn higher returns: In our sample, future-arena companies delivered a return on invested capital (ROIC) about 1.5 times that of non-arenas.4

Beyond growth, rapid market-share shifts—that is, high levels of dynamism—are defining characteristics of arenas. For 2022 to 2025, we measure revenue dynamism with a “shuffle rate” of 14 percentage points for our future arenas, compared with ten percentage points for non-arenas.5 The shuffle rate comparison means that future arenas had bigger market share shifts among top players than non-arenas. While this three-year window is too short for definitive conclusions about new entrants or sustained shifts in market share, the early signals point to more fluid competitive dynamics in arenas. One only needs to witness the constant leapfrogging of frontier AI models to see this.
There are three key ingredients that form a repeatable “arena creation” potion, which we continue to see across these industries. We first see a technology or business-model step change—not just one new idea but a new trajectory or platform. As examples, think of the discovery of GLP-1 therapies for obesity and reusable rocket launchers that minimize the cost of getting satellites into space.
Second, we see escalatory investment, with players spending at an ever-increasing pace to try to keep a seat at the table. This can be a race for primacy or even just survival as players rapidly develop capability on the new technology curve. The spend gets very big in absolute terms, but none of that matters much if the competitor spends more—a process that keeps going and shakes out those who cannot keep up. The escalatory-investment pattern is most evident in AI, but across arenas, qualitative advantages can result in both extraordinarily high investment and winner-take-most dynamics.
And third, we see a large or expanding addressable market, which may draw from an already large market—such as EVs building on the existing global automotive market or shared autonomous vehicles rerouting traffic from the taxi and rideshare markets. Alternatively, large and expanding markets can be created anew, as seen in AI software and services. The recipe still appears to work as future arenas combine the three arena-creation potion elements to fuel strong growth and high dynamism.
The arenas are pushing forward, some at warp speed
A composite picture of growth shows future arenas clearly overshadowing other industries. But what does a more detailed scorecard reveal? To measure progress, we built a bottom-up database, working from the company level (see sidebar “Methodology” and the compendium for more detailed arena-by-arena findings).
The overall story: The future arenas are largely tracking within the growth boundaries we expected, with some growing notably faster (Exhibit 2).6 “Upper bound” (in the darkest blue) indicates fast recent growth and active reshuffling, consistent with the upper end of our 2040 prediction ranges with strong signals from the trio of ingredients. “Middle track” indicates solid momentum. “Lower bound” (in the lightest blue) indicates slower or earlier-stage progress relative to the 2040 scenarios. But note that signals of high-growth potential relative to the rest of the economy are evident in all 18 future arenas.
- Eight arenas are racing ahead at the upper bound of the trajectory. The AI foundation (AI software and services, cloud services, and semiconductors), plus digital advertising, cybersecurity, EVs, space, and shared autonomous vehicles all show growth consistent with the assumptions behind our higher-growth scenarios.
- Five are advancing at the expected fast speed. Two of these five are in the digitization cluster of industries: e-commerce and streaming video. Adoption for both is already broad; growth now comes from a mix of an expanding addressable market, especially in developing economies, and richer monetization models. Batteries, robotics, and obesity drugs are similarly tracking our 2040 scenarios.
- Five arenas are in earlier stages of growth. They are future air mobility, video games, modular construction, non-medical biotech, and nuclear fission. With their technology advances, investment levels, and commercialization efforts still scaling, they face headwinds before they can move up the path known as the S-curve.7 Even so, we see step-change technologies, long-horizon capital commitments, and policy support emerging, all of which suggests the potential for arena-level growth and dynamism down the road.

In practice, many arenas are likely to follow S-shaped adoption curves—with lower CAGRs early in the life cycle, higher ones as adoption scales, and, eventually, moderated growth, until the next technology reset. Accordingly, scenario placement is determined not solely by observed revenue growth in 2022–25 but also by market-cap CAGR (a proxy for investor expectations) and the core arena-creation potion elements, which are technology step changes, escalatory investment, and market expansion. These are all considered alongside life-cycle stage and dynamism signals. While assessment inputs often align, sometimes they diverge. Where they do, we provide additional details to explain the rationale.
One example is space, which we assess as being at the upper bound despite revenue growth closer to the lower track. Actual CAGR for 2022 to 2025 was 8 percent, compared with 7 to 10 percent under the scenario for 2022 to 2040, but our upper bound assessment for space reflects its strong market-cap signals and growth catalysts, such as rising defense demand, as well as technology-driven declines in launch costs.
Another example is batteries, assessed as middle track even though revenue growth from 2022 to 2025 is on the lower end of the trajectory to 2040. That is because electrification demand for batteries remains strong, driven by higher demand for both electric vehicles and battery energy storage solutions. In 2025, installations of battery energy storage solutions topped 300 gigawatt-hours, up 50 percent year on year.8 However, batteries’ recent price declines have temporarily depressed revenues.9
Obesity drugs illustrate a distinct situation: Despite its 38 percent revenue CAGR (far above the scenario for 2040 of 9 to 15 percent), with price declines of roughly 25 to 40 percent between 2022 and 2024 and intensifying competition among more than 80 companies pursuing obesity treatments in 2025, CAGR could start slowing down, thus shaping the track assessment.10
Outside the arenas
Arenas remain the headline story. But a focus on net growth can hide an important nuance: In absolute terms, roughly half of the increase in market value and revenues from 2022 to 2025 comes from industries outside the arenas. Their gross gains are even larger before subtracting the declines that offset them over this period.
Across all industries, the net increase in revenues was about $3.1 trillion from 2022 to 2025 (Exhibit 3). Roughly $1.4 trillion of that comes from arenas (at an 11 percent CAGR). An additional $4 trillion comes from non-arena industries that are growing (about 4.3 percent CAGR). But that growth is offset by about $2.3 trillion in declines from shrinking non-arena industries (down about 4.4 percent per year).

While our arenas are typically on the right-hand side of the curve—growing faster—they are not the only pockets of growth. Some traditional industries grow fast without displaying the dynamism and competitive characteristics that define arenas. Instead, their expansion may reflect other broad drivers, namely demand tailwinds from macro-level demand drivers (as seen in healthcare and defense); continued growth from our 12 past arenas (as seen in software and payments); and postpandemic recovery (as seen in travel and leisure and air services).11
As the industrial landscape continues to evolve rapidly, other industries could reach arena status. At the same time, we could be wrong that the 18 future arenas tracked here will maintain the highest growth and dynamism in the years ahead. In the original report, we identified eight almost-emergent arenas—industries that show some ingredients of arena formation but face greater uncertainty about growth or dynamism. They are clean hydrogen, lower-carbon materials, products and services for older adults, nuclear fusion, renewables equipment and infrastructure, sustainable fuels, virtual and augmented reality, and Web3 (including decentralized finance).12 As technology trajectories evolve, other domains may also warrant monitoring, even if commercial impact remains uncertain today. For example, quantum technology is surging and could have significant revenues in the period to 2040 and multiple times more value added through industries like finance, pharmaceuticals, and cybersecurity.13 But significant hurdles and uncertainty remain.14
We’re all in arenas now: These fast-moving industries matter for everyone
Collectively, the shift in value toward the 18 future arenas is staggering (Exhibit 4). Compared to 20 years ago, they are now five times more important as a share of market capitalization (from 5 to 26 percent) and revenue (from 2 to 10 percent) among the companies in our data set. The picture is even starker when we add the matured past arenas, denoted in gray on the charts. Past arenas include such industries as payments and industrial electronics, which previously qualified as arenas but didn’t make the cut because growth and dynamism show signs of stabilizing. Past and future arenas combined exceed 40 percent of all market capitalization today, up from about 12 percent in 2005.

Arenas are reshaping the industrial landscape
This chapter examines the 18 future arenas and explores the themes that are driving outsize growth. Here we find that AI is increasingly emerging at the heart of the new arenas landscape.
Five themes reveal differences in future arenas
In this chapter, we group the 18 future arenas into five themes to make broader patterns easier to spot (Exhibit 5). The five themes are: AI foundation, digitization, electrification, hard tech, and new bio-frontiers.
We define the AI foundation as semiconductors, cloud services, and AI software and services—the companies that are driving artificial intelligence across industries. Digitization encompasses e-commerce, digital advertising, video games, streaming video, and cybersecurity; electrification represents nuclear, EVs, and batteries; hard tech accounts for robotics, shared autonomous vehicles, future air mobility, space, and modular construction; and new bio-frontiers covers non-medical biotech and obesity drugs. Across all clusters and themes, AI often acts as an accelerator by improving performance, lowering costs, and enabling technology resets.
These categories are an analytical simplification: Cloud services are hardly AI-only, digitization continues to drive heavy demand, and semiconductors power far more than cloud operations. We nevertheless group semiconductors and cloud in the AI foundation because this arrangement best correlates the underlying trends driving the dynamics. Similarly, some arenas within a theme are more related than others. For example, a subset of hard tech—including shared autonomous vehicles, future air mobility, and new robotics—can also be viewed as physical AI, or systems built to “sense, think, and act” in the real world, thanks to sophisticated sensors and other AI-enabled technologies, while space and modular construction are less related. Keeping this caveat in mind, the five themes are used as the organizing frame for the analysis that follows.
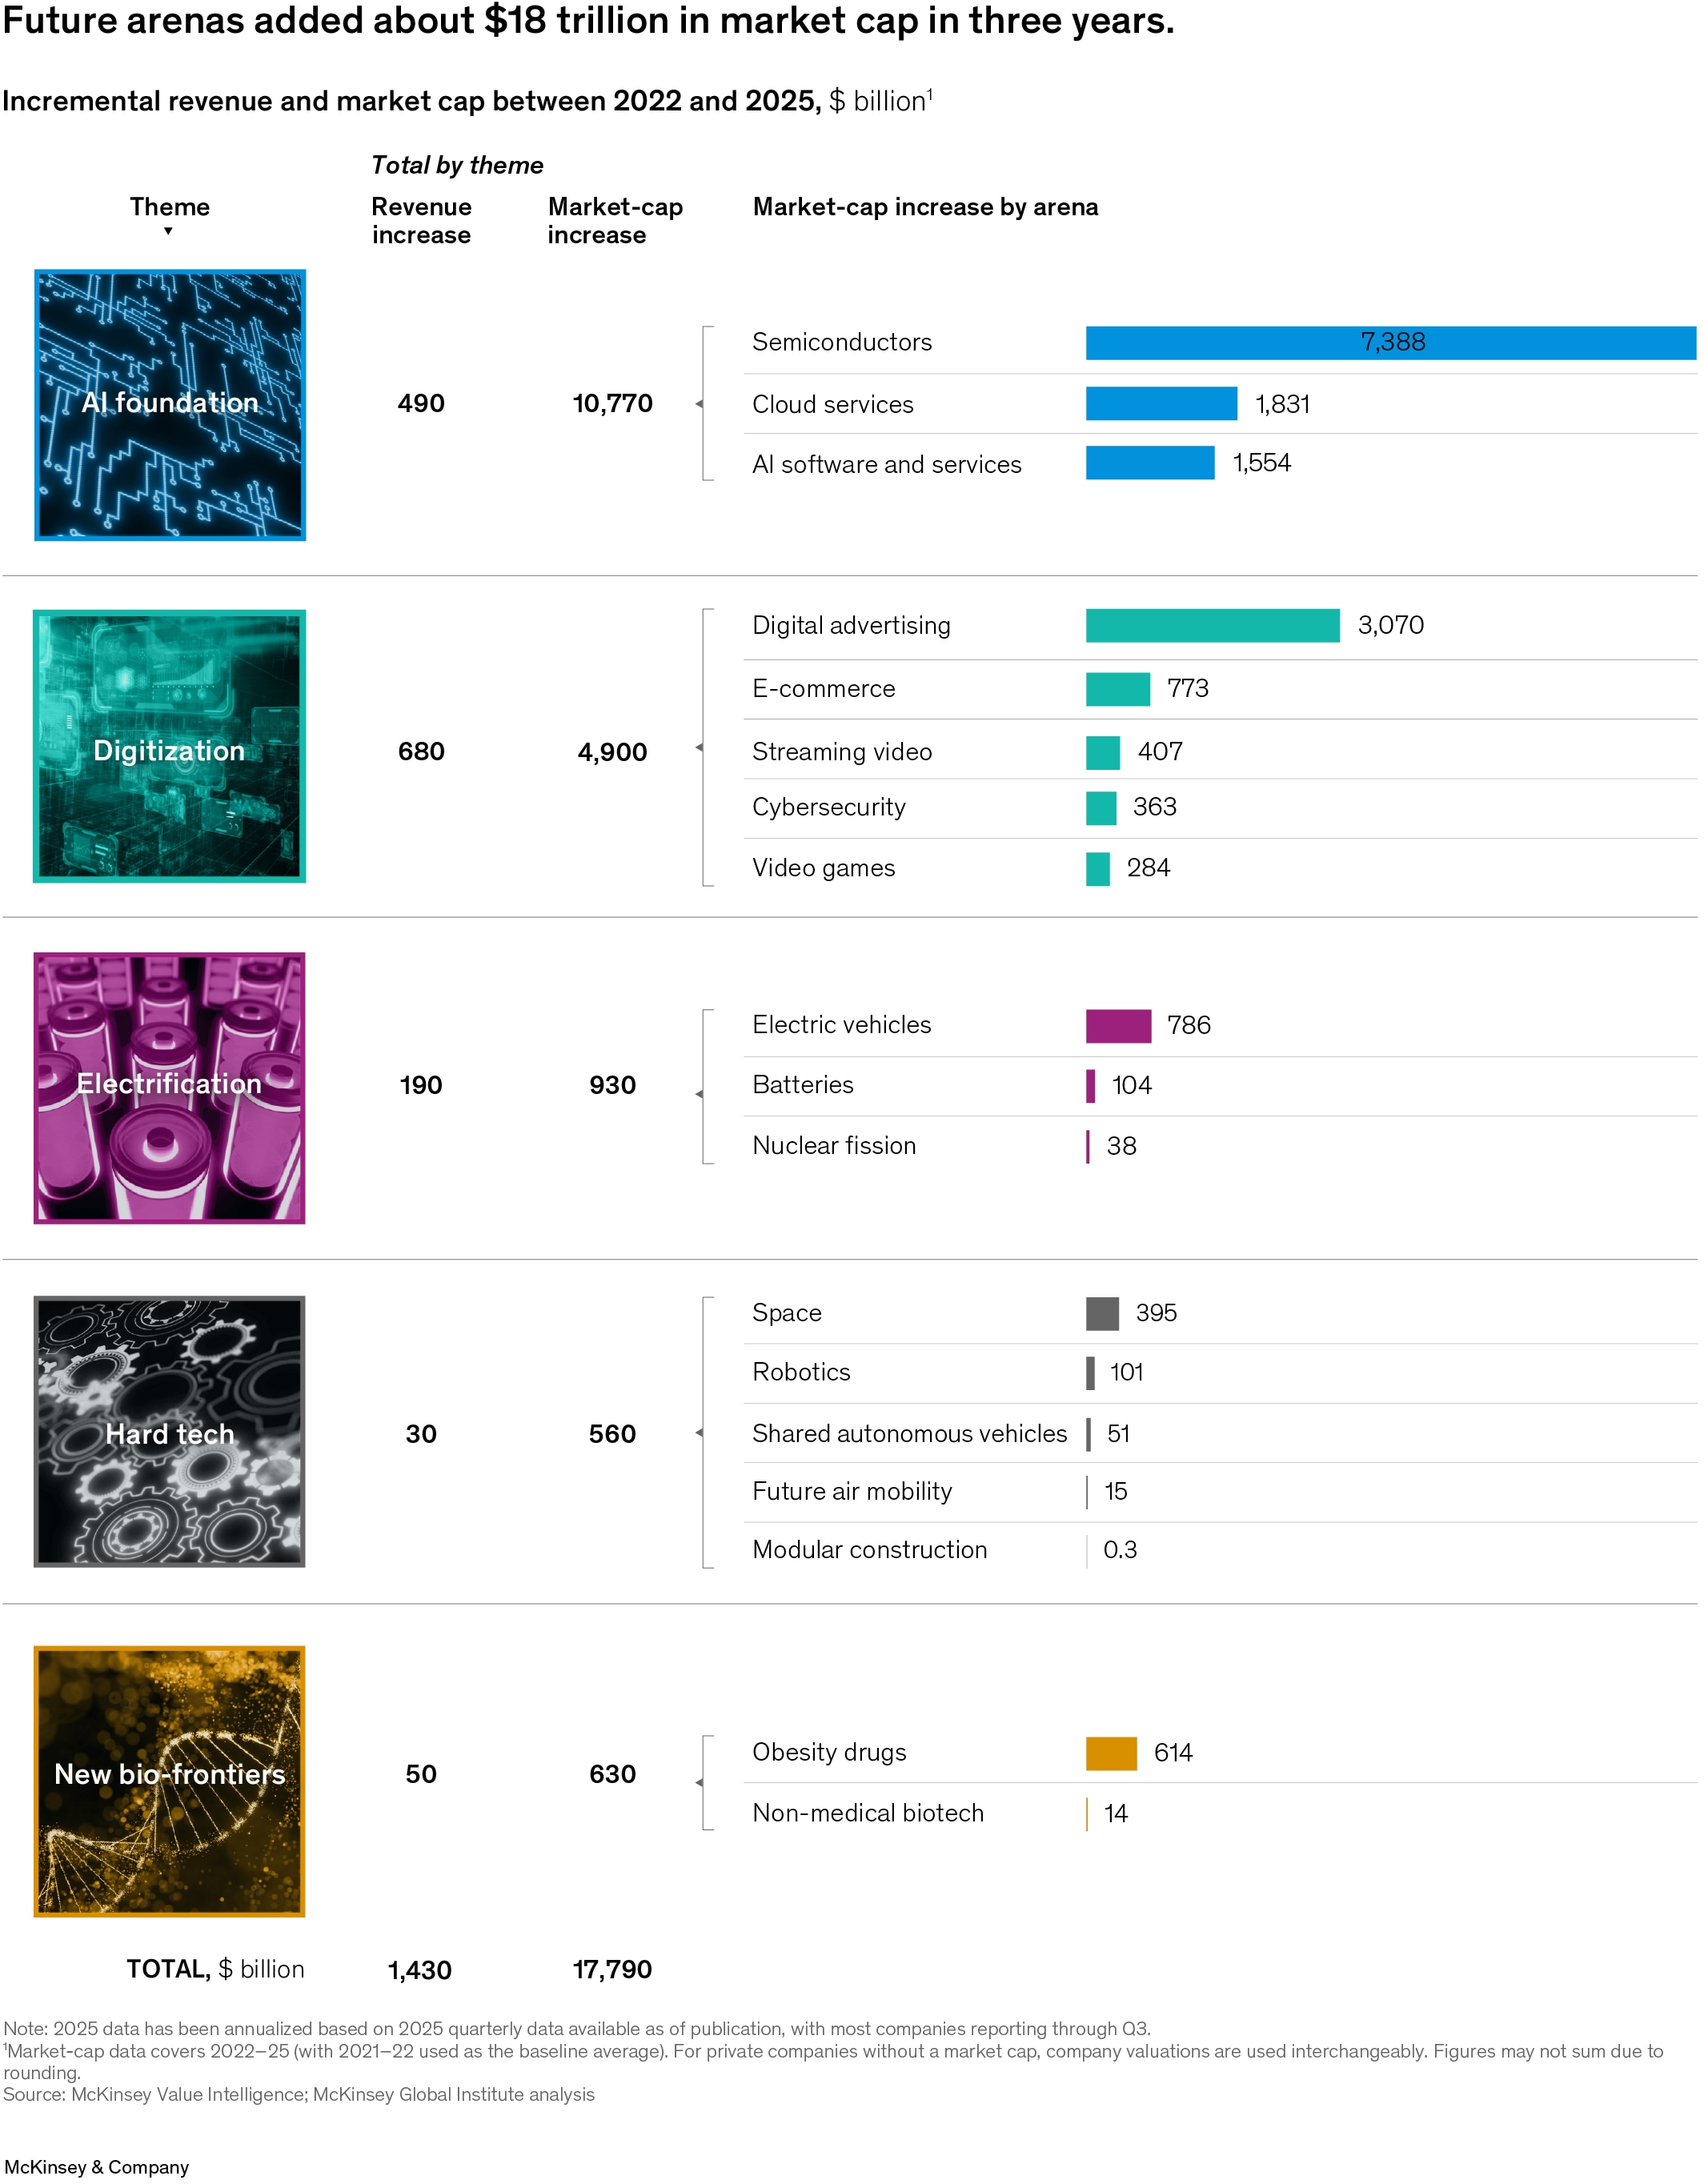
Since 2022, the future arenas have added about $18 trillion in market cap and $1.4 trillion in revenue. But note that these gains are highly concentrated by theme. Of the $18 trillion in incremental market cap, the AI foundation accounts for $11 trillion (about 60 percent of the total), with the digitization theme contributing an additional $5 trillion. Of the $1.4 trillion in revenue growth, digitization contributes $700 billion (nearly half), with the AI foundation bringing in $500 billion and electrification roughly $200 billion. Hard tech and new bio-frontiers are the themes that include more arenas that are earlier on the S-curve.
An AI wave is rising atop a still-surging digital wave
The AI foundation is clearly the fastest-growing category by market value, boosted by rising valuations of private leaders such as OpenAI, Anthropic, and xAI.15 The AI foundation’s share of total market value in our universe of large companies doubled from about 6 percent in 2022 to about 13 percent by the end of 2025 (Exhibit 6).

Market-cap and valuation gains are only part of the story. Revenues rose as well, but more modestly: The AI foundation’s share of revenue across industries increased from about 2 percent to about 3 percent. In absolute terms, AI foundation companies added about $11 trillion in market value on roughly $500 billion of incremental revenue.
Recent disclosures suggest that revenue momentum is building. Anthropic has stated that its run-rate revenue is growing more than tenfold annually and is now about $14 billion.16 Nvidia’s revenues expanded rapidly, from $27 billion in fiscal 2023 to more than $200 billion for fiscal 2026, implying that revenues have nearly doubled on average each year over the period.17
Nevertheless, the gap between market-cap and revenue growth reflects investor expectations for the future, expectations that will ultimately need to be validated through sustained returns on invested capital above the cost of capital. Whether the current AI investment cycle will generate returns commensurate with the capital deployed is among the most consequential open questions in business. Forty percent of market-cap growth is explained by Nvidia’s valuation climbing by roughly $4 trillion from 2022 to 2025 as the company added $170 billion in revenues. At the close of 2025, Nvidia alone was worth more than the entire listed semiconductor industry in 2022.18
Similar growth in the AI foundation is visible in investment (Exhibit 7). The AI foundation’s share of total capital expenditures and R&D rose by about three percentage points (from 11 percent to 14 percent), accounting for much of the overall increase in future arenas’ investment share (from 23 percent to 28 percent) and roughly matching the rise in digitization (from 7 percent to 10 percent).19

Escalatory investment is a core ingredient in the arena-creation potion, and in the current cycle, AI demand is amplifying it, particularly through spending on computing power in the form of data centers and semiconductors. Among a small set of seven companies (Amazon, Alphabet, Meta, Microsoft, TSMC, Oracle, and Nvidia) with businesses in the AI foundation theme and outsize R&D and capital expenditures, total investment escalated from about $15 billion in 2005 to close to $750 billion in 2025—50 times higher over two decades, and more than 90 percent above the level in 2022 (Exhibit 8).20 To gauge the magnitude, $750 billion represents about 11 percent of total US federal outlays in fiscal year 2025 and exceeds total public spending on US transportation and water infrastructure in 2023.21 Another way to look at it is as more than two entire Apollo programs per year (in today’s dollars)—and the Apollo project took 13 years.22
Most of those companies have announced sharp increases in capital investment for 2026. Alphabet, Meta, and Amazon have each indicated 2026 capital expenditures exceeding $100 billion, and each implies an increase of more than 50 percent over 2025. If current forecasts hold, the seven companies’ combined R&D and capital expenditures could be close to $1 trillion in 2026, more than 30 percent above 2025’s level.23

So far, realized economic value in the AI and chip value chain has been unevenly distributed, with a significant share accruing to chip designers (notably Nvidia), foundries, and hyperscale cloud providers that can deploy and monetize computing power at scale. At the same time, profit pools remain dynamic. Even between 2024 and 2025, value creation has shifted across segments alongside overall growth—for example, with a recent increase in memory (Exhibit 9).24

Within semiconductors, Nvidia graphics processing units (GPUs) are widely used for training many state-of-the-art AI models.25 High demand is reinforced by Nvidia’s CUDA programming model and its deep library stack, which makes GPUs easier to program and keeps workloads highly optimized across AI frameworks. This ecosystem integration can increase switching costs and helps explain Nvidia’s industry-leading gross profit margins of approximately 75 percent in 2025, though the company expects a lower margin in 2026.26
Leading-edge chip manufacturing also holds large value. TSMC’s foundries operate at relatively high gross margins (approximately 60 percent), reflecting the scarcity of advanced capacity.27 Further upstream in the AI value chain, margins vary widely. ASML’s gross margins sit at about 50 to 53 percent.28 Other segments show more variability in performance. In memory, for example, players are seeing steep increases in profits and cash. For example, Micron’s gross margin was about 22 percent in fiscal 2024 and rose to about 40 percent in fiscal 2025, swinging from a loss in fiscal 2023 to positive net income in fiscal 2024 as performance improved.29 Among hyperscalers, gross margins are relatively high compared with the rest of the chain; for example, Microsoft Cloud reported a gross margin of about 69 percent in 2025, though it noted margin headwinds from scaling AI infrastructure.30
Looking ahead, it is uncertain where margins will concentrate next as the AI value chain evolves. Will they accrue to new AI software players as their platforms scale and reach widespread adoption, or will those models become commoditized? Will profits remain anchored with chip designers and other hardware leaders? Different scenarios paint very different pictures of how value will be generated and distributed in the future, and while the answer is not yet clear, the question remains one of the most exciting (see sidebar “Investment moves across the AI value chain to address key constraints” and Exhibit 10).


Digitization is supercharged by AI and emerging markets
The digitization theme was the second-largest contributor to growth after the AI foundation. For the five digital arenas that make up this theme, revenue rose by 10 percent a year from 2022 to 2025, often from an already large base. Meanwhile, market caps continued compounding double-digit gains through 2025 (growing about 10 to 12 percent per year in e-commerce and video games, and roughly 20 to 24 percent per year in cybersecurity, digital advertising, and streaming video).
Global industries, with well-known incumbents and sizable annual revenues, can make digitization look mature at first glance. Several arenas have moved from rapid adoption to scale economics, where gains come from monetization and efficiency rather than growth in first-time users. Streaming video illustrates the shift: After a decade of subscriber-led expansion, many leading platforms are now emphasizing profitability through pricing, bundling, and ad-supported tiers and are competing more directly with one another.
Yet the digitization arenas continue to be reshaped by successive waves of disruption, which are still propagating through business models and market structure. Arena boundaries are blurring as firms compete for scarce attention, LLM-led interfaces are changing how online content is accessed, and emerging markets are adding to demand as even more households come online.
McKinsey’s 2025 report The ‘attention equation’ shows how the digitization arenas are interlinked. Industry boundaries are defined not only by products and services but by a scarce, valuable input—consumer attention. Attention, understood as valuable time spent and shaped by focus and intent, varies in monetizable potential, with higher-intent engagement commanding greater value (see sidebar “E-commerce and games in the battle for attention”).31 Consequently, digital players are moving fluidly up and down the value chain and across the digitization arenas. Content-led digital platforms like TikTok and Instagram are moving downstream into commerce.32 Streaming platforms like Netflix and Amazon Prime are scaling ad-supported business models.33 Legacy ad and search players like Google are shifting more spending toward video feeds, with YouTube accounting for more than 12 percent of all TV viewing in the United States in May 2025 and much of that attention captured by independent creators rather than traditional media studios.34 At the same time, multiple offline brands are building in-house digital-media capabilities to produce their own content. The result is a set of increasingly integrated ecosystems competing to control customer attention, transactions, and the data that connect them.
In this dynamic context, AI is creating disruptions across digital media. Chatbots that can return detailed, useful responses to complex user queries are disintermediating the open-web journey, reducing click-through traffic from searches at the expense of the publishers that rely on them.35 In advertising, AI is compressing creative cycles and enabling increasingly automated, real-time targeting and bidding. It also risks upending established content creation practices, with the potential to accelerate a shift to user-generated content and democratize access to high-end content creation—or generate a tidal wave of worthless AI slop.36 Meanwhile, movie and video game studios are already using AI to save costs in development and preproduction, even as debates over creative talent displacement, IP rights, and AI bias intensify.37
Agentic commerce could become the next major reset in digitization by unbundling the integrated ecosystems many companies have spent a decade building. Firms are getting better at monetizing attention, data, and transactions within tightly integrated environments, yet the same AI innovation race may erode those advantages by shifting digital journeys from “browse and choose” to “delegate and execute.” If AI agents become the default front door for discovery and purchasing, control could move from today’s platforms to whoever runs that agent experience and sets its defaults—whether operating systems, marketplaces, model providers, or payment platforms—recasting customer access, demand steering, and value capture across the digital stack.38
Cybersecurity is an arena where AI is already raising both risk and demand, making security for AI and AI for security twin priorities. As organizations embed AI into their systems, the attack surface expands as new models, APIs, data pipelines, and third-party integrations create additional components and decision points to secure. At the same time, attackers can use AI to facilitate phishing, impersonation, payload delivery, and exploit discovery. Continuing the loop, corporations are deploying AI in their defense to improve detection and response. Quantum computing is also emerging as a swing factor for cybersecurity growth. The “Q-Day”—when sufficiently powerful quantum machines could break today’s widely used public-key encryption—can accelerate investment in quantum-safe cryptography and quantum-secure communications.39 Regulation is also lifting cybersecurity’s baseline. The EU’s Digital Operational Resilience Act, US regulator- and state-level cybersecurity requirements, and emerging AI-safety standards are among the measures that encourage more corporate spending on identity and access management, cloud security, data protection, and other cybersecurity offerings.40 And multiplying attacker capabilities are only one vector of cybersecurity risk from AI. Agentic systems that operate across applications may require broad, ongoing access to devices and sensitive data, expanding attack surfaces and straining established identity, governance, and privacy safeguards.41
Amid these shifts, emerging markets remain core engines for growth as their addressable bases expand. Two main drivers of this growth are increasing connectivity, with more people online, and easier monetization with digital payments, particularly in Southeast Asia and parts of the Middle East and North Africa region.42 In Southeast Asia, multiple countries experienced double-digit annual growth of e-commerce’s gross merchandise value between 2023 and 2024.43 In India, e-commerce has scaled rapidly, while still having considerable room for growth; only 20 to 25 percent of Indian internet users shop online.44
E-commerce is increasingly crossing borders, despite some tightening of trade rules. This global interconnectivity is raising the competitive bar and sometimes compressing prices as companies ship large volumes internationally.45 Similar growth trends are visible beyond e-commerce. In video games, for example, growth is increasingly concentrated in emerging regions, including Latin America and the Gulf Cooperation Council countries, where large investments are backing digital ecosystem build-outs.46
Electrification scales—and shifts competition to cost and efficiency
Electrification is the common driver of three future arenas: electric vehicles (EVs), batteries, and nuclear fission. It reflects a broader shift from burning fuels directly—in cars, boilers, furnaces, and industrial processes—to generating, storing, and using electricity instead. As a result, electricity demand is growing faster than total energy supply, a trend further accelerated by AI’s growing power needs.47 Between 2022 and 2024, electricity generation rose about 3.5 percent per year to reach 31,000 terawatt-hours (TWh), almost double the 1.8 percentage points per year growth rate of total primary energy supply over the same period.48
Electrification is being pulled forward by two forces: decarbonization goals and the economics of efficiency. Electric end-use technologies, as seen in EVs and heat pumps, are typically much more efficient than fossil-fuel alternatives, like internal combustion engines and gas-burning boilers.49 Adoption is already meaningful: 22 percent of final energy uses were electric in 2024, and the technical runway remains large. An estimated 75 percent of final energy demand could be electrified with existing technologies, though it may take decades for the hardest of those use cases to become economical.50
Demand for electrification is no longer in doubt. As electricity demand grows, players are competing to build capacity at speed, secure supply chains, and sustain attractive returns. We focus on three arenas that illustrate different facets of the larger electrification story. First, EVs are among the largest and fastest-scaling sources of end-use demand.51 Next, batteries sit at the system’s core, enabling both mobility and power flexibility. And finally, nuclear fission can provide the reliable, always-available, low-carbon electricity the growing system increasingly needs.52
Electric vehicles stand out among the three arenas for the strength and breadth of arena-creating signals as the industry scales and attention turns to efficiency. Globally, EV revenues grew by 18 percent per year from 2022 to 2025, and unit sales grew even faster. Growth, however, has been uneven, both geographically and across players. China has led the expansion, with EV sales overtaking conventional vehicle sales in mid-2025.53 Value creation has concentrated in a small set of scaled players; escalatory investment and intense price competition have in fact compressed returns below the cost of capital for all but a handful of participants. These dynamics, along with regional differences in EV adoption and economics, are explored further in chapter 4.
As EV sales have increased and grids have required more energy storage, demand for batteries has surged. Between 2022 and 2025, demand for lithium-ion batteries by volume more than doubled, reaching about 1.6 TWh.54 Battery energy storage installations alone jumped more than 50 percent globally between 2024 and 2025 to 315 GWh.55 Falling costs alongside growing power needs, especially from AI and data centers, are reinforcing demand.56 Yet industry revenues grew only about 3 percent per year from 2022 to 2025 as intense competition, overcapacity, and lower input costs put downward pressure on prices.57 This dynamic is accelerating consolidation and favoring players with lower production costs, secure access to minerals, and government-backed financing. Such players are often based in China. Smaller or higher-cost entrants are finding it harder to scale efficiently.58 In the United States and Europe, some policy tools and incentives have been aimed at improving project economics and time to scale, but as conditions change—such as shifts in demand expectations, permitting timelines, financing costs, and eligibility rules—some battery projects have been delayed, downsized, or cancelled.59
From large builds to SMRs: The new field map of nuclear
Although nuclear capacity additions were limited from 2022 to 2025, the global pipeline is accelerating, with China at the forefront.1 Between 2022 and 2025, 36 reactors started construction, 25 of them in China.2 That was roughly a third more than the number of reactors starting construction a decade ago.3 By the end of 2025, about 70 reactors were under construction, projects that could bring more than 70 gigawatts online, with more than half in China (exhibit).4
Recent momentum reflects the fact that countries such as China, South Korea and the United Arab Emirates have brought together state-backed financing and standardized reactor designs with aligned public–private execution models that reduce cost and delivery risk. These countries demonstrated materially faster and cheaper build times—often five to seven years, compared with about ten years or more in Europe and the United States.5
Technological innovation in nuclear builds could, however, reopen the field to new entrants. In particular, advances in repeatable small modular reactor (SMR) designs that typically generate from 50 MW to 300 MW could speed construction timelines and reduce costs, even if smaller projects don’t enjoy the full economies of scale of large reactors that usually generate 1 GW or more.6 Several SMR designs are currently in early stages or under construction in Canada, the United States, China, and Russia.7 Most SMR designs under active development are being pursued in North America, followed by the European Union, with large SMR fundraising rounds heavily concentrated in the United States. As of early 2025, about $15 billion was secured for SMRs development and deployment—with around 35 percent of that coming from the private sector.8 Research is advancing on even smaller nuclear microreactors that generate up to 20 MW. Their compact size could allow them to be fully built in a factory and then transported easily, potentially even moving from site to site. In the United States, a May 2025 executive order aimed to expedite the regulatory approval process for SMRs and microreactors.9 Nonetheless, only a handful of SMR design projects have reached licensing. And while investments in SMRs are growing, they remain a small fraction of global investments in nuclear energy.10

Meanwhile, nuclear fission is snapping into focus as the way to provide power that is both low-carbon and available 24/7, a capability that is becoming more valuable as power demand rises, more intermittent sources (like solar and wind) are added to grids, and more countries prioritize energy independence. While near-term growth for this industry remains modest, momentum is building in both private and public sectors, supporting expectations for a stronger project pipeline.60 On the private side, hyperscalers are increasingly turning to nuclear; for example, Meta and Microsoft both signed 20-year power purchase agreements for a fixed-price nuclear power supply.61 On the public side, the number of national governments endorsing the United Nations COP pledge to triple global nuclear capacity by 2050 increased to 33 in 2025, and the US government has announced broad support for nuclear, too.62 Despite renewed momentum in the United States as well as in Europe, most nuclear capacity under construction is located outside of these regions.63 The next phase of competition is likely to be shaped by delivery capability: who can finance, permit, and build reliably at speed—and at a competitive cost. With these market forces, small modular reactors (SMRs) and nuclear microreactors could eventually broaden the field if a small number of designs achieve repeatable licensing and execution (see sidebar “From large builds to SMRs: The new field map of nuclear”).
Beyond EVs, batteries, and nuclear arenas, electrification is catalyzing a broader ecosystem, from charging and grid modernization to advanced materials and power electronics, creating conditions for additional arena formations on the horizon. For example, an electric tech stack that spans batteries, electric motors, and power electronics increasingly underpins physical innovations across our hard tech theme—robotics, autonomous vehicles, drones, rockets, and more.64
Hard tech is poised to take off
Arenas in the hard tech theme share a common trait: They translate advances in engineered hardware—often paired with software and AI—into new physical-world capabilities. In this report, we focus on five such arenas: robotics, shared autonomous vehicles (SAVs), future air mobility (including both electric vertical takeoff and landing vehicles, known as eVTOLs, and commercial drones), modular construction, and space. Together, they span how we build, move, and operate in challenging environments, from factory floors and city streets to the upper atmosphere and orbit. While many of these arenas benefit from electrification, we treat them separately because their primary drivers of value are the deployment of novel physical systems and autonomy at scale, often in combination.
Hard tech arenas are likely to change the way we experience the world. Modular construction can compress build timelines.65 Advances in robotics enable machines to expand from manufacturing to new fields like healthcare and agriculture. Autonomous vehicles, drones, and eVTOLs could reshape passenger mobility, delivery, and other sectors. Meanwhile, space innovation opens new horizons. Across all hard tech arenas, AI is accelerating automation and improving performance.
On the technology side, we see a convergence of three arenas in particular—robotics, SAVs, and future air mobility. In all three, advances in machine sensors, AI-based perception and decision-making, and increasingly capable actuators are allowing machines to perceive their surroundings, reason in real time, and act autonomously in the physical world.66 Progress in one arena is increasingly transferable to others. For example, advances in urban driving perception can lead to advances in delivery drones and warehouse robots, reinforcing innovation across the broader hard tech ecosystem.
Over the past three years, technology has advanced, investment has scaled, and demand has risen. Yet most hard tech arenas remain early stage, albeit to different degrees. Some are experiencing a renaissance as new use cases and enabling technologies emerge. For example, space, long anchored by government and telecoms, is being reshaped by new private players that are reducing launch costs and enabling new commercial services. Likewise, robotics, for decades deployed in closed-off industrial settings like assembly lines, is advancing more general-purpose applications as AI-based control improves. Robotaxis (that is, SAVs), while still relatively young, are beginning to scale in multiple cities.
Others remain in earlier stages of development: eVTOLs are progressing from certification to commercialization, drone delivery is starting to scale in select corridors, and modular construction remains a relatively slim share of the global construction market. But across the set, the question is often shifting from “Does it work?” to “Can it scale?”—with integration into real-world operations, regulations, and economics becoming decisive. The examples below illustrate that dynamic.
Driverless robotaxis are a reality on the roads in some markets. SAVs moved beyond pilots and now provide transportation for millions of people. They are commercially operating or testing in about 30 cities in the United States, China, and the United Arab Emirates.67 In California alone, miles traveled by robotaxis between September 2024 and September 2025 tripled, reaching almost 13 million miles (as shown in Exhibit 11).68 The two leading players, Waymo and Apollo Go, delivered more than 37 million rides from launch to 2025.69 Alphabet’s Waymo increased weekly rides by a factor of 25 in just two years.70 This momentum is expected to continue as safety and user acceptance improve and as capital keeps flowing.71 In 2024, Waymo raised an additional $5.6 billion to fund expansion, and UK-based start-up Wayve raised about $1 billion.72
Even as SAVs and investment scale, the economics remain challenging. As of 2025, leading players are still losing money, and Apollo Go has reportedly reached unit-level profitability in only one city (Wuhan, China).73 Our estimates show that robotaxi cost per vehicle mile traveled could decrease by more than 80 percent when operating at scale.74 As the industry grows, operators are pushing costs down through AI-enabled performance gains, lower-cost hardware, and more efficient operations and fleet utilization.75 Yet the pace of that expansion relies on complex and fragmented permitting requirements, particularly in the United States and the European Union.76

In another industry that once seemed more science fiction than next door, commercial delivery drones are seeing strong momentum.77 The number of drone deliveries rose by more than 25 percent from 2022 to 2023.78 Zipline, one of the arena’s leading players, doubled its deliveries from one million in April 2024 to two million by January 2026.79 The primary drivers of growth were quick-commerce package delivery and time-sensitive medical deliveries, with growing markets in the United States and Africa.80 Demand also increased in agricultural uses; in the United States, the number of registered agricultural drones increased more than fivefold in 18 months.81 Beyond commercial applications, defense drones are also growing on renewed investment; while we do not size military applications in our market scenarios, we discuss this trend below.
Although the drone market is growing, it remains nascent, and its economics remain challenging. Limited approvals to run uncrewed beyond-visual-line-of-sight (BVLOS) flights is another constraint. While some BVLOS flights are possible today, they often rely on waivers and risk mitigation, including human observers and other oversight efforts, which add labor costs and confine operations to small geographies.82 Clearer, scalable BVLOS rules would enable longer routes and hub-and-spoke networks, improving the business case for delivery and other applications.83 In the United States, proposals to ease regulation are underway.84
Also within future air mobility, eVTOLs are even more nascent. There are indications that they are approaching operating approvals, but commercialization is still in the distance (see sidebar “Hover, transition, certify: What still stands between eVTOLs and scale”).
These examples highlight a common pattern in hard tech: Most arenas show strong progress on potion elements (technological progress, investment, and market expansion) but are only beginning the journey to commercial scale. The pace of pickup will hinge on how the potion elements evolve. New demand drivers could emerge. AI expansion could propel modular construction for data centers; defense needs could expand (see sidebar “How defense is driving demand across hard tech).85 Regulation will also be decisive. Clearer rules and faster permitting can unlock deployment, and targeted public support can galvanize private investment.86
Along new bio-frontiers, non-medical biotech remains nascent while obesity drugs ramp up
Biotechnology is entering a new era. New tools to read, write, and edit biological elements are expanding what can be designed and built with living systems. More precise gene editing is enabling resilient crops. Microbes can now act as miniature factories to produce biomaterials, such as renewable and lower-carbon plastics known as bioplastics. Biotechnology is accelerating medical research, from novel weight-loss treatments to gene and cell therapies.
Two arenas capture much of this frontier activity: drugs for obesity (and related conditions) and non-medical biotechnology, the latter of which spans alternative proteins, agricultural biotechnology, consumer products and services, and biomaterials and biochemicals. While innovation advances across both, the two arenas are moving at uneven paces.87
Non-medical biotech is progressing more gradually in an array of industrial and consumer segments, especially in alternative proteins (including lab-grown meat and precision fermentation) and advances in agricultural biotechnology (for instance, using CRISPR gene editing to modify crops). Several industrial biotech segments remain in the earlier stages in commercialization and are dependent on end-markets economics. For instance, slower growth and margin pressure in agriculture is delaying the adoption of new biotech seeds, despite strong scientific progress. Still, underlying demand drivers support long-term potential, even if near-term commercialization is uneven.
By contrast, obesity drugs are scaling rapidly and exhibit many of the characteristics of a full-fledged arena. From 2022 to 2025, the market expanded significantly; revenues increased by more than 30 percent per year following a surge in demand.88 In the United States, GLP-1 prescriptions are now more than six out of every 100 prescriptions, a number that increased sixfold over the past five years.89 In several European countries, the out-of-pocket market roughly doubled over a single year.90 While the market remains concentrated, led by Novo Nordisk and Eli Lilly, competitive intensity is rising.91 Many competitors, including Boehringer Ingelheim, Amgen, AstraZeneca, and Roche, have late-stage obesity programs or assets.92 Entrants are also investing via M&A and differentiated technologies. For instance, Pfizer acquired GLP-1 producer Metsera for about $10 billion in 2025.93
Demand could increase as penetration remains low and access expands. As of 2024, only about 3 percent of US adults deemed eligible had received a prescription for weight-loss medications, and affordability remains a barrier because payer coverage is limited in markets such as the United States and the United Kingdom.94 At the same time, prices have dropped in recent years (by 25 to 40 percent in the United States), and upcoming key patent expirations could bring lower-cost generics and expand access.95
Competition is further reshaping how novel weight-loss therapies reach patients. Companies are developing oral alternatives to injections and longer-acting regimens to cut dosing frequency and improve persistence.96 Incumbents are also testing new commercial models to capture the growing out-of-pocket market. Novo Nordisk and Lilly have launched direct-to-consumer platforms, NovoCare and LillyDirect, offering telehealth and home delivery.97 These new channels are already meaningful for sales. For Lilly, about 35 percent of Zepbound prescriptions in the second quarter of 2025 were filled through LillyDirect.98 Moreover, both Novo Nordisk and Lilly introduced substantial discounts for patients paying out of pocket in 2025.99
The growth of novel weight-loss therapies could reshape more than pharmaceutical sales, especially if consumer-oriented care models and their spillovers, spread into adjacent parts of the healthcare system (see sidebar “Obesity drugs could trigger a more expansive health reset”). These types of therapies also reflect a broader shift within biotech. As scientific capabilities advance, innovation is increasingly focused not only on treating acute disease but also on addressing metabolic health and other chronic conditions that shape long-term outcomes. One area of development is “healthspan” research, which seeks to better understand and influence the biological processes associated with aging. This field remains emerging and faces scientific, regulatory, and commercial hurdles, but it illustrates how biotech priorities are expanding alongside advances in data, biology, and therapeutic platforms. Together, these developments highlight the evolving scope of the biotech landscape.100
Omniscalers are escalating competition across arenas
The previous chapter outlined the rapid scale of investment and pace of change that is shaping the arenas. A natural next question is who is driving it. Certainly the hyperscalers are in the mix, and we can see the rapid escalation of spend and competition. A related dynamic we explore in this chapter is “omniscalers.”
Omniscalers are a group of nine companies that are not only among the world’s biggest investors but are also playing simultaneously across multiple arenas.101 We are perhaps used to Amazon being both the world’s biggest e-commerce company and the leader in cloud. But the Tesla-plus-SpaceX ecosystem now spans AI, digital media, robotics, EVs and space—almost systematically ticking the boxes of the new arenas. These two omniscalers are joined by Alibaba, Alphabet, Apple, Huawei, Meta, Microsoft, and Samsung.102 Six of them are based in the United States, and the other three in Asia. We explain how we picked this set of companies in the next section of this chapter.
The emergence of omniscalers signals a new kind of economy of scope and scale. Omniscalers can certainly resemble conglomerates, deploying capital across diverse businesses. They differ, however, in how they scale and in the capabilities they carry across arenas.103 Omniscalers can deploy large pools of cash into long-payback bets. Equally importantly, they benefit from data and platform network effects, where large user bases generate data that improves products, attracting more users and partners. Today’s omniscalers can also reuse infrastructure across arenas, such as cloud and compute, and even logistics networks, so new businesses start with built-in capabilities and distribution. That lowers the marginal cost of expansion. Incremental capital often builds on existing platforms instead of starting from scratch, matching the escalatory logic of arena competition. Omniscalers integrate these advantages and capabilities, even across arenas, through sustained R&D, capital expenditures, and M&A.
As they scale, omniscalers can blur arena boundaries, influence investment-intensity levels, and disrupt value-chain structures. At the same time, scale alone is neither necessary nor sufficient for success in arenas. Many large companies do not scale across arenas, while at the same time we see new entrants continue to gain traction. Recent examples include well-funded younger AI players such as Anthropic and Perplexity; humanoid-robotics entrants such as Figure; fast-scaling EV challengers such as Zeekr (later acquired by Geely); and space players such as Rocket Lab.104 As escalatory investments reach new heights in arenas with omniscalers, competition isn’t quelled; it’s changing.
In this chapter, we examine how omniscalers compete across arenas and what enables their expansion. This section describes the phenomenon rather than endorsing it. Being an omniscaler is inherently neither good nor bad, and many companies have created value through other paths.
Nine omniscalers now span many arenas—and often lead them
We analyze nine omniscalers, though there may be more.105 The omni-9 are Alibaba, Alphabet, Amazon, Apple, Huawei, Meta, Microsoft, Samsung, and Tesla. Within this group, two operate as broader ecosystems or clusters of companies in which formally separate entities share leadership, capital, and capabilities. They are the cluster of companies founded by Elon Musk (Tesla and SpaceX, including xAI) and Jeff Bezos (Amazon, Blue Origin, and Project Prometheus).106
We defined omniscalers based on two simple criteria: they ranked among the top 30 global spenders on combined R&D and capital expenditures in 2024, and they actively compete—meaning they generate publicly reported revenues—in at least three future arenas.107 These criteria offer the benefit of simplicity, although we acknowledge there are challenges in the measurement itself. For one thing, arena participation can take many forms, not always generating revenue directly. For example, Apple is in chip design for its own internal use.108 Alphabet has invested in a long-duration energy storage company to accelerate progress in batteries.109 In Exhibit 12, we track such investment and projects in light blue, but our omniscaler definition is based on publicly reported revenue generation in at least three future arenas (as shown in darker blue).
The spending and earning criteria exclude several adjacent players for now, including both large spenders and multi-industry leaders. Some companies meet the spending threshold but remain focused outside arenas; one example is Toyota Motor (more than $30 billion in capital expenditures) in traditional automotive.110 Others meet the threshold but are concentrated in a single future arena, such as TSMC in semiconductors. Some are investing at scale in arenas close to their core business, like Walmart’s substantial growth in e-commerce and digital advertising, and may enter the omniscaler list as they expand into other areas.111 Conversely, companies such as Tencent and Uber span multiple arenas but fall below the top-spender bar, and Nvidia—despite leading semiconductors and playing in several arenas—remains relatively capital-light and also falls below the investment cutoff.112 Finally, inclusion depends on consistent public reporting. ByteDance may be a tenth candidate based on reported investment and multi-arena activity, but it remains outside the core list in the absence of comparable financial disclosures.
Omniscalers share a few common characteristics. First, their scope is wide. While our threshold was revenue generation in three arenas, by 2025, the average omniscaler participated in closer to six arenas. Alphabet reached nine.
Second, their depth can be substantial. Omniscalers account for a majority of revenue in cloud services, AI software and services, and digital advertising, for example. In each of these arenas, six or more omniscalers generate revenues.113 Yet they are more commonly new entrants in the other 15 arenas, where more focused players still hold sway. For instance, omniscalers hold just a small portion of global revenues in arenas like semiconductors, video games, and robotics, despite significant activity by them.
Third, the landscape is highly dynamic. Some arenas have become markedly more crowded in recent years, as seen in robotaxis—with Tesla and Amazon-owned Zoox intensifying competition with Alphabet-backed Waymo, the early leader (together with Baidu’s Apollo-Go).114 A comparable map in 2010 (Exhibit 12) shows a narrower scope and reflects more tentative cross-arena moves.
Seen over the years, their expansions almost look like convergence. For most omniscalers, a strong core business became a launchpad for cross-arena growth. Some started as digital natives, others from device- or hardware-led roots. Yet today, there is considerable overlap across digitization platforms and the AI foundation. Amazon and Alibaba moved from e-commerce into cloud and advertising. Microsoft expanded from software into gaming and cloud. Samsung is an established player in semiconductor value chains, while others developed proprietary chips or deep foundry partnerships. In recent years, all nine have made sustained, large-scale bets in AI.
At the same time, differences remain, especially in electrification and hard tech. The Tesla/X cluster started with EV and battery in electrification and has since entered robotics, space, and more. Alphabet entered hard tech through Waymo robotaxis and Wing delivery drones.
Lastly, omniscalers can act as major demand anchors, especially for the many industries upstream of cognitive and physical AI. For instance, Alphabet, Amazon, Microsoft, and Meta have all signed long-term power purchase agreements with nuclear power providers to secure clean firm power for data centers—a major driver of renewed interest in nuclear in the United States.115


Omniscalers generate more cash and invest it at higher intensity
Companies in future arenas, including omniscalers and others, grew revenues by 12 percent per year between 2022 and 2025, compared with just 1 percent for companies outside future arenas. But omniscalers’ revenue is an order of magnitude larger than that of other arena companies. By 2025, omniscalers averaged about $200 billion in revenue each in future arenas, while other arena players averaged about a twentieth of that, about $10 billion each. In total, combining both future arenas and their other businesses, the omni-9 generated revenues of about $2.7 trillion in 2025. For context, $2.7 trillion is bigger than the GDP of Italy, the eighth-largest economy in the world.116
Cash flow is a key enabler fueling cross-arena expansion. From 2022 to 2025, the nine omniscalers generated, on average, operating cash flows equivalent to 26 percent of revenues every year, compared with about 16 percent for other companies in arenas and about 13 percent for players in other industries.117 The scale is even clearer in absolute terms. In 2024, the omni-9 generated roughly $640 billion in cash, about the same as annualized US bank lending to nonfinancial businesses, and roughly three times total US equity issuance that year.118 And while omniscalers have ample cash on their balance sheets and innovation capabilities in common, as noted above, how they initially earned them is quite distinct.
Omniscalers invest more than other arena players (Exhibit 13). From 2022 to 2025, omniscalers invested, on average, about 31 percent of their revenues in R&D and capital expenditures. That level of investment was much higher than for other companies in arenas (22 percent of revenues) and three times as high as what’s seen in other industries (9 percent of revenues). To put this in perspective, nine omniscalers spent about $800 billion in 2025, more than half of the amount invested globally in the electricity sector that year. 119
The features above are only some of what differentiates omniscalers from other players, though these factors do not fully explain their success. Others, including player-specific advantages—such as risk appetite, reputation, data access, and other capabilities—also matter (see sidebar “Why cash is not enough: Innovation in the omniscaler capability stack”).
All these observations reflect recent historical performance; whether omniscalers’ scale and elevated investment translate into sustained efficiency and attractive returns over time in the arenas where they are now expanding remains to be seen.

The arenas are concentrated in the United States and China
In the original arenas report, companies based in the United States and Greater China were disproportionately represented in past arenas. The outsize exposure of the United States to arenas since 2005 has reflected and reinforced its faster economic growth. This dynamic remains true in the latest analysis, focusing on the 18 future arenas, but with differing regional dynamics coming into focus.
Arena-leading companies like US-based Nvidia and China-based BYD illustrate how competitive dynamics are playing out differently across regions. In semiconductors, Nvidia has materially reshaped the value mix among US-headquartered chip companies through its sharp rise in revenues and market cap. In EVs, BYD’s rapid scale-up has driven China’s share of global revenue higher even in the face of intense price competition.120 In Europe, ASML’s role in advanced lithography underscores how specialized capabilities can anchor global positions in key arena value chains, while Japan’s Fanuc illustrates the region’s strength in robotics and factory automation. And multinational companies scaling in arenas are expanding to new hubs in emerging markets. For example, Morocco and Indonesia are attracting investment in batteries and critical materials to serve global EV supply chains.121 As national market dynamics vary, so too do companies’ performance metrics in arenas. Here, we go beyond market cap and revenue to include investment and returns. Tracking these metrics helps reveal a fuller picture of regional dynamics at work (see sidebar “Defining regions by company headquarters”).122
Arenas have grown the most in the United States, with Greater China gaining ground
In the United States and Greater China, we found more arena-leading companies and more of the ingredients that make up the arena-creation potion.123 In the rest of the world, there are fewer companies participating in arenas. And while past and future arenas have grown in market cap and revenue share everywhere, the patterns and underlying forces at work differ across regions (Exhibit 14).124 Market cap and revenue are our primary arena measures, but they are shaped by structural differences by region. We complement them with a view of investment, profitability, and technological progress.
Companies headquartered in the United States have high exposure to arenas. In our set of companies, their combined market capitalization in past and future arenas accounts for more than half of total US market cap. About 37 percent of the US market capitalization total is in future arenas alone. In revenue terms, the arenas’ shares of the US total is smaller, but the increase over the past two decades has been no less dramatic.
Companies headquartered in Greater China have strengthened their positions markedly. The share of market cap in the future arenas among Chinese companies more than tripled over the past two decades, from 9 percent in 2005 to just over 30 percent in 2025. The region raised its arena market cap (past and future) to nearly 40 percent of its total market cap. By revenues, Chinese companies have arena exposure similar to that of US-headquartered firms, about one-quarter of total revenues. Chinese companies typically trade at lower multiples in all industries, which helps explain why the region’s revenue exposure is closer to that of the United States than its market cap is.125
Japan and South Korea have increased their share of market cap in future arenas while maintaining strong revenue exposure in past arenas, supported by industrial and consumer electronics. Europe, by contrast, remains less exposed. Only about 7 percent of regional market cap is in future arenas, with values changing more modestly over the period analyzed. That is to say, 93 percent of European companies’ market cap came from industries that did not make up the 18 future arenas. In the rest of the world, large companies headquartered in Uruguay, Chile, and Israel have the next highest shares of future arena revenues relative to other industries. In India, nine future arenas along with nine industries that have arena-like features in the local market context could generate $1.7 trillion to $2.0 trillion in revenues by 2030, up from $690 billion in 2023.126

Regional shares of arenas’ market cap vary, but the United States stands out
Another way to interpret regional positions is to compare who leads each of the 18 future arenas rather than measuring only how much of a region’s economy is exposed to arenas. The United States leads across arenas is the short answer, but the details matter.
By 2025, US-based companies accounted for roughly 75 percent of arenas’ market capitalization globally. US companies led by market cap in 14 of the 18 arenas (Exhibit 15), compared with leadership by revenue in ten. In other words, in four arenas where US companies lead in market capitalization, they trail in revenue. The gaps are in EVs, modular construction, future air mobility, and robotics. One contributor is valuation dynamics: US capital markets, by far the largest and most liquid globally, offer deeper funding and investor participation that can support relatively higher valuations.127 In both revenues and market capitalization, US omniscalers’ activity is the largest contributor to the arenas landscape, most visibly in the AI foundation and digitization, but increasingly in hard tech.
Greater China anchors electrification, which is part of a broader story. The region generates roughly 40 percent more electricity than the United States and EU combined.128 Among the three electrification arenas, Chinese companies lead in revenue and market cap. The region is home to about 70 percent of global market cap for batteries and nuclear fission as well as meaningful shares in EVs, semiconductors, and video games. China’s CATL and BYD, for example, sit near the center of global battery supply chains as well as EV supply chains (see sidebar “From leading EVs by scale to leading EVs by value”).129
China’s market-cap shares should also be interpreted in context. Some arena activity is carried out directly by government and is not captured in company-level measures, and state-owned enterprise valuations are not easily comparable with those of publicly traded firms; these considerations are especially relevant in arenas such as space and nuclear.130 Even where China does not lead in market cap value, its companies can lead on other indicators—for example, open-source AI downloads—while US firms lead in AI revenues.131 A similar pattern is emerging in bio-frontiers. Some analyses suggest China-origin molecules represent a very large share of “new to human” drugs, with reportedly 46 percent of new drug molecules that began human trials in the first half of 2025 originating from Chinese biopharma companies.132
Elsewhere, Japanese and South Korean companies play large roles in the robotics and gaming arenas. Together, they account for roughly a quarter of market cap in robotics and video games, even though their overall share in all arenas is modest. Robotics leaders such as Japan’s Fanuc have reported growing profits on rising factory automation demand, and both countries’ firms remain central to global console and mobile gaming production.133 In addition, companies headquartered in the region are key players in semiconductors (particularly memory and advanced manufacturing), led by global firms such as Samsung Electronics and SK hynix.134
Europe’s overall presence is modest, but it has clear specialized strengths. European firms hold a large share of market cap in non-medical biotech (about 45 percent of the global market) and a sizable share of obesity drugs and robotics. Novo Nordisk’s position among global leaders in GLP-1–based obesity therapies (notably Wegovy) illustrates Europe’s depth in bio-frontiers (see sidebar “Europe’s competitiveness in arenas of the future”). Europe also has standout arena champions, such as ASML in semiconductors equipment, even though the region’s aggregate position in semiconductors is smaller than that of the United States or Greater China. In digitization, the United Kingdom stands out as Europe’s strongest hub, particularly in e-commerce, and ranks fourth globally in country-level revenue for the theme.
Finally, the rest of the world is becoming increasingly relevant in future arenas, less as headquarters locations and more as hubs for capital, capability, and supply chains. Gulf sovereign wealth funds are mobilizing capital into arenas and partnering with arena champions, for example Saudi Arabia’s Public Investment Fund partnering with Google Cloud to build an AI hub.135 India is emerging as a meaningful arena participant, with growing momentum in modular construction and robotics adoption.136 Elsewhere in Asia, the Association of Southeast Asian Nations is gaining relevance as an arena-linked supply chain hub amid trade realignment.137 Israel remains a standout in cybersecurity, with the sector accounting for 52 percent of Israel’s private tech funding in the first half of 2024, and it continues to draw global interest (for example, Palo Alto Networks’ acquisition of Israel-founded CyberArk).138 In parallel, resource-advantaged economies are attracting arena-linked industrial investment; for example, Morocco in phosphate-linked battery materials and Indonesia in nickel-linked battery supply chains.139


Including investment and profitability gives a fuller regional view of arenas
Beyond market cap and revenue share, we look at capital expenditure and return on invested capital to learn more about regional inputs and outcomes.140 Structural conditions across regions shape these patterns, but several notable exceptions also emerge; we explore them further below.141
As noted above, market cap values tend to be higher relative to revenue for US companies compared to Chinese companies, and that is especially true in future arenas (Exhibit 16). US companies in arenas also account for a higher share of capex and R&D versus other US companies. The higher corporate investment in arenas is not the case for investment more broadly; across all public and private fixed-asset spending, China invested roughly $7 trillion economy-wide in 2024, about 20 percent more than the US figure of $6 trillion.142
Across regions, US companies show the strongest profitability in the future arenas, with ROIC of 29 percent. Chinese arena returns remain lower than those in the United States and Europe, at about 18 percent, reflecting broader market differences and patterns of competition. Cross-country ROIC comparisons are directional due to measurement challenges as well, since differences in accounting, financing structures, and policy support (including subsidies) can affect both reported profits and measured invested capital. Results should therefore be interpreted in regional context.143 Within China, arenas generate roughly twice the ROIC of the broader corporate baseline, indicating that they represent a disproportionate share of the country’s higher-return opportunities.
Europe’s arena exposure is comparatively low in revenue, market cap, and investment, yet it ranks second on profitability. Even here, though, the five-percentage-point gap with US companies is larger than in non-arenas: Europe’s economy-wide ROIC in the data set averages about 18 percent versus 21 percent in the United States (2022–24).
Japan and South Korea illustrate a different profile with more concentrated exposure anchored by a handful of technology-intensive champions. And while only 6 percent of their company revenues come from arenas, one-fifth of their investment in capital expenditures and R&D does, reflecting the weight of capital-intensive, innovation-driven sectors. Arena ROIC in both countries is three percentage points higher than their country averages, shaped in large part by giants such as Samsung and NTT.
In emerging economies and the rest of the world, recent foreign direct investment points to a meaningful build-out of future-shaping capacity beyond today’s largest arena hubs. Other MGI research shows that announced projects in future-shaping industries that largely overlap with arenas could more than quadruple battery manufacturing capacity outside China, underscoring that emerging economies remain important hosts and builders of new industrial capacity.144 India illustrates this momentum. Announced greenfield investment into India rose by about 35 percent in 2022–23 compared to prepandemic averages, driven largely by manufacturing, electronics, IT, healthcare, and renewable energy.145

Arena implications and actions for decision-makers
The future arenas are already transforming the economy. We are all in arenas now, in one way or another. This is true at the individual, household, company, city, country, and global level.
As future arenas set a faster pace for growth and dynamic competition, the impact of the AI economy is coming into view. A rapidly expanding AI foundation is reinvigorating the digital wave and opening opportunities related to electrification, hard tech, and new bio-frontiers. At the same time, a new type of company—the omniscaler—brings a new set of capabilities, and a lot of generated cash, that can further raise the stakes in existing and emerging arenas as their collective investments reach unprecedented levels, even while the economic impact remains to be seen.
Whether or not all of the 18 future arenas go on to outperform other industries and become full-fledged arenas is far from certain. Much will depend on the three swing factors identified in our original report.
- Geopolitics is increasingly shaping investment in semiconductors, battery supply chains, and more.146 Looking ahead, the trajectory of policies on trade and national security, for example, could greatly affect how and where arena companies operate, especially if more technology stacks become regional.147
- AI development and adoption together have been critical forces behind the results described in this report. How AI progresses not only will affect the massive valuations in the AI foundation but could determine the pace of growth of every other arena.
- The pace of electrification will be reflected in the growth of EVs, batteries, and nuclear fission in some regions. It could also open opportunities for other related industries to reach arena status.
These swing factors help inform downside risk at the same time they may open new doors. Swing factors allow for future repositioning and even launches into new industries and business models that may otherwise be defended by incumbents with scale advantages or the like. And even when arenas look likely to outperform other industries at aggregate levels, there are no guarantees for individual companies. With heightened investment expectations come heightened risks.
As this report shows, major shifts are possible—even in a one- to two-year period. We will continue to watch how the arenas develop and update as needed.
Strategy in the arenas
For companies competing in or anywhere near future arenas, blind spots may be widening. Traditional strategy tool kits are no longer adequate, and the risks and rewards of getting it right are ever increasing.148
For any CEO, the central question is whether exposure to arenas will improve the fundamental drivers of value in the business: returns on invested capital and growth. We generally see four foundations that underpin long-term value creation from strategy; they are ROIC and growth as the financial drivers, managing for the long term, market attractiveness, and competitive advantage.149 The opportunities and demands of arenas intersect with all four.
In response, CEOs and senior executives could benefit from understanding their companies relative to the full landscape of arenas and their upstream and downstream impacts.
To do this, CEOs and senior executives could first think about proximity and ask: Is my company competing in an arena? Is it near an arena that affects customer decisions, value capture, or control of key interfaces? Or is it on the fringe of an arena that will have incremental effects or impact on future competitiveness?
- In the arena: The combination of escalatory dynamics and the speed of change compresses decision windows and removes many of the options incumbents historically relied on. Here, committing early to a new success model, reallocating resources at speed, and reshaping governance to act with agility are three key tasks at hand.
- Near an arena: Even without directly competing in the arena, performance may be tightly linked to it, for instance as a supplier of components, infrastructure, services, or distribution. In such cases, the arena may represent a fast-growing share of the company’s value creation potential. In other cases, arenas nearby could become direct competitors for demand, requiring offensive or defensive moves. It can be useful to engage early, before value pools settle, using early signals to clarify where to play and what capabilities or partnerships could matter most while flexibility remains.
- On the fringe of an arena: Before new forces of demand even fully come into view, the risk is not disruption today but underperformance tomorrow, if peers adapt faster. Use added time to reallocate resources and otherwise get ready to move, as this positioning rarely remains static for long.
A second consideration is how an arena will affect a company’s core business. Will it be through the supply side (including production, operations, and input costs), through the demand side (revenues pools and customer shifts), or both? Assessing both proximity and positioning in production and revenues is what we might call activating “arenas radar” (Exhibit 17). This radar view helps track opportunities and threats over time by scanning signals, translating them into operational and growth implications, and aligning capital allocation accordingly.
Importantly, escalatory investment in an arena should not be viewed as an automatic imperative. McKinsey’s How strategy champions win research finds that above-median capital expenditure can help move companies up the Power Curve, but only when it is matched with a credible path to competitive advantage.150 Entering or expanding within an arena is therefore not simply about exposure to growth; it requires a clear view of whether the company can earn returns exceeding its cost of capital and defend its position as competition intensifies.

In Exhibit 17, we sketch the “arenas radar” view for a multinational retailer. In arenas, the company may be competing in e-commerce and digital ads, for example. Delivery drones (developed within the future air mobility arena) emerged adjacent to e-commerce as a potential disruptor. Robotics could likewise streamline warehouse logistics. In both cases, a question arises of whether to partner, procure, or even build an in-house capability to be even more competitive in core businesses—or be left behind. On the revenue side, this retailer could spot opportunities to offer new nonmeat protein products, biomaterials, or drugs on its shelves, tracking the latest in bio-frontiers.
The arenas in the “bull’s-eye,” where a company can compete or already is competing, need to be incorporated into strategic planning for financial and talent investments. That planning must reflect the intense mode of competition arising from the elements of the arena-creation potion. Ask whether your company is keeping up with the technology resets and escalatory investments related to production. Is your company adequately gauging market growth and figuring out how to address new demand to generate revenues? For companies in or adjacent to arenas, this may imply allocating capital earlier and more aggressively, either to defend access to critical inputs—such as computing power, energy, and supply chain capacity—or to fund entry into newly opening markets before too many others arrive.
When arenas are further away, there is still a need to move quickly to allocate resources competitively. On the production side, ask: Are there any arenas that might transform corporate operations? On the revenue side: Are there new opportunities in arenas with growing markets to pursue?
Depending on a company’s core business, fewer arenas might be on the radar compared with retail, but with even more critical dependencies. A machinery manufacturer upstream of the physical AI arenas might see demand transformed; knowledge industries have high productivity potential from AI software and services; and food and fashion industries are adapting for populations with widespread access to weight-loss drugs.
Implications beyond strategy
The implications extend beyond the executive suite. Tracking arenas also makes sense for investors aiming to maximize their returns, job seekers searching for careers in growing industries, and policymakers looking to play a role in how and where these industries develop.
As capital, innovation, and talent shift ever faster, policy choices increasingly determine where ecosystems will reach scale and who captures value. Chapter 4 highlights how regional systems are already producing divergent outcomes; US strength in the AI foundation reflects deep capital markets and omniscalers’ ability to mobilize infrastructure at scale, while China’s position in electrification reflects faster build-out and execution capacity in EVs, batteries, and nuclear. In many arenas, time to scale is emerging as a differentiator. Permitting speed, grid and energy availability, and predictable rules can shape investment flows alongside technological advances.
The same analytical approach used for companies applies to countries, regions, and cities. Useful questions include “Is the region already in an arena?” and “How can the region realistically enter or secure an adjacent role?” A diagnostic that maps existing strengths (skills, infrastructure, supply chain links, and early private investment signals) against arenas can reveal potential growth opportunities. For example, a deep dive into the implications of the 18 future arenas for New York showed potential for growth in digitization arenas in particular as well as transformative potential for city life with physical AI and modular construction.151
Disruptive technologies change how we live and work. What policies and institutions are needed to channel these shifts for societal gain is a critical question beyond the scope of this report.
Understanding how arenas evolve and how they could further change the business landscape can offer valuable foresight today. The next big arenas of competition are closer and more consequential than many believe. If you are in an arena, the pace of change and competition is dizzying. If you are not, you risk being left behind or growing at a much slower rate. With a better grasp of arenas, leaders can anticipate—and act on—the accelerating pace of change.
Related Articles

The next big arenas of competition