If you went grocery shopping today, washed dishes, or installed wiring, chances are you came in contact with polyethylene (PE). PE is the most widely produced plastic in the world, used in packaging, construction materials, medical devices, and industrial products, among other things. Its durability, versatility, and low cost make it a foundational input in modern economies, and demand for it is closely tied to population growth, urbanization, and consumer goods consumption. As demand expands in emerging economies and global supply chains evolve, a central question is where new manufacturing capacity will be located in this highly competitive commodity industry. Competitiveness is shaped by access to feedstock, financing conditions, and industrial policies, but this is not a one-size-fits-all story.
The investment case is one of ten used in the research for the McKinsey Global Institute’s report, Catalyzing competitiveness: Where investment happens and why. The report examines how variations in the basic economics of comparable projects influence investment decisions in different regions globally and the impact those decisions can have on the future of competitiveness and growth across the world.
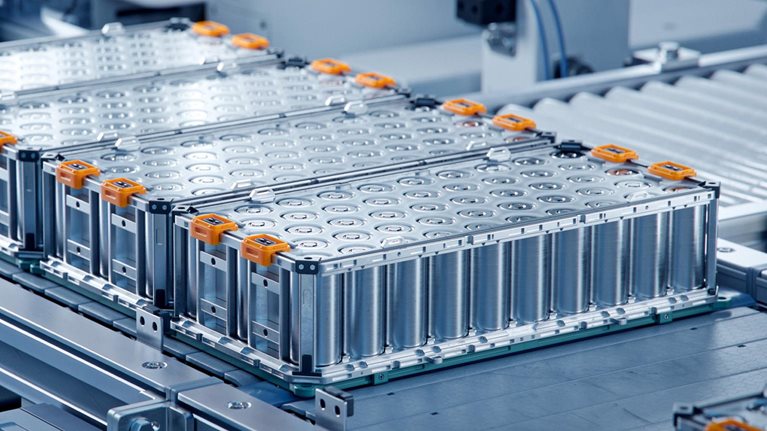
Polyethylene is the most widely produced plastic in the world
PE comprises several product types, each with a distinct end use. Most notable are high-density polyethylene (HDPE), which is used in rigid applications such as containers and pipes, and low-density variants that are used in flexible films like food packaging. The broader chemicals sector currently accounts for about $500 billion in global investment, reflecting the scale of the industry.1
Today, global installed capacity can produce roughly 150 million metric tons of PE per year. Before 2020, demand grew at about 3 percent annually. Over the past several years, growth in the industry has slowed to roughly 1 to 2 percent per year, but most long-term scenarios suggest that annual demand growth will rebound to about 3 percent, approaching 200 million tons annually by 2035 primarily due to demand in emerging markets. Meeting this demand would require ten to 25 new world-scale crackers, which are the large industrial plants that convert oil- and gas-based feedstocks into ethylene, the key building block of PE.2
Polyethylene is produced using ethane-based and naphtha-based routes
Two types of ethylene production exist, ethane-based and naphtha-based processes. Ethane is a light hydrocarbon extracted from natural gas liquids (NGL). Ethane can be significantly cheaper in NGL-rich regions such as the US Gulf Coast and parts of the Middle East because local supply is abundant, whereas moving ethane to other markets requires dedicated and costly infrastructure, including pipelines, refrigerated storage, and specialized shipping. Naphtha, by contrast, is an easily transported liquid traded in global markets, so its price is more internationally integrated and typically less discounted regionally than ethane. PE production in regions like China, Europe, Japan, and South Korea is primarily naphtha-based.
Because PE production technology is mature and widely standardized, competitiveness typically depends less on process innovation and more on structural advantages such as access to low-cost ethane feedstock. Currently, ethane-advantaged regions operate as export hubs. For example, North America exports more than 40 percent of its PE production, primarily to Asia and Europe, according to McKinsey analysis.
However, limited supply constrains ethane economics. For example, in the Middle East, governments allocate access to ethane, effectively making feedstock availability dependent on local industrial and resource allocation decisions. In the United States, by contrast, ethane is market-priced; if new crackers are built faster than the supply of ethane grows, or if export capacity keeps expanding and pulls more supply into global markets, ethane prices can rise and margins shrink. This creates an asymmetric global supply structure. Ethane itself may be low cost, but its price doesn’t determine the global market price for PE because volume is limited. As demand grows, especially in Asia, incremental supply will still require higher-cost naphtha-based production.
Importantly, even if sufficient ethane were available, ethane cracking cannot fully replace naphtha cracking in the broader petrochemical ecosystem. Ethane cracking is highly efficient for producing PE but generates limited byproducts. By contrast, naphtha cracking produces a range of byproducts that are essential inputs for materials such as rubbers, synthetic fibers, engineering plastics, and insulation.3
Naphtha cracking therefore has a structural role beyond PE production. As electrified transportation increases, declining oil refining could reduce the supply of naphtha. This, in turn, constrains the availability of critical petrochemical byproducts, particularly aromatics. While these materials can be produced through alternative processes, doing so is typically more costly and adds complexity compared to integrated naphtha cracking. Global competitiveness therefore cannot be assessed solely through ethane or PE economics, since the broader petrochemical ecosystem depends on a diversified feedstock mix.
China is the biggest investor in polyethylene manufacturing, while Europe could reposition much of its production
China accounts for the largest share of PE production capacity and investment, despite its processes being predominantly naphtha-based and so higher cost (table). This capacity is mostly linked to national oil companies, as well as other smaller private players. China’s plans to increase domestic production could move it toward self-sufficiency by 2030 if planned projects come to fruition.4 This has two potential implications: Global trade flows, especially from Middle Eastern and US export destinations, may shift significantly, and global capacity additions may exceed demand, pressuring margins even for competitive exporters.
Current polyethylene capacity and planned additions by country
| Country (primary region) | Installed capacity (million tons per year, 2025) | Capacity additions (million tons per year, 2025-2030)1 |
| China | 42 | 23 |
| North America | 34 | 2.3 |
| Middle East | 23 | 6.8 |
| Western Europe | 14 | 0.2 |
| Global | 156 | 31 |
Capacity growth in the Middle East and North America reflects those regions’ underlying advantages, particularly access to low-cost ethane. Europe is moving in the opposite direction, with limited new investment. Up to five million tons of yearly capacity of existing European ethylene plants could be phased out over the next five years.5 This reflects not only weaker feedstock competitiveness but also higher capital costs, longer and less predictable permitting timelines, and growing regulatory and societal constraints on plastics.
Overall, while investment in PE production generally follows cost competitiveness, China stands out as a major exception, accounting for a disproportionate share of new capacity despite challenging underlying economics.
Costs in naphtha-based regions are twice as high as in ethane-based regions
This case is based on a world-scale one-megaton-per-year ethylene cracker with an integrated 400-kiloton-per-year HDPE unit, operating at 90 percent utilization, consistent with the typical scale of modern, greenfield developments.6
The Al Jubail facility in Saudi Arabia is used as the base case because it illustrates the combination of low-cost ethane feedstock and mature industrial infrastructure, and it has proven execution capabilities. (The facility’s output was reduced during the war in the Persian Gulf in 2026.) We compare it to similar polyethylene investments in China, Germany, and the United States (see sidebar “Methodology”).
Benchmark: Saudi Arabia (Al Jubail)
The levelized cost of a facility like AI Jubail measures the average cost of producing one ton of PE over a facility’s lifetime, representing the breakeven selling price that yields zero net present value at the assumed discount rate. In Saudi Arabia it is about $660 per ton, the lowest cost in its peer group. Capital expenditures such as construction and equipment account for about half of the total levelized cost in Al Jubail (Exhibit 1). These costs include construction labor as well as investment in core processing equipment and supporting infrastructure. Operating costs such as labor, feedstock, utilities, and other expenses like insurance make up the remainder of the levelized cost.
Capital expenditures account for the greatest share of costs in polyethylene manufacturing except in China, where feedstock is the biggest cost.
1We consider a 400-kiloton per year high-density polyethylene plant fed by an ethane or naphtha cracker.
2Raw material costs are net of byproduct credits.

Feedstock costs are the major driver of variation across geographies
In the regions compared, levelized costs range from $660 per ton of PE in Saudi Arabia to almost double, $1,305 per ton, in Germany (Exhibit 2). Cross-country comparisons of PE economics are therefore most useful when they distinguish between the two production processes.
Feedstock and utility costs account for the variation in the costs of polyethylene production across countries.
Note: Numbers may not sum precisely due to rounding.
1We consider a 400-kiloton per year high-density polyethylene plant fed by an ethane or naphtha cracker.
Raw materials are the main source of cost variation. Ethane-based producers in Saudi Arabia and the United States benefit from access to locally priced ethane. In contrast, producers in China and Germany rely on naphtha, which is globally traded and typically more expensive. As a result, raw material costs net of byproduct credits in naphtha-based systems today are more than three times those of ethane-based producers, on average $450 per ton versus $160 per ton, accounting for roughly a third of the cost difference of ethane-based suppliers to Germany and explaining 90 percent of the difference to China.
The advantage of ethane-based producers stems not only from process economics but also from the broader structure of gas markets. In regions such as Saudi Arabia and the US Gulf Coast, natural gas and NGLs are locally abundant and costly to transport over long distances. Converting gas into petrochemicals is thus a means of monetizing stranded or regionally discounted resources, which lowers feedstock and utility costs in regions with abundant gas resources.
Utilities are the second-largest driver of cost differences and amplify feedstock disadvantages. While energy usage may not differ dramatically between ethane and naphtha, naphtha-based plants produce a wider range of byproducts alongside PE. Naphtha cracking produces significant fuel gas used in the process itself, but the energy required for polyethylene production and further processing of byproducts can increase overall energy requirements for fully integrated, naphtha-based plants. As a result, fully integrated naphtha-based plants tend to consume more energy overall. In regions that rely on imported fuels or globally priced energy, this can translate to utility costs five to seven times as high as those in Saudi Arabia. Utility cost differences account for about 25 percent of the variation in costs across regions.
Capital expenditures drive about 25 percent of the variation in costs. Germany has materially higher capital expenditures, $475 per ton compared to $290 per ton in the United States, because it uses naphtha cracking, which requires more complex equipment than ethane cracking. China’s capital expenditures of $245 per ton are materially lower, which reflects its lower construction and labor costs, standardized designs, and domestic equipment supply chains.
China’s PE investments have had low returns
PE is a globally traded commodity but is not sold at a single, uniform global price. While arbitrage can narrow differences in regional prices over time, price gaps typically persist due to freight and delivery terms, duties, product specifications, inventory cycles, regional market concentration, and trade barriers. Potential returns can be assessed using regional pricing rather than a standard market price.
In ethane-advantaged regions such as Saudi Arabia and the United States, export prices were about $1,000 per ton in 2025, implying an internal rate of return ranging from 10 to 15 percent compared to a levelized cost of $660 to $690 per ton. In Germany, higher regional prices of about $1,400 per ton of PE were offset by a similarly high levelized cost, implying an internal rate of return close to an 8 percent discount rate. China has a levelized cost of $1,135 per ton, compared to PE prices of about $1,000 per ton, implying returns at 1 to 2 percent, well below the discount rate typically expected by private investors (Exhibit 3).
Return expectations determine the viability of an investment in polyethylene manufacturing.
Note: Integrated high-density polyethylene production assumes a 400-kiloton per year ethane or naphtha cracker.
These differences can shed light on observed investment patterns. Strong returns could explain continued expansion in Saudi Arabia and the United States, while weaker returns may limit investment in Germany. China, however, breaks with the pattern. Despite low returns, it continues to add substantial capacity.
This divergence reflects differences in investor objectives. The 8 percent cost of capital reflects a typical private-market cost of capital. In China, however, most PE investment is state-driven. State-owned enterprises have added the majority of new PE capacity. Moreover, many new Chinese crackers are integrated with refining operations, giving investors access to profit margins across the full value chain rather than relying on PE economics alone.7
State-owned enterprises typically consider broader strategic goals such as industrial development and self-sufficiency over project-level returns. In that context, PE investment may proceed even when returns are low because the objective is partly to generate wider economic spillovers and resilience that private investors alone might not fund.
Compete on cost or alter the market
The key question for potential PE players is how to position themselves in a market where the basis of competitiveness differs so structurally by region. In ethane-advantaged regions, projects rely on maintaining cost advantages and managing exposure to global price cycles. By contrast, production in higher-cost regions is typically viable only when supported by local demand or favorable regional pricing.
In those higher-cost regions, the investment decision is often whether to reinvest in existing assets. Ethylene crackers require major refurbishment, which can cost hundreds of millions of dollars, every four to six years. Operators in Europe are increasingly deciding not to reinvest, shutting down crackers while continuing to run downstream PE assets using imported ethylene.8 This reflects a shift away from fully integrated production and toward more flexible models.
Additionally, competing in commodity PE is difficult, so higher-cost regions could shift production into areas where pricing is less globally arbitraged. Then, rather than trying to make the cheapest plastic, PE manufacturers could focus on making plastic that customers are willing to pay more for, whether through improved performance for specific applications or through materials with recycled content or lower emissions.
For policymakers, the implication is similar. In some cases, importing PE is the more efficient outcome, but domestic production may still matter for broader strategic goals. Thus, policy may play a more active role in higher-cost regions. Demand mandates like recycled content requirements can create guaranteed demand for specific types of PE. Waste regulations like restrictions on landfills or incineration increase the supply and use of recycled plastics. Carbon-related measures like carbon pricing and border adjustments can raise the cost of more emissions-intensive production.
Such policies can shift demand toward forms of PE that are not fully interchangeable with standard PE. This creates segments of the market where competition is based less on cost and more on sustainability or regulatory requirements, potentially allowing domestic producers to compete on different terms.
Polyethylene is a cost-driven industry at its core, but the terms of competition are not fixed. Regions that cannot compete on feedstock cost alone are finding ways to stay in the game, whether through value chain integration, product differentiation, or policy.