At a glance
- The ongoing Strait of Hormuz disruption is the latest—and largest—energy supply disruption. It may not be the last. Two-thirds of energy trade transits maritime chokepoints, and one-third crosses geopolitical lines. Ninety-five percent of people live in a region dependent on energy imports.
- The energy system has so far proven more resilient than expected. This is due mostly to temporary buffers and bypass pipelines for oil. Trade has rewired globally as China curtailed imports and the United States released inventories. The global economy has in many ways accommodated a drop in oil consumption—but unevenly, and the refining system is especially stressed.
- As the clock ticks, regions are pulling structural energy security levers. They range from electrification to coal, from rewiring trade to inventories and demand management. By 2030, responses underway or under discussion could offset 35 to 70 percent of the Strait’s precrisis oil flows in the event of a future shock. But implementation is uncertain and comes at a price. New pipelines are the cheapest option, yet they divert rather than displace Gulf oil and are vulnerable to broader regional disruptions.
- It’s not just the Strait: With energy security, there are no easy exits but room to maneuver. Replacing imports with mature clean technologies could, in theory, displace up to nearly one-third of oil and gas use. But it can be slow and expensive, and it hits hard ceilings. As a result, a combination of new sources of supply, infrastructure to rewire trade, and inventories plays an important role.
- Energy security concerns are reshaping the business case for resilience. While measures require investment, they also can cut costs over time, enable business continuity, and drive growth. Decision makers should map their exposure across fuels, assets, and routes—and act on it, from improving energy efficiency to building flexibility in inputs, suppliers, and logistics.
The on-and-off closure of the Strait of Hormuz is the most consequential in a succession of disruptions reshaping global energy and its flows. Over the past decade, markets weathered US–China trade tensions, COVID-19, Russia’s invasion of Ukraine, and increased geopolitical fragmentation. Taken together, they moved energy security—an economy’s ability to access energy to meet its needs within economic constraints, even during disruptions—from the back burner of strategic decision-making to its center.
The world has been here before. Past energy crises offer powerful reminders of what can be at stake: gas pump lines in the 1970s, double-digit inflation, recession, political upheaval.
This disruption initially brought back fears of this 1970s-type, worst-case scenario. At its peak, around one-fifth of the global oil and liquefied natural gas supply was exposed to disruption. After the Strait’s initial closure in March 2026, the conflict waxed and waned with closures and partial reopenings, as well as new regional disruptions at the time of writing. This has led to substantial uncertainty across energy markets.
But much of the global economy has held up better than perhaps had been anticipated, at least so far (though some regions were particularly affected). Growth slowed down but remained positive globally. Brent crude topped $120 but has since declined, albeit with ongoing swings.
What gives? It largely reflects a less energy-intensive global economy that is more reliant on services and energy system resilience built up over decades. The 1973 embargo led to fuel economy standards, nuclear energy expansion in some countries, and the creation of the International Energy Agency (IEA). With the lessons from past crises, the world benefited from strategic petroleum reserves, bypass pipelines for oil, and a diversified global trade network that was able to rewire. The world has shock absorbers, albeit imperfect, that were much more limited 50 years ago.
While these have kicked in, they have real limits. Pipelines and alternate routes have themselves been disrupted. Inventories aren’t infinite. Stress in parts of the system, particularly refining, has led to some demand destruction, with vulnerable societies bearing the brunt of economic pain. Uncertainty persists regarding when the crisis might be resolved. These factors are leading to concerns about long-term energy security that will outlast this disruption.
This report explores how shock absorbers helped cushion the blow of the world’s largest energy shock, what it reveals about the resilience—and lingering vulnerabilities—of today’s system, and how countries and companies in the energy sector and beyond may prioritize energy security going forward.
Energy security is less about eliminating dependencies than managing them effectively. There is no single route to resilience. Decision makers will need to build a portfolio of levers to prepare for future shocks. Different measures work over different time horizons, in different contexts, and with different trade-offs—including their emissions footprint—at a time when the world is already not on track to meet the goals of the Paris Agreement.1
Ultimately, there are no easy exits, but there is considerable room to maneuver. For countries and companies that get it right, energy security need not simply be a cost to bear. It can reduce exposure to volatility, strengthen business continuity, and open opportunities to better navigate a more volatile future.
The shock and the shock absorbers
The 2020s have been marked by big disruptions affecting global energy and trade. But the Strait of Hormuz crisis of 2026 is in a category of its own.
How has the energy system borne the largest energy supply disruption in modern history? Thus far, it has proven more resilient than feared.2 Much of the blow was cushioned by security measures implemented after past crises—namely, inventories and pipelines.
Oil consumption has taken a hit, though a less energy-intensive global economy and users who were flexible enough to work around it reduced at least some of the economic damage.
On net: China imported less, the United States exported more, trade rewired.
But current resilience measures have limits. Prices have increased, inventories are thinning, the strain on refining systems is rising, pipelines have themselves been exposed to disruption, and the shock has not been borne evenly across countries.
The Strait of Hormuz disruption affected one-fifth of the global supply of oil and liquefied natural gas
The Strait of Hormuz is among the world’s most critical energy system arteries. Roughly 20 percent of global oil and the same for global liquefied natural gas (LNG) normally transits the Strait.3
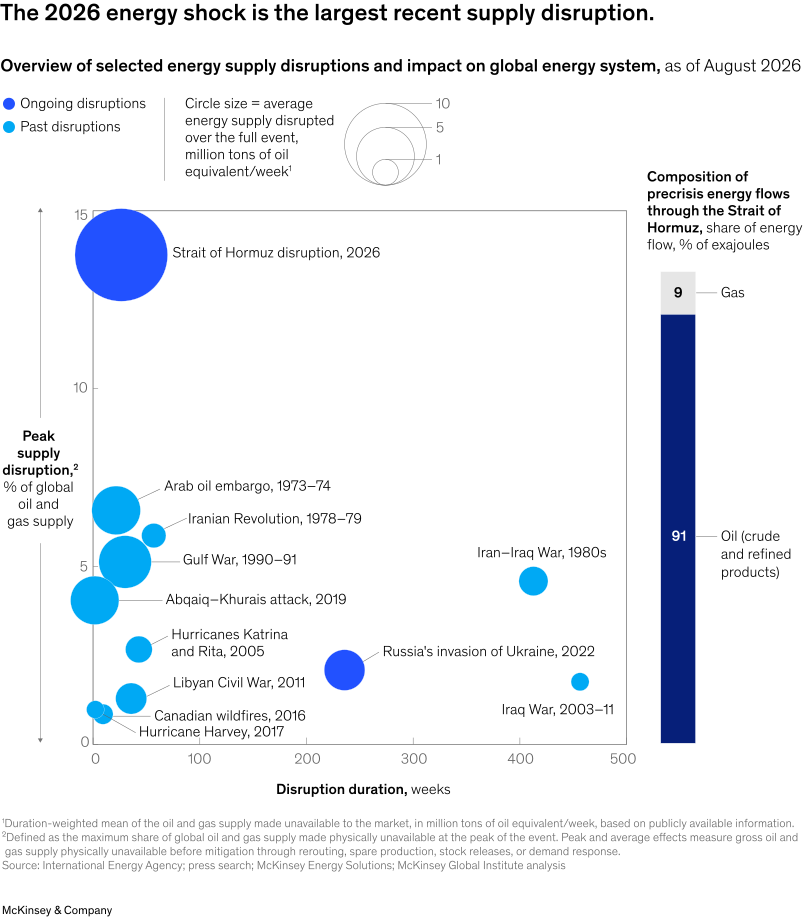
While the closure of the Strait has made an impact on many commodities, energy has been particularly affected.4 The largest hit so far has been to oil, including crude and refined products. Oil accounted for 91 percent of energy affected, while gas accounted for the rest. Used mainly for transport fuels (gasoline, diesel, and jet fuel) and petrochemicals, oil has few substitutes and is unevenly distributed geographically. That makes it a particularly challenging energy dependency to unwind. On the other hand, only 3 percent of gas supply has been directly affected. Even though one-fifth of LNG trade transits the Strait of Hormuz, LNG itself is under 15 percent of global gas supply.
All combined, at its peak the closure of the Strait disrupted 14 percent of the global combined oil and gas supply, more than double the relative size of the 1970s oil shocks and over six times Russia–Ukraine’s peak impact in 2022 (these lasted longer than the current disruption has so far) (Exhibit 1).
The energy system has thus far proven largely resilient, but unevenly
This is not the late 1970s or early 1980s. An oil shock the size of the current one would have depressed the US GDP growth rate by about 5.6 percentage points in 1980—about 20 times more than now—according to a Federal Reserve Bank of Dallas estimate.5
Brent crude oil prices temporarily spiked to four-year highs above $120 a barrel, but have since declined, and at least so far have not returned to those levels.6
It’s not the ’70s anymore: Inventories and bypass pipelines absorbed most of the shock before it reached oil consumption
Since the supply shock has been overwhelmingly to oil, it serves as the clearest test of the system’s shock absorbers. Around 21 million barrels per day (MMb/d) of oil—16 MMb/d of crude and 5 MMb/d of refined product—flowed through the Strait in the fourth quarter of 2025.7 Our analysis contrasted this with when the Strait closed, focusing on the second quarter of 2026.8
Importantly, not all flows had to be replaced (Exhibit 2). Some cargoes kept moving through the Strait (3.3 MMb/d), including Iranian ones. Additionally, the market came into the disruption flush with oil. China and others were building inventory for years in the lead-up to the shock. Halting this took demand out of the market without reducing end consumption, bringing the gap to only 15.5 MMb/d.
Rerouting via pipelines and increased production closed about 35 percent of that 15.5 MMb/d in the period examined. Two pipelines allowed crude to bypass the Strait: Saudi Arabia’s East–West pipeline and ADNOC’s pipeline to Fujairah. Running both harder helped move an additional 4.7 MMb/d around the closure.9 A further 0.5 MMb/d came from additional production, particularly in Brazil, Kazakhstan, the United States, and Venezuela.10
Inventories helped to the tune of an additional 20 percent, particularly emergency oil stocks established under the IEA after the 1970s. Countries tapped about 3.5 MMb/d of oil inventories (mostly crude, but also products).11 Of that, about 2.5 MMb/d came through coordinated IEA action, with the United States supplying the majority through its Strategic Petroleum Reserve (SPR). A further 1 MMb/d came from China.
Reduced oil consumption accounted for about 45 percent, or 6.8 MMb/d. Of course, there is uncertainty in some of these figures; nonetheless, the numbers here are representative of how key shock absorbers have worked.

While oil consumption did take a hit, flexibility reduced some of the damage globally
Reduced oil consumption between the fourth quarter of 2025 and the second quarter of 2026 was equivalent to a decline of more than 5 percent.12 But the global economy did not correspondingly shrink, influenced in part by the fact that it is now less energy-intensive than in the past.13 The International Monetary Fund’s forecast for 2026 global growth fell from 3.3 percent before the conflict to 3.0 percent in July. The impact was far more severe in the Middle East, where GDP is projected to swing to a 0.5 percent decline in 2026 from 3.3 percent growth in 2025, driven by disruption to energy production and exports, as well as the broader impact of the conflict.14
In Europe, Latin America, and North America, oil consumption barely dropped. Flexibility in energy use helped other regions to some extent.
China accounted for an estimated 35 percent of the global oil-use drop.15 China’s economy was slowing, so some of that was inevitable. But China also demonstrated the role that flexibility played in absorbing the shock, relying on capabilities it had built over decades. Its refineries helped manage transport fuel shortages by prioritizing its production with available crude while reducing naphtha production. China’s chemical industry compensated for the loss in naphtha through alternative inputs and production routes, including imported US ethane and coal-to-chemicals conversions. 16 While China reduced exports of transport fuels to protect its domestic demand, it was able to even increase exports of some petrochemicals.17 Other substitutions occurred, for example, more high-speed train use and less flying.18
Advanced Asian economies such as Japan and South Korea reduced their demand by almost 20 percent, or 1.2 MMb/d. Refiners there also prioritized producing transport fuels. To compensate, petrochemical imports from China rose.19
While flexibility has helped to manage the hit, supply disruptions led prices to increase globally, particularly in refined fuels. The International Monetary Fund raised its 2026 inflation forecast in July to 4.7 percent from 3.8 percent preconflict.20
And the developing world experienced genuine shortages and rationing, not just higher prices.21 In India, liquefied petroleum gas (LPG) for commercial use was rationed to protect households.22 In the Philippines, the government moved public offices to a four-day week to conserve fuel.23
While gas was less affected globally, its disruption was more concentrated and likely to be longer lasting
The global supply shock to gas has been limited, but some regions have been especially exposed. LNG through the Strait of Hormuz is a large share of imports for Asia in particular. Furthermore, physical damage to production in the Gulf has been extensive. Two affected liquefaction units, representing about 17 percent of Qatar’s export capacity, or 3 percent of all global LNG supply, were damaged and are expected to take three to five years to rebuild.24 As of late August 2026, benchmark gas prices in Europe and Asia were close to double their previous-year value.25
Some structural relief came from non-Gulf production, which in the second quarter of 2026 was 16 percent higher year-on-year.26 New supply offset roughly three-quarters of the loss in LNG relative to the previous year, led by US projects that mostly came online in the second half of 2025. The rest was met by demand reductions. In Asia, coal switching in the power sector helped, but other sectors were affected, for example, fertilizer production.27 In Europe, some of the shortfall was absorbed by a slower buildup of gas inventories for the winter.28
How China and the United States rewired trade and rebalanced the oil system
The shifts described above in global oil markets—inventory releases, pipelines, new production, demand changes—contributed to a rewiring of global trade.29 All told, more than one out of every five barrels of seaborne oil traded in the second quarter of 2026 was rewired relative to precrisis flows30 (Exhibit 3).
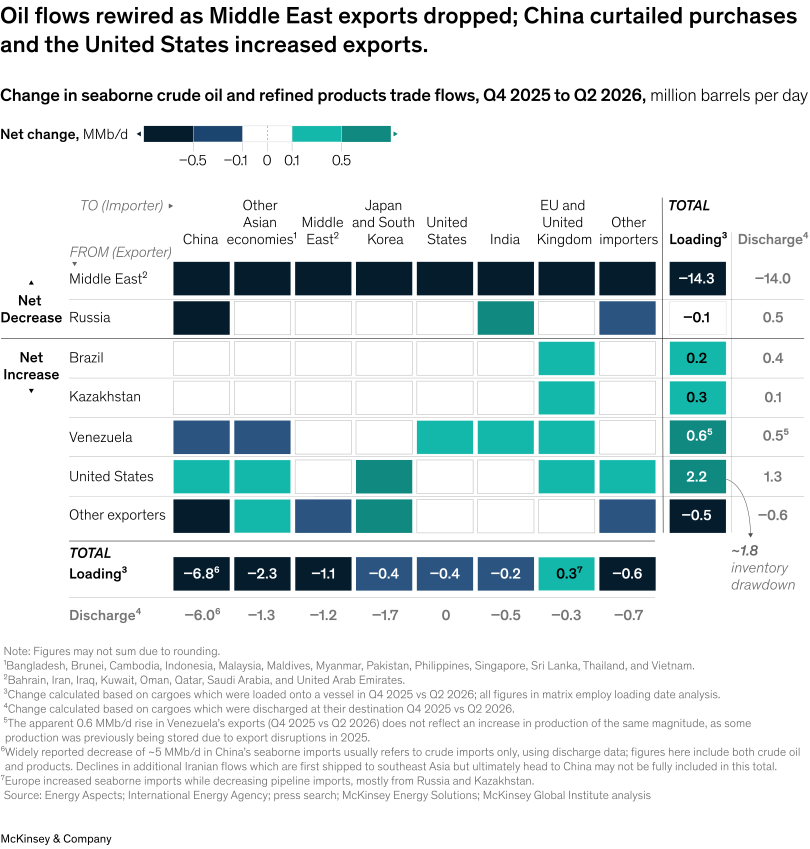
China played the largest role in absorbing the shock, moving from building to drawing inventories and reducing oil consumption.31 As a result, its imports of seaborne crude oil and refined products fell over 40 percent from preconflict volumes.32 This freed up cargoes for other importers in Asia.
The US release of inventories of 1.8 MMb/d and its own production increase allowed it to raise exports by 2.2 MMb/d (20 percent) from the fourth quarter of 2025.33 This helped Europe and South Korea avoid significant import reductions. Other producers also helped by increasing exports.34
Shock absorbers have limits, and the cushion is wearing thin
Today’s shock absorbers have worked better than may have been anticipated but have had their limits—which are becoming clearer. Refined-product prices have risen. Countries have not borne the brunt of the shock evenly, with some markets experiencing shortages. The East—West pipeline, a vital buffer to the shock, has itself experienced disruption, as have alternate shipping routes through the Red Sea.35
Importantly, inventories, which have been instrumental in managing the damage thus far, are seeing signs of strain. While aggregate figures show that the world is nowhere near running out of oil inventories, two issues are emerging. First, the specific inventories that have done the most work are being drained quickly. Second, the emerging bottleneck is increasingly refining, where buffers were thinner coming into the shock and are fragmented across products.
Take the first issue. By late August, about half a billion barrels had been drawn from inventories globally, equivalent to the global economy’s five-day need for oil (Exhibit 4). The US draw—the largest globally—was mostly from the government-owned reserves. The SPR had already fallen from about 600 million barrels before 2022 to around 400 million by the end of 2025; by late August 2026, it had declined further to less than 300 million.36 That’s at historical minimums and is gradually approaching the floor of how low it could go.37
Meanwhile, the largest remaining crude stockpiles sit in China, which entered the crisis holding around 1.4 billion barrels. Yet large stocks don’t automatically translate into large releases: China has so far drawn relatively little from them.
The second issue is that the refining system is under the most pressure and has the least cover. Gulf refineries have cut output by over one-quarter, not just because of disruptions to the Strait but also because many of them have been damaged.38 At the same time, close to 2 MMb/d of Russian refining capacity is estimated to be offline in mid-July.39 Refineries in other regions are running at almost full capacity but haven’t been able to fully replace that lost output. Moreover, efficiency losses are biting as refiners adapt to crude grades they were not optimized for, leading to lower yields of the products most in demand, such as jet fuel and diesel.40
Product inventories can bridge only part of the gap. Refined product inventories have so far been drawn more slowly than crude. More than 70 percent of the barrels made available by the IEA-coordinated release were crude.41 But that does not imply a longer-lasting cushion. Refined-product stocks are thinner than crude’s and fragmented by both fuel and location. Diesel cannot substitute for jet fuel, and stocks in one market may not readily relieve shortages in another. Aggregate figures can therefore conceal local scarcity. While product stocks in Japan and South Korea have held up, by late July inventories of many products, from jet fuel in Europe to gasoline in the United States, were hitting five-year minimums.
The combined effect of refining disruptions and limited product inventories has already translated into higher prices. While the clock ticks on the crisis, the damage could hit demand, especially if inventories are no longer able to respond as much as they have so far. The 1970s established strategic crude inventories; now 2026 may signal more efforts to shore up buffers for refined products.42
Oil inventories have been drawn unevenly across fuels and regions.
1Five-year minimum inventory level between May 2021 and May 2026.
2Historical minimums are recorded from 1984 for OECD countries and from 2010 for non-OECD countries, and up to February 2026.
3Based on officially known inventories.
4US Department of Energy, SPR statutory authority policy.
5Due to data availability, the displayed chart and rate of decline correspond to the March–May period, while declines in other regions correspond to the March–July period.

The energy system has proven more resilient than anticipated thus far. While our analysis focused on the period through the second quarter, developments at the time of writing present a mixed picture. On the one hand, crude oil flows through the Strait of Hormuz were reported to be picking back up, potentially easing some pressure, although the scale of any recovery—and whether it could be sustained—remained uncertain.43 On the other, intensifying conflict in the Red Sea and pipeline disruption threatened to disrupt alternative oil export routes that had helped bypass the Strait. The crisis remains far from resolved, and substantial uncertainty persists about how long the shock will last and whether widening disruptions could undermine the mechanisms that have helped cushion it.44
Against that backdrop, the limits of existing resilience measures are becoming apparent. Past crises show that such conditions, particularly linked to large and prolonged shocks, can yield lasting energy system transformations (see sidebar “Lessons learned from past energy shocks”). In the next chapter, we turn to the responses under consideration by economies and their implications.
Energy security in action: Can a Hormuz-shaped hole ever be filled?
Countries and firms are starting to act to lower exposure to the Strait of Hormuz and reduce energy security risks more broadly. Measures range from speeding up electrification and creating alternative oil and gas supply to building additional pipelines to circumvent the Strait.
We take stock of these efforts broadly and also assess what they could do for future reliance on the Strait of Hormuz specifically. We estimate that measures already underway or under discussion could offset between 35 and 70 percent of precrisis oil flows through the Strait by 2030, in the event of a future shock.45 This range depends largely on how many new 2026 discussions translate into realized projects.
This offers a real-world illustration that the energy security tool kit can achieve substantial results, but it is not a forecast. Implementation takes time and money and is not a given.
It also underscores that energy security is about managing vulnerabilities and trade-offs, not eliminating them. The measures being considered are unlikely to displace Gulf supply in normal circumstances. What they do is create optionality to flows through the Strait itself in the event of a shock—by both creating excess capacity elsewhere and enabling alternate routes. Bypass pipelines in particular drive most of the potential offset. They reduce exposure to the Strait but can leave Gulf oil still exposed to broader regional disruptions, including those that could threaten the pipelines and other energy infrastructure.
Economies are implementing a wide range of structural levers to build resilience
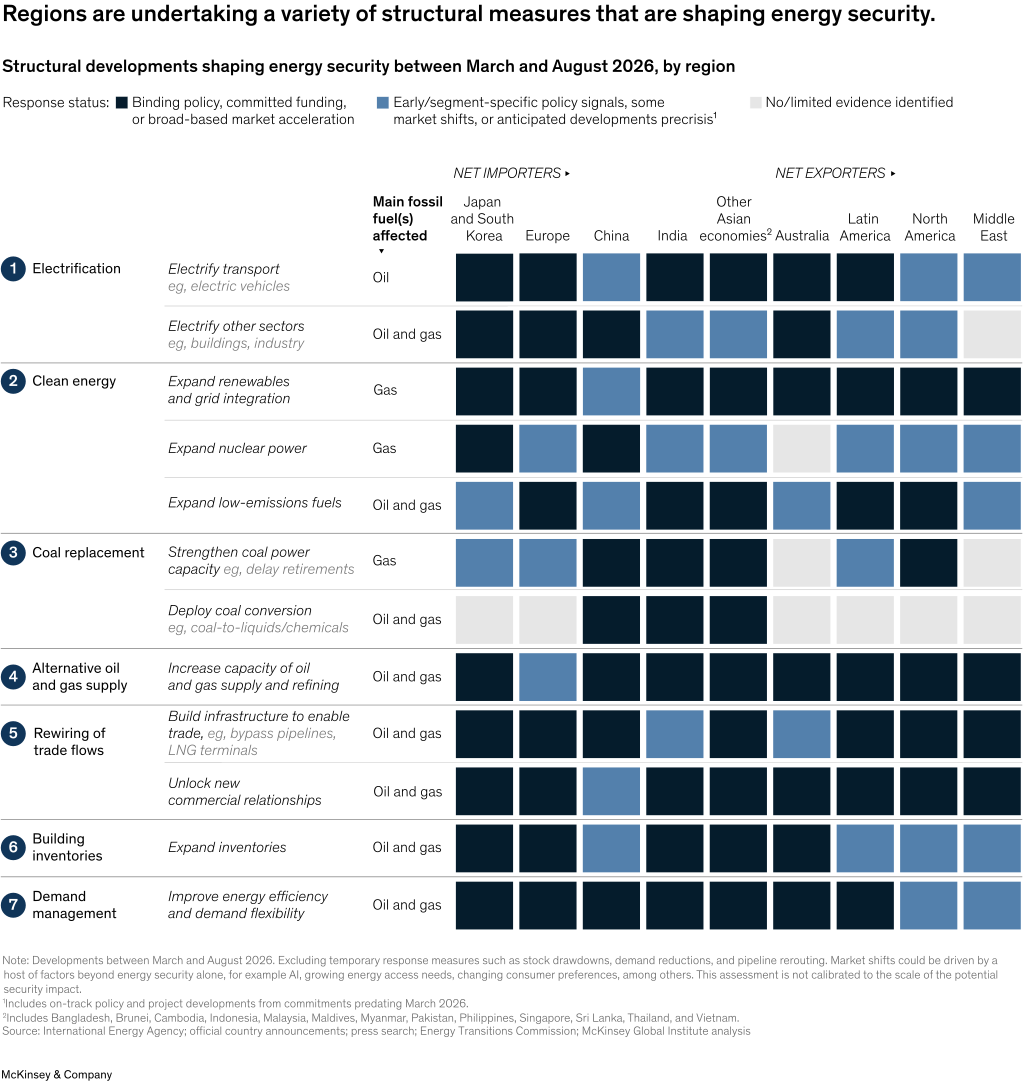
Regions are undertaking structural changes to enhance the security of their energy systems. We catalog market actions, policy shifts, and new project developments since March 2026 across seven structural energy security levers.46 We focus on actions that would directly transform how economies produce, trade, and consume energy. In some cases, these include measures influenced by broader market forces and policy goals, which also contribute to building energy security (Exhibit 5).
The first three levers substitute oil and gas with other forms of energy. Two of them also support greenhouse gas reduction:
- Electrification replaces oil and gas in end uses by deploying technologies like electric vehicles (EVs) and heat pumps, which are generally more efficient and can be powered by diverse—and domestic—electricity sources. Acceleration of this lever has been uneven globally in 2026. Global EV sales flatlined in the first half of 2026 year over year, mostly due to China and the United States.47 However, they grew in other regions, for example, more than 30 percent in the European Union during the second quarter of 2026 and roughly doubled in Australia, India, and South Korea. New policy measures such as AccelerateEU were launched to support further electrification.48
- Clean energy replaces oil and gas for electricity and heat generation, both in the context of existing uses and to power new electrified uses like EVs. Much of this effort centers on expanding domestic low-emissions power generation. The picture across regions is mixed. Globally, renewables capacity growth slowed in the first half of 2026, driven by China.49 But in many other regions, deployment grew over the same period, and new policy instruments were put in place.50 Investments in grids and storage have also stepped up to support reliability.51 Japan has accelerated plans to restart nuclear reactors.52 Implementation is also being catalyzed by forces outside of energy security, such as AI build-out.
- Coal replacement, like clean energy, powers electrification but increases emissions. Many countries have domestic coal resources and power capacity. Countries slightly increased coal-fired generation in the first half of 2026, in part to compensate for lost gas imports.53 More structurally, though, some Asian and European countries have delayed or are reviewing retirements of existing coal plants for several years to retain spare capacity.54 Coal can also be converted into fuels and chemicals to directly replace oil and gas. Coal-rich China and India have announced new coal conversion capacity.55
The next three levers secure oil and gas supply and use:
- Alternative oil and gas supply diversifies production and could reduce exposure to geographic chokepoints. Net exporters in the Americas are pulling this lever hardest. US oil output has risen to a new high, and new capacity increases have been announced.56 Argentina and Venezuela have accelerated ongoing projects, and Canada has announced increased ambitions.57 Norway and the United Kingdom are discussing new oil and gas capacity.58 Australia is studying its first new refinery since the 1960s.59
- Rewiring of energy trade flows enables existing and new sources to reach markets through a broader range of trade routes and partners, enabled by infrastructure and, in some cases, new contracts. Gulf exporters are building additional pipelines that circumvent the Strait of Hormuz.60 Canada and the United States are advancing LNG export infrastructure.61 On the import side, the European Union announced additional LNG import infrastructure.62 South Korean refiners started making operational adjustments to take a broader range of non-Middle Eastern crude, with SK Energy announcing plans for further retooling.63
- Building inventories provides a temporary buffer to shocks. Many countries with limited inventories have announced plans for new ones, including India, Pakistan, and the Philippines.64 Advanced economies that already held crude inventories are expanding their historically thinner product reserves; Australia has announced a new government-held reserve of 1 billion liters of diesel and jet fuel.65
The last lever reduces and better manages overall energy needs:
- Demand management reduces the energy required to perform a given economic activity or makes its use more flexible. Canada, China, and some European countries are preparing new efficiency standards for products from refrigerators to industrial electric motors.66 Some combine efficiency with electrification, such as programs that incentivize building insulation combined with heat pumps.67
Energy security levers offer optionality to the Strait, not displacement of Gulf oil supply
Many energy security measures being considered in 2026 could reduce reliance on oil flows through the Strait. How material could their impact be? How much would they cost? We examine structural levers that could have the most direct impact on security in the Strait.
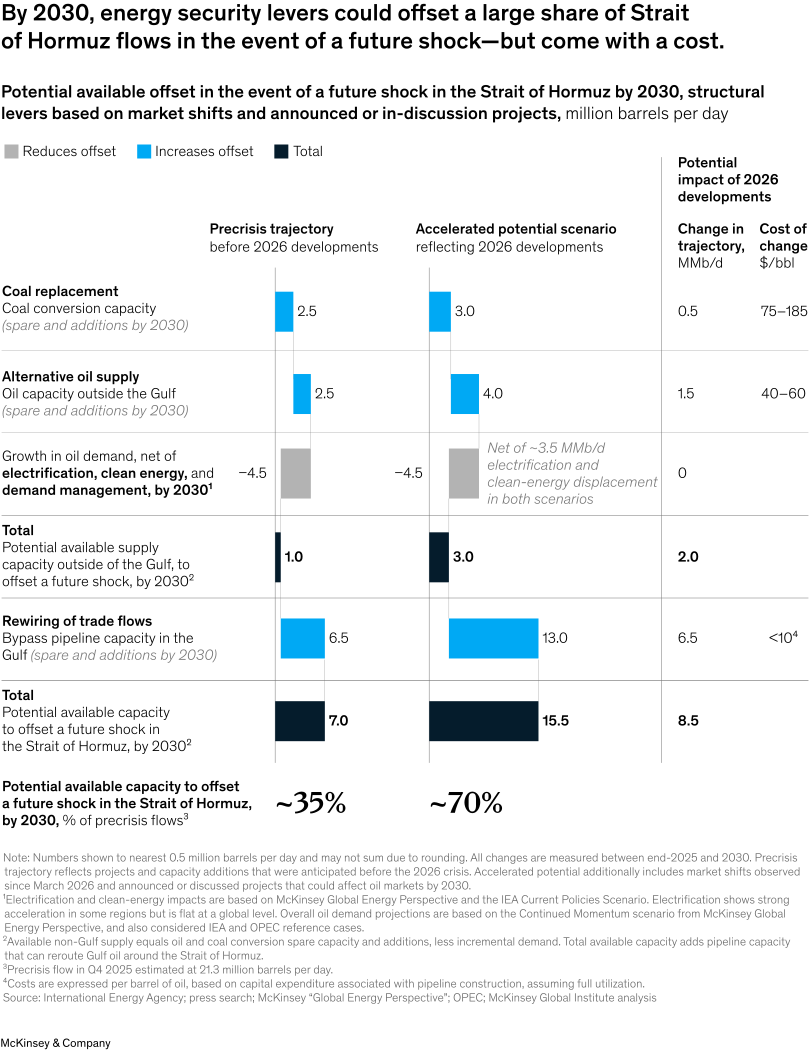
Our analysis considers a “precrisis” case, assessing the trajectory these levers were on before 2026. We also build an “accelerated potential” case factoring in developments since March 2026, including projects actively being discussed but not yet confirmed as of August 2026.68 Stacked, these levers reach 7 MMb/d of offset on the precrisis trajectory and as much as 15.5 MMb/d in the accelerated case, if all discussed projects came to fruition. Using Strait of Hormuz oil flows as a yardstick, this corresponds to about 35 to 70 percent of preconflict transit (Exhibit 6).
Available supply capacity outside of the Gulf to absorb a shock is limited, but bypass pipelines could play a significant role
To absorb a potential future shock, both existing spare capacity and new additions could play a role. Accounting for this, we estimate that coal conversion and oil supply capacity could each contribute around 2.5 MMb/d by 2030, on a precrisis trajectory.69 Additionally, they’ve experienced a post-shock acceleration of 0.5 and 1.5 MMb/d by 2030, respectively, based on announced projects.70 For oil, this includes a potential 0.5 MMb/d from Venezuela (further potential beyond 2030 is discussed in chapter 4). Put together, these developments add up to 5 to 7 MMb/d of capacity.
But this capacity will have to meet rising oil demand. Central scenarios imply roughly 4.5 MMb/d of net oil demand growth by 2030. This is even after accounting for increased efficiency, electrification, and clean energy—the latter two were on a precrisis trajectory to displace about 3.5 MMb/d of gross oil demand by 2030. 71 Why don’t these levers play a bigger role? Take EVs as an illustration. Sales are on track to be 30 percent of all new car sales globally by the end of 2026. However, they account for less than 5 percent of cars on the road.72 Transitioning the current stock of fossil-fuel-burning assets—from cars to boilers—takes time. Furthermore, electrification and clean energy trends have not yet shown evidence of post-shock acceleration at a global level, and even accounting for the regions where they have, the uplift in oil displacement has been relatively small.73
Combined, the supply and demand views suggest only about 1–3 MMb/d of potential available supply capacity outside the Gulf by 2030.74 While of course there is uncertainty around future demand, energy systems generally add supply to keep pace with it rather than maintain large amounts of idle capacity.
The last major lever being considered to bolster security is bypass pipelines. They could move the needle much further in terms of offsetting flows from the Strait in a shock, based on announcements and discussions to date. Bypass pipeline spare capacity around the Strait was already at 4.5 MMb/d before the crisis and was on track to reach 6.5 MMb/d by 2030.75 Since the crisis, many additional routes are being discussed, such as an Iraq–Turkey pipeline and a third pipeline connecting interior fields in the United Arab Emirates with the Fujairah port that could bring total diversion potential to 13 MMb/d in the accelerated potential case. The feasibility of them being built by 2030 is highly dependent not just on when projects are approved but when construction starts.76
Energy security around the Strait could rise—but measures come at a price and offer insurance, not displacement of Gulf supply
The actions being considered reveal important realities and trade-offs of energy security.
First is that implementing measures comes at a price. To understand it, we analyzed the cost of the extra offset potential announced since March 2026. New coal-to-liquids conversion plants run at $75–$185/bbl and potential new oil supply outside of the Gulf at $40–$60/bbl, against Gulf oil, where most supply runs below $30/bbl.77
Electrification’s economics vary widely by market and use case, and it can often deliver a positive business case over time relative to conventional high-emissions technologies. This is because up-front capital expenditures are offset by lower operating costs. Nonetheless, the up-front outlays can be large, posing a barrier particularly when financing is constrained. The up-front cost of the incremental electric passenger cars sold by 2030 alone is about $1 trillion more than the equivalent internal combustion fleet.78 From an emissions perspective, electrification would generally contribute to lower emissions—unlike coal, which would increase them.79
Pipelines can be comparatively cheaper. Large pipelines generally cost under $10/bbl, assuming full utilization.80 But they also come with a significant upfront capital outlay. As an example, the United Arab Emirates’ planned parallel pipeline to Fujairah has been reported at about $3 billion.81
Second, increasing energy security around the Gulf is not the same as displacing its crude. The distinction turns on whether the Strait is open or closed. If it’s the latter, these levers could substitute lost barrels and so may be worth having even if costly. But Gulf crude sits at the bottom of the global cost curve—from about $5/bbl in the United Arab Emirates to around $30/bbl in Iraq (Exhibit 7).82 If the Strait is open, none of the levers displace them. They largely buy insurance against disruption on the Strait.
Gulf oil supply sits low on the cost curve.
1Breakevens are Brent-based and reflect forward-looking cash costs (operating expenses, taxes and royalties, maintenance capex) for existing production and half-cycle costs (ie, cash and development costs, excluding land costs) for new production. In all cases, breakevens include projected free cash flow from associated gas and natural gas liquids production and sales. Breakevens incorporate a 15% discount rate for all future cash flows.
2Oil production from new wells started in 2025.
3Production is split into country-resource type segments, with segments of <1 MMb/d grouped together.
Pipelines reduce exposure to the Strait and are the biggest offset announced so far but still leave Gulf oil exposed to broader regional disruptions. Saudi Arabia's East–West line, for instance, runs to Yanbu on the Red Sea—a corridor now itself under pressure from renewed Red Sea escalation.83
Finally, implementation is not a given. This accelerated-potential scenario should be read not as a forecast but as an illustration that it is possible to create significant optionality around the Strait with the current tool kit being discussed. Many projects are in early stages and not confirmed. Given lead times, shovels would need to hit the ground soon to have a material impact this decade. Yet current uncertainties make it harder to commit to large capital projects. Moreover, other developments not considered in these estimates—such as new shocks disrupting oil capacity elsewhere or a renewed drive to build inventories that raises demand for it—could meaningfully change the picture.
Taken together, the structural responses already underway to the Strait of Hormuz crisis show that countries have considerable room to strengthen energy security. At the same time, doing so requires choices about which vulnerabilities to address, at what cost, and with what trade-offs. And the Strait is only one source of exposure. Countries face energy security risks in many forms. The next chapter explores these “fingerprints” of different regions, how countries could be exposed to disruptions in cross-border flows of energy, and what can be done about them.
Seeking security, beyond the Strait
Energy shocks have long been a challenge. The 1950s saw the Suez Crisis; the 1970s the twin oil shocks.84 And while the 2022 gas shock still looms large, as far back as the late 2000s, Russia had cut gas supplies to Europe.85
In 2025, one out of every seven barrels of global oil supply came from a producer under sanctions.86 Industrial policy actions such as strategic subsidies and export restrictions are rising.87 Even long-standing institutions that have shaped energy markets are evolving, with the United Arab Emirates leaving OPEC in 2026.88
All economies have vulnerabilities but, importantly, not in the same way. Each has its own energy security “fingerprint”—that influences how it could be affected by disruptions to cross-border flows of energy—depending on the nature of its fuel mix, its exposure to energy trade, how secure that trade is, and the capacity of its energy system to respond. Our analysis identifies dimensions that together define an economy’s energy security fingerprint—and six archetypes that illustrate the different combinations of these dimensions.
The foundations of energy (in)security
Countries depend on many sources of energy and generally have been diversifying their energy systems, reducing dependency on any single fuel. But fossil fuels still account for 80 percent of primary energy supply globally. And crucially, the endowments of these resources are unevenly distributed. Around 95 percent of the world’s population lives somewhere that is a net importer of at least one major fuel type.89 Oil is particularly tricky. All economies use oil, and about 20 of the 30 largest rely on oil for more than one-third of their energy.90 At the same time, just eight countries hold about three quarters of proven oil reserves.91
Trade is therefore indispensable to energy access, allowing economies without resources to access them. Moreover, deep, integrated markets can enhance security; they create flexibility in redirecting supply when disruptions occur.
Yet trade dependencies can still shape how economies experience shocks. Even globally traded markets like oil cannot always adjust seamlessly to disruptions. Conflict or policy responses can constrain trade precisely when markets are trying to reallocate supply. Following the 2026 disruption, for example, China restricted refined-fuel exports to protect domestic supply. Infrastructure and fuel specifications may create further constraints. Japanese and South Korean refiners managed to replace Gulf oil with US supplies in 2026 but suffered efficiency losses as a result. Trade positions also shape vulnerability to price shocks. Consumers in importing and exporting countries alike may face higher prices, but net exporters can offset some of the economic hit through higher producer income and government revenues. For net importers, higher prices create a direct national-income loss, leaving governments a fiscal challenge in cushioning households and firms.92
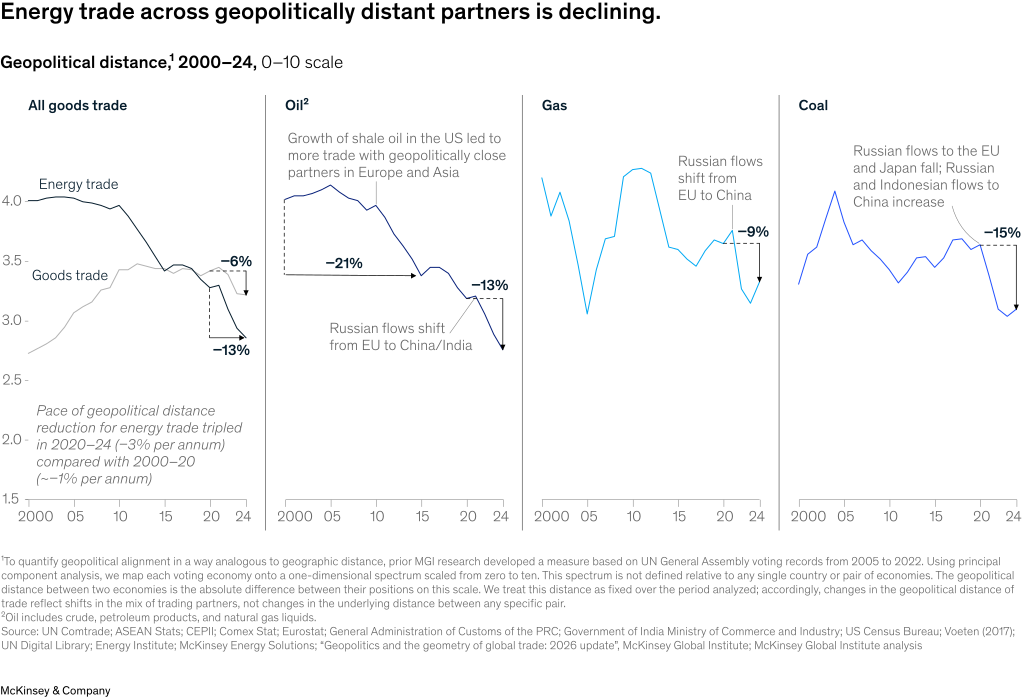
This doesn’t mean less trade is the answer. But it is important to understand how much an economy buys and how it buys it. Countries with a limited number of suppliers may be more vulnerable to disruptions. And concentration bites particularly hard when countries trade with partners who are at least moderately distant geopolitically, which happens for one-third of all energy trade.93 The European Union’s reliance on Russian gas prior to 2022, at 45 percent of its total gas imports, became exactly this kind of problem.94
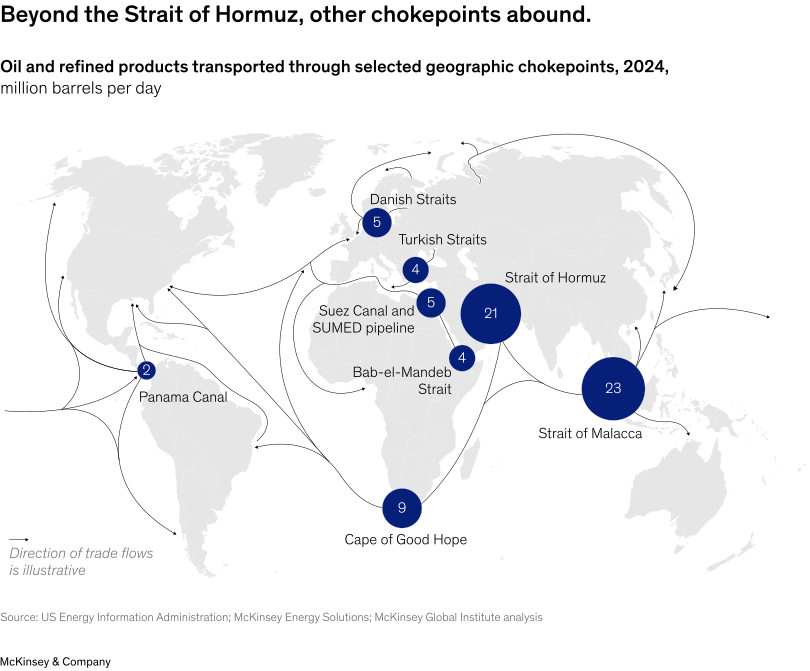
Routes matter too. Our analysis estimates that two-thirds of energy trade passes a maritime chokepoint (Exhibit 8).95 Disruptions beyond the Strait of Hormuz could further affect trade. For instance, the September 2026 escalation in Yemen has heightened risks to shipping through the Red Sea and Bab el-Mandeb.96 Further conflicts in the region could disrupt the effectiveness of pipelines bypassing the Strait of Hormuz.
Infrastructure further deepens dependence. Because refineries, pipelines, and terminals are built for specific oil grades and routes, they often lead to concentrated energy relationships. Many US refineries are optimized for heavier crude, such as Canadian and Venezuelan, rather than the light oil produced at home. Three countries hold liquefaction capacity accounting for 60 percent of the world’s LNG exports.97 Financial infrastructure, too, creates chokepoints, which, for example, enable sanctions. Around 90 percent of the world’s ocean-going tonnage is insured through the 12 members of the International Group of P&I Clubs, all of them headquartered in Europe, Japan, or the United States. Eighty percent of the global oil trade is settled in dollars.98
These features matter particularly in a moment where the geopolitics of energy are changing. Shale turned the United States from the largest oil importer into the world’s biggest producer of oil and gas. The United States and geopolitically close partners account for one-third of global oil production. China, the largest importer, has managed its relative oil dependence over time through other energy sources. In the past 12 months, the three oil producers that were historically most geopolitically close to China (Russia, Iran, and Venezuela) have faced sanctions, conflict, or other disruptions to their oil exports (Exhibit 9).

Each region has a unique energy security fingerprint, and even exporters are exposed
No single metric captures the full picture of an economy’s vulnerability to energy security risks (see sidebar “Building energy security fingerprints”).
Vulnerability in our analysis reflects both economies’ exposures and their capacity to respond to energy supply disruptions, particularly those transmitted through cross-border flows. We analyzed five dimensions that influence a national energy security “fingerprint.” The first three characterize potential exposure; the final two capture the capacity to respond. This analysis illustrates patterns of these fingerprints across economies, rather than ranking them on a single scale. That’s because the relevant issue is not which economy is most secure in the abstract, but how exposures and capacities to respond combine to create vulnerabilities. This helps inform potential responses.
Applied to the 2026 shock, the framework helps explain why similar headline trade positions produced different outcomes. And why some net importers were cushioned by inventories or because they could fall back on domestic fuels, while some net exporters remained vulnerable because they lacked specific fuels, refining capacity, or secure trade routes.
The five dimensions examined were:
- The composition of an economy’s energy supply—A broader energy mix can reduce reliance on any single fuel. France’s energy system is diversified thanks to its nuclear push in the 1970s, while Morocco’s supply is 61 percent oil.99 Electrification may add flexibility because electricity can be generated from multiple primary sources, allowing some uses to continue even if one fuel is disrupted. The nature of exposure also differs by fuel: Crude oil trades in a deep global market, while pipeline gas and electricity are usually traded only regionally.
- An economy’s energy trade position—Countries range from those with near total reliance on external energy supply (Sri Lanka at 84 percent of total energy supply) to those like Saudi Arabia that export a lot more than they consume. Even net energy exporters may rely heavily on imports in some areas. Australia, among the world’s largest energy exporters, lacks refining capacity and is the world’s largest importer of diesel.100
- The security of energy trade—Not all flows are alike. Imports that come from a few partners and travel through maritime chokepoints may leave countries more exposed, as do flows that originate in geopolitically distant partners. Japan draws 62 percent of its imports from moderately geopolitically distant suppliers versus China’s 21 percent. Both source over 75 percent of imports through chokepoints, the Strait of Hormuz not least among them. Mexico relies on a single partner, the United States, for about two thirds of its energy imports, while India’s top three partners together account for only 40 percent.
- Short-term response potential—The depth of buffers matters. Japan and Germany hold inventories equivalent to more than four months of oil consumption. Sri Lanka and Kenya, by contrast, held little inventory at the start of 2026.
- Long-term response potential—Countries with more domestic energy fallback have more options. India and China hold coal reserves under the ground equal to more than 100 years of energy use, while Japan has almost none.101 Renewable endowments likewise differ a lot. Countries like Spain and Argentina, for example, have abundant sunshine and wind resources. But demand matters as much as supply. Replacing fossil fuels may be harder in heavy-industry-intensive economies like Japan given the lack of available low-emissions alternatives in these areas.
These issues are not academic. They reveal the underlying exposures to geopolitics and other potential shocks that countries must consider how to manage.
Based on these dimensions, countries fall into six very distinct energy security archetypes. India and Japan, or Australia and Norway, may at first glance be similarly vulnerable to energy security risks due to similar net energy import positions. But our analysis shows that their energy security positions are very different, with India being more equipped than Japan to replace gas with domestic coal but less able to draw on inventories. Norway produces most of the fuels it needs, unlike Australia, which is an exporter of some fuels but is short in others (Exhibit 10).
We examined 65 countries representing 95 percent of global GDP and primary energy consumption and 80 percent of global population. To group each into an archetype, we considered 12 variables across the five dimensions of energy security.102
Economies differ in their energy security fingerprints, and even exporters may be vulnerable.
Potential contribution to energy security:²LowerHigher
Exposed importers
14 economies¹
Pakistan, Sri Lanka
Net importers with limited stockpiles of oil and gas. Often lower-income economies.
Security dimensions
- 1Composition of energy supply
- 2Energy trade position
- 3Security of energy trade
- 4Short-term response potential
- 5Long-term response potential
1COMPOSITION OF ENERGY SUPPLY
- 61Energy diversification index,³ inverted 1–100 HHI scale
- 21Electricity share of total final consumption, %
2ENERGY TRADE POSITION
- 43Net imports of fossil fuels, % of total energy supply
- 79Max net import dependency of any fuel, % of total energy supply for the fuel
3SECURITY OF ENERGY TRADE
- 27Trade with geopolitically distant suppliers,⁴ % of trade
- 53Trade with top three suppliers, % of trade
- 60Trade through maritime chokepoints, % of trade
4SHORT-TERM RESPONSE POTENTIAL
- 7Oil inventory,⁵ days of consumption
- 3Gas inventory capacity,⁵ days of consumption
5LONG-TERM RESPONSE POTENTIAL
- 30Share of oil and gas that is hard to replace with low-emissions technologies,⁶ %
- 25Fossil endowments, reserves/annual total energy supply
- 345Renewable endowments, solar and wind, MWh/year/person
Energy mix by source,⁷ %
- Coal20%Import-reliant
- Oil37%Import-reliant
- Gas35%Mixed sourcing
- Other8%Highly domestic
Cushioned importers
21 economies¹
Germany, Japan
Net importers, reliant on geopolitically distant partners, but with large stockpiles.
Security dimensions
- 1Composition of energy supply
- 2Energy trade position
- 3Security of energy trade
- 4Short-term response potential
- 5Long-term response potential
1COMPOSITION OF ENERGY SUPPLY
- 68Energy diversification index,³ inverted 1–100 HHI scale
- 24Electricity share of total final consumption, %
2ENERGY TRADE POSITION
- 70Net imports of fossil fuels, % of total energy supply
- 97Max net import dependency of any fuel, % of total energy supply for the fuel
3SECURITY OF ENERGY TRADE
- 48Trade with geopolitically distant suppliers,⁴ % of trade
- 45Trade with top three suppliers, % of trade
- 62Trade through maritime chokepoints, % of trade
4SHORT-TERM RESPONSE POTENTIAL
- 104Oil inventory,⁵ days of consumption
- 59Gas inventory capacity,⁵ days of consumption
5LONG-TERM RESPONSE POTENTIAL
- 31Share of oil and gas that is hard to replace with low-emissions technologies,⁶ %
- 21Fossil endowments, reserves/annual total energy supply
- 293Renewable endowments, solar and wind, MWh/year/person
Energy mix by source,⁷ %
- Coal15%Import-reliant
- Oil43%Import-reliant
- Gas22%Import-reliant
- Other20%Highly domestic
Hedgers with a coal backbone
4 economies¹
China, India
Net importers with large domestic coal endowments. Can switch fuels to act as a domestic buffer.
Security dimensions
- 1Composition of energy supply
- 2Energy trade position
- 3Security of energy trade
- 4Short-term response potential
- 5Long-term response potential
1COMPOSITION OF ENERGY SUPPLY
- 59Energy diversification index,³ inverted 1–100 HHI scale
- 27Electricity share of total final consumption, %
2ENERGY TRADE POSITION
- 30Net imports of fossil fuels, % of total energy supply
- 76Max net import dependency of any fuel, % of total energy supply for the fuel
3SECURITY OF ENERGY TRADE
- 21Trade with geopolitically distant suppliers,⁴ % of trade
- 37Trade with top three suppliers, % of trade
- 84Trade through maritime chokepoints, % of trade
4SHORT-TERM RESPONSE POTENTIAL
- 99Oil inventory,⁵ days of consumption
- 22Gas inventory capacity,⁵ days of consumption
5LONG-TERM RESPONSE POTENTIAL
- 38Share of oil and gas that is hard to replace with low-emissions technologies,⁶ %
- 122Fossil endowments, reserves/annual total energy supply
- 236Renewable endowments, solar and wind, MWh/year/person
Energy mix by source,⁷ %
- Coal58%Mostly domestic
- Oil23%Import-reliant
- Gas9%Mixed sourcing
- Other10%Highly domestic
Mismatched producers
9 economies¹
Australia, Indonesia
Exporters of some fuels, but importers of others. Limited inventories.
Security dimensions
- 1Composition of energy supply
- 2Energy trade position
- 3Security of energy trade
- 4Short-term response potential
- 5Long-term response potential
1COMPOSITION OF ENERGY SUPPLY
- 64Energy diversification index,³ inverted 1–100 HHI scale
- 20Electricity share of total final consumption, %
2ENERGY TRADE POSITION
- −70Net imports of fossil fuels, % of total energy supply
- 72Max net import dependency of any fuel, % of total energy supply for the fuel
3SECURITY OF ENERGY TRADE
- 33Trade with geopolitically distant suppliers,⁴ % of trade
- 59Trade with top three suppliers, % of trade
- 53Trade through maritime chokepoints, % of trade
4SHORT-TERM RESPONSE POTENTIAL
- 14Oil inventory,⁵ days of consumption
- 8Gas inventory capacity,⁵ days of consumption
5LONG-TERM RESPONSE POTENTIAL
- 27Share of oil and gas that is hard to replace with low-emissions technologies,⁶ %
- 134Fossil endowments, reserves/annual total energy supply
- 1,911Renewable endowments, solar and wind, MWh/year/person
Energy mix by source,⁷ %
- Coal16%Highly domestic
- Oil42%Import-reliant
- Gas26%Highly domestic
- Other16%Highly domestic
Chokepoint-vulnerable exporters
8 economies¹
Saudi Arabia, UAE
Net exporters, secure in supply, but export trade routes run through chokepoints.
Security dimensions
- 1Composition of energy supply
- 2Energy trade position
- 3Security of energy trade
- 4Short-term response potential
- 5Long-term response potential
1COMPOSITION OF ENERGY SUPPLY
- 54Energy diversification index,³ inverted 1–100 HHI scale
- 15Electricity share of total final consumption, %
2ENERGY TRADE POSITION
- −104Net imports of fossil fuels, % of total energy supply
- 17Max net import dependency of any fuel, % of total energy supply for the fuel
3SECURITY OF ENERGY TRADE
- 41Trade with geopolitically distant suppliers,⁴ % of trade
- 80Trade with top three suppliers, % of trade
- 73Trade through maritime chokepoints, % of trade
4SHORT-TERM RESPONSE POTENTIAL
- 15Oil inventory,⁵ days of consumption
- 30Gas inventory capacity,⁵ days of consumption
5LONG-TERM RESPONSE POTENTIAL
- 32Share of oil and gas that is hard to replace with low-emissions technologies,⁶ %
- 91Fossil endowments, reserves/annual total energy supply
- 2,019Renewable endowments, solar and wind, MWh/year/person
Energy mix by source,⁷ %
- Coal6%Mostly domestic
- Oil36%Highly domestic
- Gas52%Highly domestic
- Other6%Highly domestic
Broad-based exporters
9 economies¹
Canada, US
Net exporters across the fuel slate with inventories to fall back on, though still reliant on trade.
Security dimensions
- 1Composition of energy supply
- 2Energy trade position
- 3Security of energy trade
- 4Short-term response potential
- 5Long-term response potential
1COMPOSITION OF ENERGY SUPPLY
- 68Energy diversification index,³ inverted 1–100 HHI scale
- 21Electricity share of total final consumption, %
2ENERGY TRADE POSITION
- −36Net imports of fossil fuels, % of total energy supply
- 14Max net import dependency of any fuel, % of total energy supply for the fuel
3SECURITY OF ENERGY TRADE
- 30Trade with geopolitically distant suppliers,⁴ % of trade
- 52Trade with top three suppliers, % of trade
- 42Trade through maritime chokepoints, % of trade
4SHORT-TERM RESPONSE POTENTIAL
- 84Oil inventory,⁵ days of consumption
- 58Gas inventory capacity,⁵ days of consumption
5LONG-TERM RESPONSE POTENTIAL
- 25Share of oil and gas that is hard to replace with low-emissions technologies,⁶ %
- 56Fossil endowments, reserves/annual total energy supply
- 1,647Renewable endowments, solar and wind, MWh/year/person
Energy mix by source,⁷ %
- Coal9%Highly domestic
- Oil38%Highly domestic
- Gas37%Highly domestic
- Other16%Highly domestic
1Sample set determined by data availability, covering 65 countries making up ~95% of global GDP and energy use. Includes at least 70% coverage across all regions.
2Color scale of each individual variable is based on percentile rankings across the 65-country sample: 0–40th percentile = low; 40th–60th = medium; and 60th–100th = high. Dimension ratings average the underlying variables and conservatively round down; for example, one medium and one low variable result in a low rating.
3Energy diversity calculated on an inverse Herfindahl–Hirschman Index, with 100 representing highest energy diversity.
4Based on a moderate geopolitical distance, corresponding to a distance of over 4 on McKinsey Global Institute’s 0–10 scale.
5Covers strategic and commercial primary stocks (producers, refiners, importers) from an industry database estimated to capture ~92% of inventories; secondary and tertiary stocks (such as small bulk plants or end-consumers) are excluded. Gas figures exclude floating storage. Given skewed distribution of gas inventory capacity variable, variable color scale follows the color scale applied to oil inventories.
6Share of oil and gas consumption that is hard to replace with low-emissions technologies.
7Mismatched producers have very different energy mixes. Chart represents coal and gas long economies that are short on oil, eg, Indonesia and Australia. Color coding based on percentage of imports: import-reliant +50%, mixed sourcing (25–50%), mostly domestic (10–25%), highly domestic (<10%).
Source: International Energy Agency; Statistical Review of World Energy, Energy Institute; United Nations Statistics Division; UN Comtrade; McKinsey Global Trade explorer; World Bank; International Gas Union; Laboratory of the Rockies; Rystad; S&P Capital IQ; US Department of Energy; US Energy Information Administration; Eurostat; ICCT; McKinsey Global Institute analysis
- Exposed importers (including Pakistan and Sri Lanka). Net import dependence for some countries reaches over 95 percent on their most exposed fuel, with almost no inventories and high chokepoint exposure. They may also have less financial capacity to build defenses, given that they are often lower-income countries.
- Cushioned importers (including Japan, Germany, and other EU countries). These economies’ energy mix is more diversified. They are, however, also highly import dependent (70 percent of supply on average) and relatively more reliant on moderately geopolitically distant partners (48 percent of energy trade on average). This group can temporarily absorb shocks through large stockpiles of oil, but domestic fallback options on fossil endowments may be smaller either because of unfavorable geology or policy decisions not to explore them.
- Hedgers with a coal backbone (including China, India, and South Africa). They are reliant on oil and gas imports but hedge their vulnerability through several mechanisms. They rely on large domestic coal backbones. They possess high inventories, like China, or are expanding them, such as India and South Africa. They generally diversify trade with a wide range of geopolitically close partners. Their sharpest exposure is generally to chokepoints (84 percent of trade on average).
- Mismatched producers (including Australia, Brazil, Ecuador, and Indonesia). They are net energy exporters overall but short on specific fuels, in two variants. Australia and Indonesia are long on coal and gas yet do not produce or refine enough oil to meet their needs. Brazil and Ecuador produce ample crude oil but rely on imports of refined products.
- Chokepoint-vulnerable exporters (including Saudi Arabia and the United Arab Emirates). They produce far more than they consume but are exposed to trade routes. On average, 73 percent of their energy trade passes a maritime chokepoint.
- Broad-based exporters (including Canada and the United States). They are net exporters across the fuel slate with inventories to fall back on and the lowest chokepoint exposure of any archetype (42 percent of trade on average). Their large domestic supply carries caveats. The United States is the world’s largest oil and gas producer yet is also, perhaps counterintuitively, the second-largest energy importer in absolute terms, in part because many US refineries are optimized for heavier crude than domestic production provides.103
Regions are starting to recognize and respond to their broad range of energy security concerns. The response does not mean eliminating dependencies but rather finding ways to effectively manage them. The next chapter explores how far actions that started in 2026 could be stretched and where they hit limits and challenges.
No easy exits, but room to maneuver
The current crisis puts fundamental questions on the agenda: How much further could countries go to reduce their oil and gas imports? Will the energy transition accelerate? Will coal stage a comeback? Could new oil and gas production create more options?
In chapter 2, we assessed progress on structural resilience levers and examined their impact in the context of a potential future Strait of Hormuz closure. This chapter examines how much more these levers could be pulled to build energy security—both in the context of the Strait and beyond—and where they hit economic and physical limitations.
Our analysis finds that there is room to maneuver across all levers, even as each has clear ceilings. Low-emissions technologies could substantially displace imported oil and gas but are not viable everywhere, take significant time to scale, and create their own dependencies. Coal can provide a backstop in some countries but is only a partial backup and comes with steep emissions. Diversification through new oil and gas supply is possible, but geology and economics limit how far it can go. Rewiring trade creates optionality but requires infrastructure that can itself be vulnerable to disruption. Inventories buy limited time but only for what can be stored. Demand management can reduce exposure, but transforming fleets, buildings, and factories takes time. Levers work in different contexts, across different time horizons, and with different trade-offs—including for global emissions.
The implication is that energy security will not come from finding an easy exit from today’s dependencies, but rather from combining levers effectively. The right combination will differ by country depending on its energy security fingerprint.
Electrification and clean energy: Capped by technology but with room to grow
How much could low-emissions technologies, including electrification alongside domestically produced clean energy, reduce dependence on oil and gas imports? Overall, we find there is headroom to grow beyond current trajectories before hitting technical ceilings, but change will not happen everywhere and at once (see sidebar “Will energy security concerns accelerate the energy transition?”).
As a theoretical exercise, we estimate this technical ceiling by assessing the portion of oil and gas use that could be replaced with currently viable low-emissions technologies. For this, we drew on MGI’s prior assessment of the physical challenges associated with each switch.104
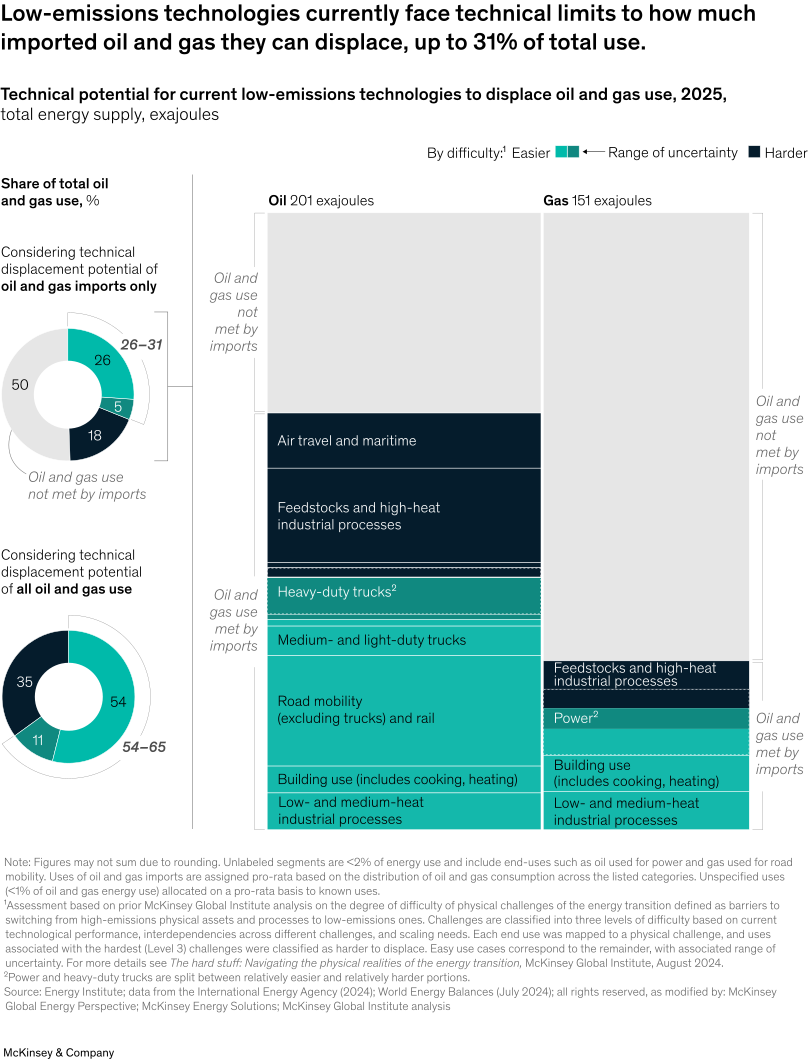
On that basis, a push to use low-emissions technologies in lieu of imported oil and gas could, in theory, displace the equivalent of 26 to 31 percent of today’s global oil and gas consumption (Exhibit 11). Of course, low-emissions technologies could also, for a wider set of considerations that extend beyond just energy security, displace oil and gas consumption met by domestic production. For reference, applying the same technical assessment to total oil and gas use (rather than just imports) would result in a potential of between 54 and 65 percent.
Most of the potential is driven by passenger vehicles, cooking, low- to medium-temperature heat in homes and industries, and power generation in grids where variability of the renewable generation profile does not yet create large integration challenges. These are areas where low-emissions technologies already perform well relative to high-emissions ones and are scaling commercially. When it comes to shipping and aviation fuels, high-temperature industrial heat, and feedstocks, however, low-emissions alternatives exist, but they are relatively nascent, have not begun to scale commercially, and are often much more expensive.
Increasing electrification and clean energy could be especially useful to countries with limited fossil endowments. For example, many “cushioned importers” could complement short-term protection provided by inventories with a structural reduction in exposure to oil and gas imports.
The technical potential for this lever far exceeds current momentum. For example, with oil, even just considering the full technical potential to reduce dependence on imports, this lever could displace as much as 42 MMb/d, more than ten times the amount currently on track to be displaced by 2030.105 And that ceiling could rise as technologies mature.
Achieving that potential is far from certain and is shaped by policy, economics, and consumer preferences. While the economics of viable low-emissions technologies can be favorable, that is not true of all use cases and regions. And even when cheaper on a lifetime basis, they often come with a higher upfront cost.106 Speed is a significant further constraint. While it can be shaped by policy or concerns about exposure to price shocks, speed is often influenced by the natural turnover rate of existing assets. A typical internal-combustion car engine or home gas boiler runs 15 to 20 years before it is retired. A gas power plant can last about double that.107
Low-emissions technologies also create their own dependencies, for example, on solar, electric vehicles, and critical-mineral supply chains, most notably with China.108 The nature of dependency is different, however. While an oil or gas cutoff curtails supply immediately, a cutoff of low-emissions assets or their inputs would constrain new deployment and replacements rather than prevent existing assets from operating. As a result, shocks on supply chains of low-emissions technologies may also have a smaller impact on near-term economic output.109
Coal: An emissions-heavy backup for some
More countries possess coal reserves than oil or gas, and many already have coal power capacity in their grids. These domestic assets can reduce dependence on oil and gas imports. But coal’s current role is most often as a backup in power to shield against import disruptions. Expanding its role beyond that comes with significant cost trade-offs. All applications also come with challenges of air quality and emissions.
Start with power. In the wake of the 2026 shock, debates emerged in many economies over whether coal power could provide a backstop for the gas imports used in gas power plants to help manage the impact of disruptions.110 Existing coal power fleets already run well below historical utilization in most of the world, leaving headroom to absorb gas-fired demand.111 China, the European Union, and India currently have enough spare coal power capacity to theoretically buffer all the gas they currently use for power without a single new plant.112
But power accounts for less than 15 percent of current oil and gas imports. For coal to replace oil and gas in other uses, it generally requires conversion into liquids, gas, or chemicals. These technologies have been proven for decades, and “hedgers with a coal backbone” such as China and India are announcing more capacity. The main limit is cost. New coal-to-liquids builds are generally at least two times more expensive than most oil production. Even the cheapest operations barely match the most expensive oil fields. As a result, conversion capacity is likely to be sparingly built and used. China is by far the largest and most economical market, but even its coal-to-liquids output is equal to less than 2 percent of oil consumption.113
Across all use cases, emissions and air quality cap how far many countries are likely to take coal. Burning it releases twice as much carbon dioxide per unit of electricity as gas (and a similar impact when converted to replace oil for fuels), and global assessments attribute roughly half a million premature deaths per year to coal combustion.114
Oil and gas: New supply could diversify the map, but not redraw it
There are, of course, many routes to energy security. China, for example, is managing its energy exposure by pulling the levers described previously. It has expanded electrification, coal, and clean power, becoming both the largest clean-power generator and coal user in the world by a wide margin. The United States, on the other hand, underwent a transformation from the largest energy importer to the world’s largest oil and gas producer and a “broad-based exporter” on the back of the mid-2000s domestic shale boom (Exhibit 12).

Could more countries replicate the US path and help diversify energy production globally? Additional production could broaden the market’s options during a disruption. Yet, geology, costs, and long investment horizons under current uncertainty place limits on how far it could fundamentally redistribute global production.
Few energy importers have the geology to drive new production. Even in the United Kingdom, where new developments remain possible, trade-offs between greater domestic production and the country’s energy transition are actively being debated.115
There is more potential among existing exporters. Producers, including the United States and Venezuela, are all already planning to scale supply. But economics constrains a fundamental redrawing of the energy map. Costs would generally sit substantially above existing production.116 Take Venezuela. While it has the technical potential to add several million barrels more per day beyond 2030, it sits high on the cost curve with new exploration near $80/bbl.117 Because projects take many years to break even, uncertainty over long-term prices can also hold investments back. Technology can shift boundaries by unlocking new reserves, as the shale boom demonstrated, and lowering costs.118 But it, too, has limits: Geology and the type of oil produced shape the costs of some producers like Venezuela.
The same logic extends to refining. Global overcapacity and scale advantages of large hubs in China, the Middle East, and the United States make many new projects difficult to justify.119 Nonetheless, energy security considerations could still prompt some to build new capacity. Mismatched producers like Australia—short on refined products—are studying new domestic refining capacity to improve security.120
Finally, new options for gas supply are emerging. LNG capacity is set to rise nearly 50 percent by 2030.121 New projects and liquefaction capacity are being developed in Argentina and Mozambique. Yet most incremental capacity is still concentrated in North America and Qatar—the largest exporters today—limiting global diversification benefits.
Rewiring: More flexibility through infrastructure
Countries may also create optionality by widening their range of possible trade routes and partners. Doing this at scale is not free and requires additional infrastructure. It can also itself be vulnerable to disruptions, as the ongoing crisis has demonstrated.
The energy system has been rewiring for decades. The geopolitical distance of energy trade, reflecting how much energy flows between geopolitically distant partners, has been falling twice as fast as that of trade overall and accelerated after 2019.122 The US shale boom from 2008 displaced Middle East barrels at home and supplied geopolitically close economies such as Europe and South Korea; Russian energy swung to China and India after 2022 (Exhibit 13).
Rewiring was also evident in the recent crisis. Pipelines rewired Gulf oil around the Strait. Korean refiners took more US crude; Indian ones bought more from Russia.
But deeper rewiring often requires new physical infrastructure, presenting opportunities and challenges.
Bypass pipelines may create new or backup routes that avoid maritime chokepoints—as this shock has already demonstrated. They can often be built within a few years.123 The planned expansion of Gulf oil bypass capacity is the clearest case, but not the only one. China and Russia are in discussions to build Power of Siberia 2 for gas.124 But pipelines can be a double-edged sword since they move fuel between two fixed points and can’t be repointed. And when created as backup routes, like some of the pipelines around the Strait of Hormuz, they may remain underused—the price of insurance against a future shock.
LNG infrastructure creates greater flexibility because gas can be shipped from multiple suppliers. Indeed, LNG has overtaken pipelines as the main form of gas trade, quadrupling from 140 billion cubic meters (bcm) in 2000 to 550 bcm in 2024.125 At the same time, importers face economic limits on how much they can rely on LNG, since it is structurally more expensive than domestic or piped gas. It can also take a long time to build, around half a decade to develop after final investment decisions, and seaborne trade remains exposed to maritime disruption.126
Retooling refineries buys flexibility by broadening the range of crude grades a country’s refineries can process, reducing dependence on particular suppliers. But this comes with high costs and efficiency implications, especially for deep reconfigurations.
Stockpiling: Countries saving it for a rainy day
Inventories do not eliminate exposure to shocks, but they allow countries to weather future disruptions. They can be built quickly and therefore contribute to resilience in the near term. But they only buy limited time during a shock. The ability to build these cushions also varies substantially by fuel and geography.
Announced commitments would lift global stockpiles by 7 percent for crude, 2 percent for gas, and 4 percent for oil products.127 While the shift may appear small at a global level, it is particularly notable among countries that entered the Strait of Hormuz crisis holding almost nothing (Exhibit 14).128
Many countries plan to increase oil and gas inventories.
Note: Figures are rounded to the nearest whole number.
1Represents a global compilation of inventories for countries representing ~95% of global GDP and total energy supply. Some countries with inventories larger than 225 days of total energy supply (Austria, Hungary, Latvia, Slovakia, and Ukraine) are omitted from the chart for visual clarity. For those countries, we found no announcements of increased inventory coverage. This list is not exhaustive.
2Covers strategic and commercial primary stocks (producers, refiners, importers) from an industry database estimated to capture ~92% of inventories; secondary and tertiary stocks (such as small bulk plants or end-consumers) are excluded. Gas figures exclude floating storage. Undisclosed levels are recorded as zero unless otherwise indicated.
3UAE-backed stockpile expansion in India; Kuwait- and Saudi-backed stockpile expansion in Pakistan.
4Crude/refined product split unavailable; volumes classified as crude may include refined products.
5Gas inventory levels as of December 2025.
6For gas, announcements in Bulgaria, the Netherlands, and Russia were excluded because they concerned mandates to replenish existing inventory to higher levels rather than physical capacity expansions.
Crude oil inventories, common in advanced economies especially, in “cushioned importers,” are now being built by emerging economies that had limited stocks. Indonesia announced plans to build crude oil inventories equal to about 90 days of consumption, from 25 days before the crisis.129 In the case of India and Pakistan, inventories are being built in partnership with Gulf exporters.
Building inventories of refined products is harder. Crude stockpiles are flexible because they are refinable into different products like diesel or jet fuel. A product reserve is specific; diesel cannot stand in for jet fuel. Products also degrade faster and cost more to keep. Nonetheless, the jump in product prices and pressure in the global refining system in 2026 have prompted countries to build new reserves. Countries without enough domestic refining capacity may have little choice. For “exposed importers” such as Morocco or “mismatched producers” like Australia, holding finished products may provide more useful protection than crude alone.
Gas is harder still. Storing it at scale often requires the right geology, which not every country has: aquifers, salt caverns, or depleted fields.130 Announced commitments mostly reflect expansions to existing storage capacity, as in Germany and Turkey.
Demand management: Efficiency and flexibility can be built, slowly
Oil and gas efficiency has been an important component of the global economy’s resilience so far. Demand management can continue to reduce energy exposure, but many measures would involve retrofitting or replacing millions of assets. This takes time and comes with up-front investment.131
Even so, there is room to move through industrial energy management, retrofits, logistics optimization, and more efficient vehicles, among others. Many measures are already “in the money” or close to it, meaning the energy costs saved outweigh implementation costs.132 Bringing firms up to best practices could cut industrial energy costs up to $600 billion a year, and AI is opening further energy efficiency opportunities.133
Demand management also unlocks flexibility. Modal shifts and remote working allow economic activity to adjust when supplies tighten. Electrification unlocks new forms of efficiency—heat pumps and EVs delivering the same output for a fraction of the fossil energy—as well as new forms of demand flexibility. Power demand can be shifted through smart charging, storage, and responsive industrial loads, easing stress when supply is short.134
These levers illustrate that no single route can fully work on its own. Every option has limitations and ceilings. But there is much room to maneuver. In the near term, inventories, flexible demand, and existing capacity to rewire trade can absorb disruptions, while existing coal capacity can provide a backstop in some power systems. Over several years, electrification, clean energy, and greater efficiency can reduce the amount of imported fuel an economy needs in the first place, while new pipelines, LNG terminals, and oil and gas production can broaden the set of suppliers and routes available for the dependencies that continue.
Energy security comes less from eliminating dependence than from creating layers of optionality and diversification: more sources, more routes, more buffers, and more alternatives for energy itself. We turn next to how stakeholders can approach decision-making around these issues.
Conclusion
Everyone relies on energy—people, companies, countries. The Strait of Hormuz shock is the latest to affect the energy system. Further disruptions, whether from chokepoints, sanctions, or infrastructure attacks, can’t be ruled out.135
Against this backdrop, decision makers need to consider not just how to protect their businesses and economies, but also how to sustain activity through disruptions.
The strategic realities of energy security
At the time of writing, considerable uncertainty remains about how long the current shock will persist, and when or where the next disruption may emerge. Yet amid this uncertainty, several strategic realities are becoming clearer.
- Energy security will remain high on the agenda. Amid the prospect of continued volatility, organizations that manage risks effectively can turn resilience into a strength rather than simply absorb the costs of disruption.
- It changes the economics of decision-making. Investments that may not be attractive on cost alone can become more compelling once the value of resilience is factored in. Measures from energy efficiency to supplier diversification can deliver value through lower costs, greater business continuity, and sustained revenue during disruptions.
- The response could be “more” and “more diverse.” Energy security may accelerate clean technologies in some use cases and regions. At the same time, it may drive additional investment in fossil-fuel supply and infrastructure—such as new production or refining capacity, new stockpiles, and new terminals—with implications for emissions and potentially further widening the gap to a Paris Agreement-aligned emissions pathway.
- Strategies will vary widely across regions and sectors. Countries and companies have distinct energy security fingerprints. A measure that builds resilience in one may offer little value in another. Understanding specific exposures and tailoring responses by geography, sector, and vulnerability will be critical to building effective strategies.
- New dependencies will emerge as old ones recede. Electrification and domestic production can reduce reliance on imported fuels and exposure to geographic chokepoints. But they could create other dependencies on supply chains of critical minerals and low-emissions technologies, albeit of a different nature. Similarly, rewiring trade reduces some dependencies but creates new ones. Energy security is less about eliminating dependencies than ensuring that they do not become critical vulnerabilities.
Navigating what lies ahead
Based on these realities, the task for policymakers and companies is to identify which dependencies can become strategic vulnerabilities, and where resilience is worth investment.
Understand and stress-test exposure
Our energy security archetypes provide a way to identify where markets and companies could be most vulnerable. An effective analysis goes beyond the size of energy imports to other risk factors, including the makeup of a region’s energy mix, the nature of import dependencies, geographic chokepoints, geopolitical challenges, and the capacity to buffer against shocks.
For companies, vulnerabilities could be greater and far more complex than for countries, given that operations can span multiple jurisdictions and sectors. What’s more, a factory in a fossil-fuel-exporting economy may still be exposed to shortages of a specific grade of fuel or feedstock that keeps a critical process running. Australia, for example, is among the world’s largest gas exporters. Yet in 2022, Incitec Pivot shut its fertilizer plant in Queensland after failing to secure affordable domestic gas.136
Recognizing vulnerabilities across potential shocks is not enough. Building capabilities to act on them is also necessary.137 Scenario planning, playbooks with triggers and owners, monitoring frameworks, cross-functional nerve centers, and crisis rehearsals are just some of the tools that organizations have at their disposal. Making the right decision is not enough; being quick matters, too.
Build a portfolio of options—and preserve flexibility
Economies and companies need to understand their unique energy security fingerprint to shape the right responses. The structural levers our research has identified can also be applied to companies: electrifying operations and fleets, adding new sources of clean energy and heat, substituting fuels and feedstocks, securing new or captive supply, rewiring where and how inputs are sourced, holding inventories, and increasing efficiency.
Energy security relies on a portfolio of responses, not just one. A highly import-dependent economy with limited domestic resources may lean heavily on inventories, rewiring, and electrification. A mismatched producer may prioritize specific new refining supply. And chokepoint-constrained exporters may try to rewire around those bottlenecks, as seems to be occurring.
The same also applies to companies. A chemicals producer constrained by gas feedstock, for example, may have little ability to electrify processes in the medium term and may instead prioritize feedstock flexibility and shifting production across regions. A large utility faces its own calculus. In Japan, JERA builds resilience through a diversified LNG portfolio, while treating renewables and low-emissions fuels as long-term structural options.138 A light manufacturing or data center operator, exposed mostly through its electricity bill, might lean more on demand flexibility and energy efficiency.
Whatever the portfolio, flexibility—or the capacity to make changes easily and with the least possible cost—can enhance resilience.139 Decision makers can build it across four dimensions.
- Input and supplier flexibility. The ability to substitute fuels and feedstocks allows operations to use what’s available rather than a single input. Reliance’s complex in Jamnagar, India, can process over 200 crude grades.140 Dual-fuel and hybrid systems can similarly switch between gas and electricity when one is disrupted.
- Manufacturing-footprint flexibility. Companies operating across regions can dynamically shift production toward locations where energy is available, cheap, and secure. Hit by the 2022 gas shock, Yara, a chemicals company, reduced ammonia output in its European plants while feeding its fertilizer plants with ammonia from other regions.141
- Logistics flexibility. Alternative infrastructure, such as new LNG terminals that can bring in gas from multiple suppliers, may allow flows to be rerouted when normal pathways are disrupted, as can prearranged access to alternate ports, carriers, storage, and suppliers.
- Market and contractual flexibility. Physical options work only if contracts allow them to be exercised. More flexible LNG contracts, such as destination-free contracts, can give buyers greater ability to redirect or resell cargoes and adjust deliveries during a shock. Such arrangements have become increasingly important, growing from 29 percent of LNG contracts in 2016 to 45 percent in 2024.142
Assess the business case for resilience holistically
Energy security is not just about playing defense. Companies can benefit from understanding how resilience supports growth.
For starters, it can improve investment economics. The avoided costs from energy efficiency often outweigh the up-front investment. And resilience can further improve the business case by reducing exposure to price spikes and shortages. Additionally, every unit of energy a company doesn’t use is one that pipelines and other security levers don’t have to cover.
Energy security may also allow companies to perform through disruptions. BASF had been disrupted by the 2022 energy shock. Yet in the second quarter of 2026, volumes rose 7 percent year over year even amid Middle East supply disruptions. This highlighted its sources of resilience, including a diversified production footprint, flexible crackers that can alternate which feedstocks they process, and trading operations that could quickly secure new supplies.143
Finally, companies can play a vital role in meeting the resilience needs of others. About 700,000 customers of Octopus Energy joined its “Saving Sessions” during the 2022 winter, shifting demand off peak hours. In the first session this delivered roughly half of the flexibility the UK grid called for.144 Given that different countries will take different approaches to energy security, companies may find that opportunities are differentiated by region—for grid equipment manufacturers it may be in markets prioritizing electrification; for energy traders it may be where flows need to be rewired and suppliers diversified.
It’s uncertain how the current situation will evolve, but its lessons will endure. This shock has shown that many energy security responses built over decades worked. Countries are also recognizing their limits—and what this means for resilience in the future. Bolstering security will take time and investment because it means reshaping the energy system. It will require newer technologies like electric vehicles but also tried-and-true responses such as pipelines, greater industrial efficiency, and storage tanks. Decision makers who better understand the current disruption and its likely aftershocks will be better positioned to navigate what comes next.
Related Articles

Geopolitics and the geometry of global trade: September 2026 update