





Welcome to McKinsey’s Agriculture Industry Review, our regular blog examining the latest developments across agriculture. In each edition, we share data-backed insights drawn from public and proprietary sources, expert perspectives, and the latest McKinsey research.
Four forces we are watching in August 2026
At the time of writing, several key forces are reshaping the agricultural landscape. While this list is not exhaustive, it highlights some of the notable trends we are currently observing:
- Fertilizer markets remain volatile and nutrient specific. Nitrogen prices have come down after a sharp spike in April 2026, while phosphate prices remain elevated because sulfur costs have stayed high. The impact on farmer margins varies depending on when farmers bought their supply and which crop they grow.
- Biofuel policy continues to strengthen soybean demand. The US Environmental Protection Agency (EPA) finalized the Set 2 Renewable Fuel Standard (RFS), raising biomass-based diesel requirements through 2027.1 The policy is expected to support stronger US soybean demand and more acres planted. In Brazil, continued ethanol and biodiesel blending mandates are expected to support long-term demand growth for both corn and soybeans.2
- Farmland values continue to outpace farm economics. US farmland values continue to grow faster than farmer margins, reflecting increasing demand for farmland as an investment asset, solar development, and expectations of continued capital appreciation. A growing share of US farmland is expected to change hands over the next five years, although most transfers are likely to remain off market.
- Recovery remains uneven across the value chain. Although the industry is emerging from its downturn, recovery varies considerably across sectors. First-quarter earnings show improvement for agrichemicals as sales volumes recover, and selected fertilizer producers are benefiting from tight supply of specific nutrients. However, agricultural equipment demand is still near its low point, and animal protein results vary widely by species. Grain traders are maintaining revenue but keeping less of it as profit.
These four forces are framing current industry developments across policy, input costs, land markets, and value-chain performance.
Fertilizer market volatility
- Fertilizer transport constraints. The Strait of Hormuz disruption impacted the supply and transport of nitrogen- and phosphate-based fertilizers, including direct exports (for example, approximately 30 percent of globally traded urea flows through the Strait),3 as well as critical liquified natural gas (LNG) and sulfur feedstocks. In April, urea prices peaked at over 50 percent greater than in February 2026, but prices have declined as demand has adjusted, trade flows have rerouted, and Middle East exports have resumed, leaving prices approximately 8 percent below February 2026 levels as of July 27, 2026. Di-ammonium phosphate (DAP) spot prices, however, remain elevated at about 25 percent above February 2026 levels, driven in part by elevated sulfur pricing.4
- Grower implications. Growers are impacted by both fertilizer costs (which account for approximately 20 percent of revenue for a US corn grower)5 and other input cost increases (including chemicals and diesel affected by higher petrochemical and transport costs). The impact is felt differently globally based on timing of fertilizer purchasing and crop planting decision-making. As of July 27, 2026, corn futures are up about 4 percent compared to February 2026, with crop price gains remaining modest relative to elevated phosphate and broader input costs.6 While nitrogen costs have normalized, these higher costs continue to pressure grower profitability and will continue to impact planting decisions in global markets.
Biofuel policy and demand drivers
- Biofuel policy continues to reshape demand. On March 27, 2026, the EPA finalized the RFS Set 2 policy, raising US renewable-fuel blending requirements for 2026 and 2027. The policy significantly raises the amount of advanced biofuel required, pushing total renewable-fuel requirements up by about 16 percent in 2026 compared with 2025.7
- Soybean demand gets the bigger lift. The biodiesel requirement is projected to increase about 70 percent by 2027 compared with 2025, potentially requiring approximately 6 million additional soybean acres. As a result, the share of US soybeans used to make biofuel is expected to rise from roughly 24 percent in 2024 to 35 percent by 2027.8 Corn ethanol demand is expected to increase more modestly because conventional renewable-fuel requirements remain broadly unchanged.
- Brazil’s biofuel growth is supported by structural demand drivers. In 2025, Brazil increased the ethanol blending requirement in gasoline to 30 percent and the biodiesel requirement in diesel to 15 percent, with plans to push biodiesel to around 20 percent by 2030.9 Almost 80 percent of vehicles in Brazil are flex-fuel, allowing consumers to switch readily between gasoline and ethanol.10
Farmland values and structural shifts
- Land values outpace farm profits. US agricultural land values have risen about 5 percent annually since 2010,11 more than double the roughly 2 percent annual growth in corn operating profits on a smoothed basis.12 The gap shows that land is worth more than just what it can grow, supported by investor demand, capital appreciation, and solar development.
- Consolidation in the United States continues, but the pace has slowed. Land has been steadily shifting from small and mid-sized farms to bigger operations, although recent data suggest this shift may be plateauing. The United States Department of Agriculture’s (USDA’s) 2024 Tenure, Ownership, and Transition of Agricultural Land (TOTAL) survey found that large farms (those with gross cash income greater than $500,000 a year) now operate about half of all US farmland.13 However, the total amount of land used for farming has decreased by roughly 54 million acres since 2005 as land is converted to non-agricultural uses, including development, energy, and conservation.14
- Generational transition is reshaping land ownership. Land ownership is entering a period of accelerated change, driven by an aging landowner population. Over the next five years, planned succession and transfer activity encompasses an estimated 31 percent of all US farmland, nearly double the 16 percent reported in 2014.15 More than 80 percent of this activity is expected to occur through wills, trusts, and gifts rather than through sales on the open market.16 As a result, opportunities to acquire farmland through traditional market transactions are likely to remain limited.
Value chain performance
Recovery across the agricultural value chain remains uneven. Data from the first quarter in 2026 highlight markedly different recovery trajectories across industries.
- Agrichemicals show the clearest signs of recovery. According to McKinsey analysis, sales volumes were up 5 percent year on year, while price/mix fell 2 percent, supporting EBITDA margin improvement. Generic competition and glyphosate cost pressure continue to affect pricing, but higher sales volumes, productivity improvements, and a shift toward higher-margin products are supporting earnings recovery.
- Recovery in fertilizer remains nutrient specific. Revenue rose about 8 percent from the fourth quarter of 2025, although margins declined from roughly 25 percent to 20 percent. Nitrogen and potash producers continue to benefit from tighter markets, while phosphate producers remain squeezed from elevated sulfur and other input costs. Performance comes down to which nutrients a company sells and how it is positioned.
- Agricultural equipment remains one of the slowest parts of the value chain to recover. Sales volumes declined about 5 percent from first quarter 2025 as demand for large equipment remained weak across North America and Brazil.17 Manufacturers continue to prioritize inventory discipline and margin protection over volume growth. Precision agriculture, aftermarket businesses, and connected technologies can help companies build resilience as they position for a gradual recovery.
- Animal protein performance continues to diverge by species. Revenue fell by about 5 percent and EBITDA by roughly 16 percent compared with the fourth quarter of 2025. Pork producers and companies with a mix of proteins generally performed better, while poultry producers benefited as consumers traded down from more expensive products. Cattle supply shortages and high costs of raising livestock continue to pressure beef producers, pushing many to invest more in branded, prepared, and specialty proteins instead.
- Grain trading revenues remain resilient but margins continue to compress. Revenue was nearly flat from the fourth quarter of 2025 (down less than 1 percent), supported by strong processing activity and improved biofuel policy visibility. But EBITDA and margins declined by about 13 percent and one percentage point, respectively, due to timing effects, crush volatility, and broader trading-market dynamics. Overall, recovery is still concentrated in a few pockets of the industry rather than spread evenly across it.
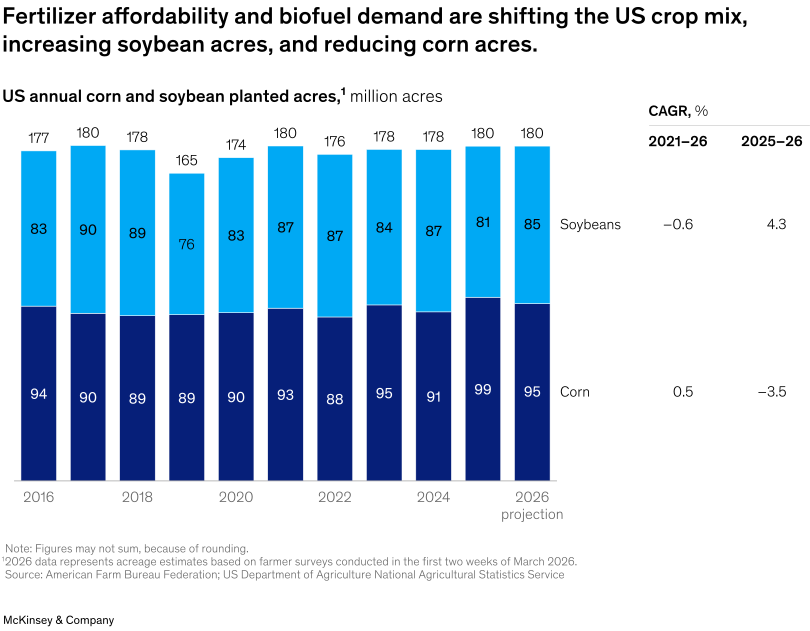
Planting plans are beginning to reflect these changing dynamics. A recent USDA survey suggests that US farmers could plant about 3.5 percent less corn in 2026 than in 2025, while soybean acreage may rise 4.3 percent from a six-year low.18 That shift reflects both the higher costs of fertilizer for corn and the stronger biofuel-driven demand for soybeans (Exhibit 1).
What we are watching through 2026 and beyond
So far, 2026 has highlighted how closely connected developments across agriculture have become, from input costs and planting decisions to biofuel policy, land markets, and value chain performance. Looking ahead, we will continue to follow:
- Fertilizer availability and delivery timing, particularly for nitrogen- and phosphate-based products
- whether high phosphate costs accelerate adoption of alternative products, including biologicals and higher-efficiency fertilizers
- how the shift from corn to soybeans ripples downstream, affecting yields, fertilizer demand, harvest volumes, grain flows, commodity prices, and livestock economics
- whether stronger biofuel and biogas demand continues to support soybean markets amid volatile energy prices
- how El Niño conditions, inflation, and continued low commodity prices affect farmer profitability and broader industry performance
- the progress of the US Farm Bill and whether new policies provide support for the US farm economy
The information in this blog reflects agricultural market conditions as of July 2026 and is intended as a point-in-time snapshot. Given the dynamic nature of these markets, some details may have changed since publication.
The authors wish to thank David Ghalili, Diana Fahning, Felipe Boaretto, Kaique Karut, and Megan Higgins for their contributions to this blog.
1 “Detailed fact sheet: EPA’s final “Set 2” rule under the Renewable Fuel Standard (RFS) program,” United States Environmental Protection Agency, March 2026.
2 Camila Viveiros and Jane O’Malley, “Mapping Brazil’s latest fuels policies,” The International Council on Clean Transportation, February 23, 2026; OECD-FAO agricultural outlook 2024-2033, Organisation for Economic Co-operation and Development, July 2, 2024.
3 Afshin Molavi, “Hormuz disruption set to hit fertilizers, metals, and plastics worldwide,” Forbes, March 26, 2026.
4 “Di-ammonium phosphate,” Trading Economics, July 2026; “Urea,” Trading Economics, July 2026.
5 “Commodity costs and returns,” US Department of Agriculture, Economic Research Service, 18 June 2026.
6 “Corn futures, Dec-2026 (ZC=F),” Yahoo Finance, July 2026.
7 “Detailed fact sheet: EPA’s final ‘Set 2’ rule under the Renewable Fuel Standard (RFS) program,” United States Environmental Protection Agency, March 2026.
8 Soybean 2026-27 values were calculated by converting biomass-based diesel volume requirements into estimated soybean bushels, as a share of total soybean production based on the USDA agricultural projects to 2035 report. Corn 2026-27 values were calculated using the USDA agricultural projects to 2035 report; USDA agricultural projects to 2035, United States Department of Agriculture, Office of the Chief Economics, and World Agricultural Outlook Board, February 2026.
9 “Brazil’s E30, B15 blends to start 1 Aug,” Argus, June 25, 2025; Camila Souza Ramos, “Brazil holds off on biodiesel blend increase despite supply fears,” Valor International, Agribusiness, March 13, 2026.
10 Vehicle fleet report 2026 [Relatório da Frota Circulante 2026], Sindipeças (National Association of Brazilian Auto Parts Manufacturers) and Abipeças (Brazilian Auto Parts Industry Association), 2026.
11 “Charts and maps: Land values: Average farm real estate value by year, US,” United States Department of Agriculture, National Agricultural Statistics Service, accessed April 2026.
12 “Commodity costs and returns,” US Department of Agriculture, Economic Research Service, June 18, 2026.
13 “2024 Tenure, ownership, and transition of agricultural land (TOTAL),” United States Department of Agriculture, National Agricultural Statistics Service, accessed April 2026.
14 Farms and land in farms 2025 summary, United States Department of Agriculture, National Agricultural Statistics Service, February 2026; Daniel Munch, “Ground shift: What’s reshaping America’s agricultural land base,” American Farm Bureau Federation, July 9, 2026.
15 “2024 Tenure, ownership, and transition of agricultural land (TOTAL),” United States Department of Agriculture, National Agricultural Statistics Service, accessed April 2026.
16 “2024 Tenure, ownership, and transition of agricultural land (TOTAL),” United States Department of Agriculture, National Agricultural Statistics Service, accessed April 2026.
17 “AGCO reports first-quarter results,” Agco; “CNH Industrial N.V. reports first quarter 2026 results,” CNH, April 30, 2026; “Deere reports first quarter net income of $656 million,” John Deere news release, February 19, 2026; McKinsey analysis.
18 Prospective plantings, United States Department of Agriculture, National Agricultural Statistics Service, Agricultural Statistics Board, March 31, 2026; Faith Parum, “Farm Bureau survey reveals real impact of fertilizer availability and price,” American Farm Bureau Federation, April 14, 2026.