On the face of it, 2025 was a year of significant progress for decarbonization. Global solar capacity grew by about 30 percent, and investment in low-carbon technology was on par with investment in oil and gas for the first time.1 Going by these metrics, commonly used to track the transition, decarbonization appears to be thriving whereas fossil fuels are declining. But the full picture is more complex.
In fact, all energy sectors continue to grow, adding supply across every energy carrier to meet ever-increasing global demand. The long-predicted “peak” for fossil fuels remains elusive. Recent data shows that, in 2025, oil demand added about 1.3 million barrels per day, an increase from the growth seen in 2023–24.2 Coal consumption also hit record levels.3 Overall, fossil fuels added about 4.5 exajoules of demand.4 Our analysis shows that, as yet, no single fuel type is replacing another (see sidebar “Four assumptions that may no longer hold across all geographies”).
Further, energy capacity is only one part of a system that encompasses energy storage, transmission, and other infrastructure. A focus on low-carbon generation and investment volume does not capture the broader system dynamics.
The overall energy portfolio must be able to meet the needs of a modern economy in a sustainable way. With elevated geopolitical risk, rising costs, and supply bottlenecks, the question is whether the system being built can meet both growing demand and climate goals reliably and affordably.5 Shifting the narrative to a system-wide investment perspective is important for a more accurate assessment of where we are today: how capital is deployed, what each invested dollar buys in terms of system value, and what the investment mix implies for affordability, reliability, resilience, and sustainability.
This article, part of our “Where are we?” series, examines this system-wide investment perspective and assesses where the global energy system stood at the end of 2025 (see sidebar “Our methodology”).
The energy system is expanding across all carriers
The modern energy system has been built over more than a century. Since 1950, global energy demand has grown more than sixfold, from 28,600 terawatt-hours (TWh) to 186,400 TWh of primary energy, driven by the needs of six billion more people in an economy that is now 15 times larger. The energy system has expanded and diversified in step with this growth (Exhibit 1).
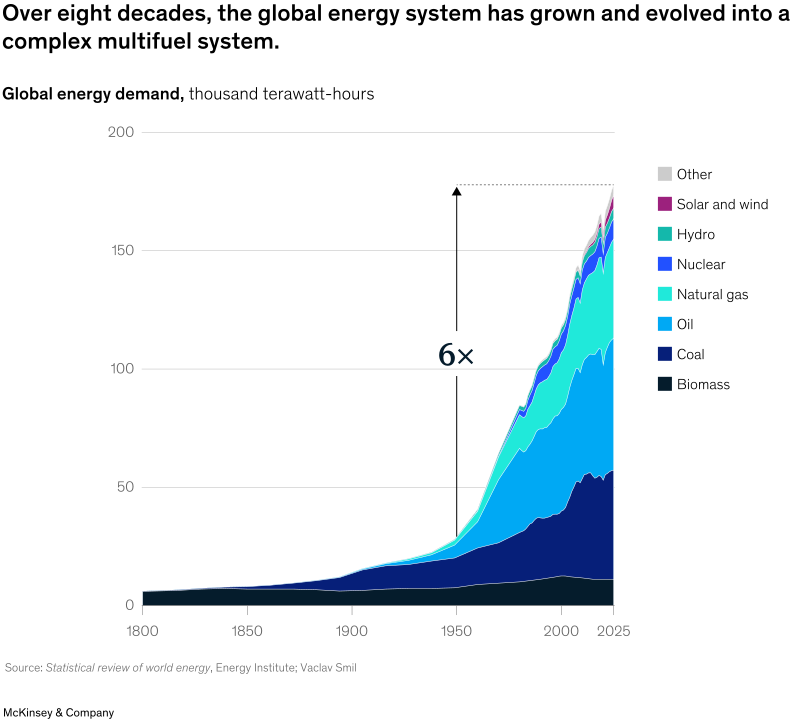
Modern energy demand growth can often be underestimated by assuming that efficiency gains and clean-energy deployment will outpace the forces increasing consumption. But in 2025, demand came from sources that earlier outlooks did not fully anticipate. Cooling demand rose across Asia, freight and petrochemicals continued to expand, data center growth was significant in many markets, and industrial capacity expanded as reshoring accelerated.6
Electrification growth deserves a special mention. While it increased energy demand in some regions, especially in developing regions, it decreased demand in others by shifting traditional fossil-based use cases, such as internal combustion engine vehicles, to electrified solutions. This shift simultaneously added traditional energy sources and new renewable energy carriers to the energy mix. Overall energy demand rose by 1.3 percent in 2025, in line with annual growth rates since 2013.7
Against this backdrop, and despite resilient renewables growth in some regions, expectations that oil demand is set to peak before 2030 warrant scrutiny. In fact, the entire system is growing, building all fuel and power industries in parallel (Exhibit 2).
Investment was plentiful, but where did it go and what did it buy?
About $3.3 trillion was invested in all aspects of the global energy system in 2025. Of this, $1.8 trillion was directed toward fossil fuels, power generation, and low-carbon technologies (Exhibit 3).8 Two energy carriers accounted for nearly half of this: About $540 billion went to the upstream oil sector (the largest fossil-fuel capital expenditure category), while about $440 billion went to solar (the largest clean-energy category). In other words, markets are financing both fossil fuels and low-carbon energy simultaneously, and at a broadly comparable scale. The system is not replacing one fuel type with another but rather building them in parallel.
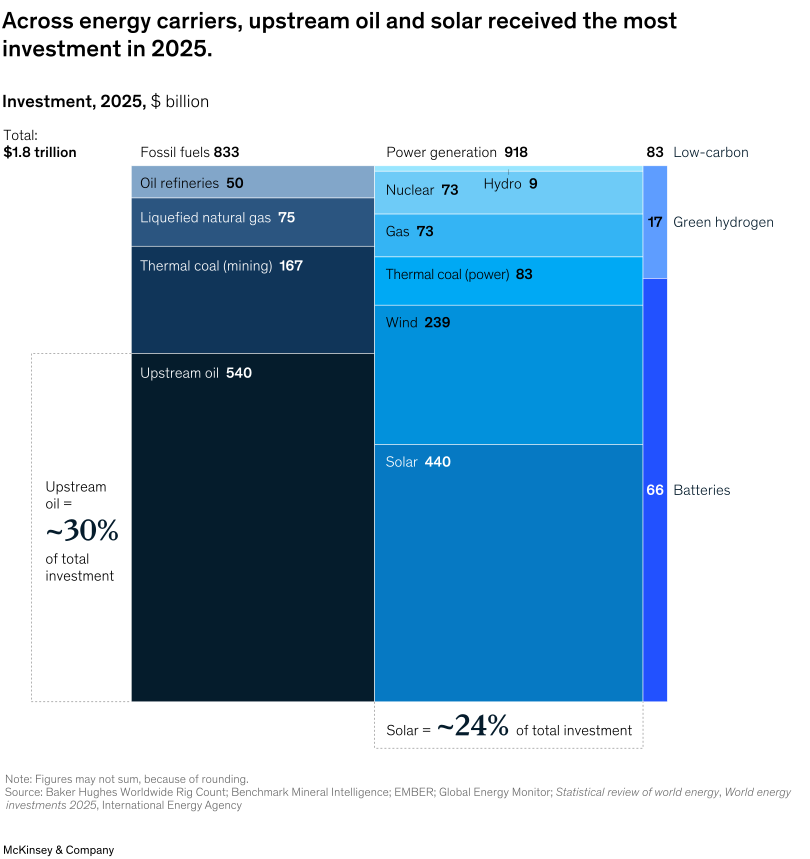
But investment volume is not the same as its ultimate value: What each dollar buys in system output differs by affordability, resilience, and emissions performance. Oil provides high energy density and dispatchable supply, but with significant life cycle emissions; solar provides low-marginal-cost electricity with no direct emissions during generation, but its variable output must be absorbed by the rest of the system (Exhibit 4). Both play important roles in today’s energy mix, but neither is currently sufficient on its own.
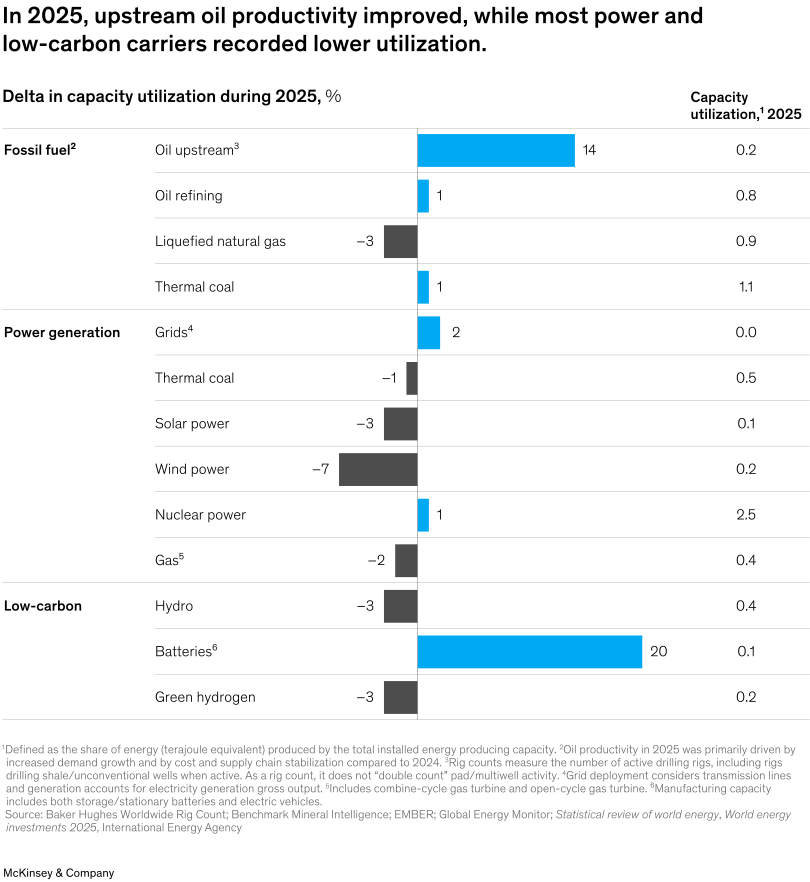
Further, while generation is expanding quickly, the infrastructure needed to connect, balance, and secure that supply—including grids, transmission, storage, dispatchable backup, flexibility, and fuel security—remains underfunded and underbuilt. The grid is the clearest example of this: In many major markets, transmission build-out lags far behind generation build-out due to long connection queues, complex permitting processes, and supply-chain bottlenecks for critical equipment.9
Without these enabling assets, a system can add capacity without becoming more reliable, deploy energy faster without becoming more affordable, and scale the fastest-growing technologies without addressing the vulnerabilities that emerge under stress. In a faster-growing and more complex energy system, those gaps may matter more.
Building the future energy system
The energy system ultimately has to deliver across four dimensions: affordability, reliability, resilience, and emissions reduction. The challenge is that no single energy carrier leads on all four.
Liquefied natural gas (LNG), for example, is cost-effective in many markets and can be made compatible with emissions goals through abatement, carbon capture and storage, or methane control. But it carries resilience risks. In 2025, more than 62 percent of internationally traded LNG originated from just three countries, Australia, Qatar, and the United States.10 Similarly, China today supplies more than 80 percent of global solar modules and more than 85 percent of the world’s battery cell production capacity by monetary value.11 These concentrated supply chains pose a resilience risk for low-carbon technologies, potentially even greater than the gas-dependency challenge facing Europe.12
Optimizing the system for only one of these dimensions is no longer sufficient. A system designed primarily around cost may prove vulnerable during supply disruptions, extreme weather events, and geopolitical disruption. A system optimized for emissions reduction may come under pressure on affordability and reliability. And a system designed around resilience may fail on emissions goals.
What matters is portfolio optimization across all dimensions to satisfy evolving sources of demand, and this will differ by geography. Determining which combination of technologies, infrastructure, and supply-chain diversification delivers the most system value per dollar invested is critical.
Urgent questions for the future
The 2025 data suggests that future demand growth is likely to be higher than previously assumed. This makes four questions even more pressing:
- Are current investment patterns strengthening resilience or simply adding generation? A system can look adequately supplied on paper and still fail under stress. For example, the 2021 Texas freeze and the 2022 European gas crisis cost between $80 billion and $130 billion in direct and indirect economic losses and $390 billion in energy subsidies, respectively—more than a decade of efficiency-gain costs spent in a few weeks.13
- Is capital flowing into the assets and technologies that contribute the most system value? Growth rates alone are not a measure of contribution. A technology expanding by 30 percent from a small base may add less near-term system value than one growing by 3 percent from a much larger base. The technologies that are easiest to scale are not always the ones that deliver best in terms of incremental output, flexibility, system cost, or near-term emissions reduction. A more useful scoreboard assesses system value per dollar invested in the whole energy system.
- Is the system being built in the most economically efficient way? In this context, efficiency means maximizing system value from each unit of capital deployed while meeting demand growth, emissions targets, and resilience requirements.
- What level of investment in clean-energy deployment, efficiency, electrification, and fuel switching is needed to bend the global emissions curve downward as quickly as possible and limit the rise in global temperatures? Since the Paris Agreement was signed in 2015, global greenhouse gas emissions have continued to rise, apart from the temporary decline in 2020 due to the COVID-19 pandemic.14 Although some regions, including the European Union, have made progress in reducing emissions, global investment has not yet been sufficient to offset the emissions associated with rising energy demand.15 The critical question is therefore whether low-carbon capacity is scaling up fast enough to reverse the trend of rising emissions.
Such questions shift the discussion from investment based on value to investment as a system-design choice. Until the conversation moves in that direction, capital allocation may continue to optimize for capacity additions without fully addressing system outcomes or challenges.
Clean energy deployment did not slow in 2025. By many of the metrics commonly used to track the energy transition—clean capacity deployment, low-carbon investment, and the share of renewables in new power generation—it continued to advance at pace. That is very significant progress, but growth metrics alone do not show whether the system being built is fully aligned with its broader objectives. Ultimately, success will depend on how capital is allocated across the energy system.
The next phase of the energy transition will require not just greater low-carbon capacity but also more investment in the assets that enable system performance. A more balanced investment framework is needed—one that evaluates technologies not only by deployment speed or headline cost but also by their contribution to overall system value.
For policymakers, investors, utilities, and industrial players, that may mean developing portfolios that combine low-carbon power with flexibility, dispatchability, and diversified supply chains, while also reducing permitting bottlenecks and accelerating transmission build-out.
The systems that perform best by 2030 are likely to be those that treat resilience, reliability, and affordability as integral parts of decarbonization rather than trade-offs against it. Getting there requires a broader lens than capacity additions alone.