With now over a decade since the landmark Paris Agreement, the global focus on decarbonization and sustainability has unlocked tangible gains in renewable energy build-out and energy efficiency. To date, 77 percent of global economies have a net-zero target, either proposed or legislated.1 But with a key interim decarbonization milestone now under just five years away, the energy transition shows signs of slowing momentum—at precisely the time it needs to speed up if targets are to be met.
Recent announcements that major hydrogen projects are being paused or canceled only underscore this shift in focus and momentum, with reasons cited including weak customer demand or land being assigned to data center development instead.2
In 2024, we published “The energy transition: Where are we, really?” which explored the reality gap between the deployment of eight key decarbonization technologies and their 2030 targets in Europe and the United States.3 Even then, the data suggested these regions were at risk of missing these critical targets. Today, less than 15 percent of the low-emissions technologies required to meet Paris-aligned targets by 2050 have been deployed, only a few percentage points higher than two years ago. This poses the question: How can we be so far off from these targets despite the consistent and encouraging acceleration in clean technology deployment—one of the key elements of a successful energy transition?
Recently, some countries and companies have scaled back or delayed their short-term decarbonization commitments, particularly in the context of growing pressures around energy security and affordability.4 And despite all the progress and commitments to decarbonize over the past decade, global emissions have still risen 9 percent since 2015.
Not only is the priority landscape shifting, but the geopolitical environment is also now more unpredictable, which could impact the pace of the energy transition significantly. With increasing defense budgets and uncertainty from tariffs, fewer resources may be available for decarbonization on a national level, while tariffs could lead to inefficient global supply chains, potentially slowing efforts to transition to cleaner energy.5
It is within this context that we reexamine the question, “Is the world on track to reach its 2030 low-carbon technology build-out plan?” To answer it, we evaluate nine key decarbonization technologies across China, Europe (which in our analysis includes the European Union, Norway, Switzerland, and the United Kingdom), and the United States to see if these regions are currently on track to reach their 2030 clean technology targets (see sidebar “Our analysis”).
While reaching net zero will require more than just these nine technologies to be scaled up, their current status serves as a clear indicator of whether these regions are on track to reach net zero by 2050.
Global emissions are still on the rise
Despite global efforts, emissions have risen 9 percent between 2015 and 2024, an increase of 3.3 gigatons (see sidebar “Key fuels and sectors behind rising emissions”).6 This growth is largely driven by increasing global energy demand fueled by population growth, rising industrialization, growing income levels, and emerging demand sources, such as data centers.7
However, from an intensity perspective, there is progress: The amount of CO2 emitted per unit of GDP is declining, indicating that the world is becoming more efficient and producing more value with less carbon.8
Among the three regions analyzed, emissions in China are still increasing, rising by 21 percent between 2015 and 2024 (Exhibit 1). This has been largely driven by increasing GDP per capita and ongoing industrialization. That said, China has recently begun to decarbonize at a rapid pace, which is critical, given that China is expected to still have the largest total energy demand out of all countries by 2050—31 percent of total demand.9

In contrast, emissions in Europe and the United States have decreased by 18 percent and 8 percent, respectively, between 2015 and 2024, in part due to policy. In the United States, for example, the Mercury and Air Toxics Standards (MATS) and the Clean Power Plan have historically allowed coal plants to be replaced with cost-effective gas power generation and renewables—leading to an overall lower carbon footprint.10 Over the past decade, more than a third of US coal plant capacity was retired, largely replaced by cost-effective renewable projects and gas plants, aided by abundant, affordable shale gas.11 However, since 2024, rising electricity demand has required additional supply, which has largely been met with gas and coal generation. As a result, despite growth in renewables, power sector emissions remained relatively flat in 2024.12
European policies, particularly those in the power sector (such as the EU Emissions Trading System), have also led to substantial emissions reductions.13 However, part of Europe’s emissions decline, particularly in 2021 and 2022, is due to lower industrial output in the region, effectively reallocating these emissions rather than eliminating them.14
Now, in 2025, some policy-enabled emissions reduction initiatives are shifting, with evidence suggesting that some countries and companies are amending their commitments. In January 2025, the United States withdrew from the Paris Agreement and any related United Nations Framework Convention on Climate Change (UNFCCC) commitments.15 Other countries are scaling back or pushing out their targets. For example, the Dutch government recently announced a reduction in its offshore wind commitments, lowering its 2040 target from 50 gigawatts (GW) to between 30 and 40 GW because of rising costs and lower-than-expected electricity demand from industry.16
There are some examples of priorities shifting in industry, too. In the automotive sector, for example, Mercedes-Benz and Toyota, which previously set ambitious targets for electric vehicle (EV) sales by 2030, now plan to continue offering internal combustion engine (ICE) and hybrid vehicles well into the 2030s, if demand persists.17
So, where are low-carbon technologies against 2030 targets?
With intermediate 2030 decarbonization targets fast approaching, understanding progress is critical. What needs to be operational by 2030 likely needs to have reached final investment decision (FID) today. Our assessment of global progress toward 2050 net-zero goals is based on the uptake of key decarbonization technologies across China, Europe, and the United States, in conjunction with the stated (or calculated) 2030 targets for each region.
Combining the operational, FID, and under-construction capacity for each technology in these three regions suggests that 2030 targets may not be met. Even when planned capacity is factored in (which will likely not be operational within the next four-and-a-half years), the 2030 technology targets may still fall short (Exhibit 2).

In the past year, some technologies have advanced. In 2024, global renewable capacity increased by 15 percent compared to the previous year, rising by 585 GW, and EV sales increased by 25 percent to around 17 million units sold worldwide.18 Solar photovoltaic (PV) build-out has accelerated due to low costs, and nuclear already meets 2030 targets in Europe and the United States.19
China has made significant progress in deploying low-carbon technologies and continues to expand its pipeline of under-construction capacity. Notably for renewable power, China has achieved its 2030 target for combined wind and solar installations ahead of schedule, approximately 1.2 terawatts (TW).20 However, this 2030 target is not fully aligned with what would be required to meet its 2060 net-zero ambition. Based on our calculated net-zero pathway for the country, we estimate that China would require 3.4 TW by 2030 and more than 7.0 TW by 2040. This means that the entire planned pipeline needs to be realized for China to be on track to fully decarbonize.
Two technologies—green hydrogen and offshore wind—consistently lag behind targets across regions, when looking at post-FID projects. For offshore wind, this is largely due to global build-out challenges, with many projects and tenders canceled due to severe cost inflation and the rising cost of capital.21 A similar trend is observed for green hydrogen: Globally, development has slowed, with a significant number of large-scale projects in Asia, Australia, Europe, and the United States being canceled, postponed, or scaled back.22 This is because of the interplay between elevated production costs, insufficient demand, slow industrial uptake, and constantly evolving regulations. With the construction time for both these technologies often exceeding five years, the 2030 targets are at risk—even if more planned or announced projects were launched today.
Each region has a distinct path to net zero
Of course, there are nuanced differences across regions and technologies. Our analysis shows that regions are prioritizing different technologies based on their unique context and where they are in their net-zero journey.
China, for example, is focusing heavily on electrification and renewable energy build-out, but has low sustainable fuel and green hydrogen production targets. China’s net-zero target is set for 2060, rather than 2050, which also influences its decarbonization strategy. This has led to some technologies, such as carbon capture, utilization, and storage (CCUS), not being prioritized—although several projects have been announced beyond current operational projects.23
In contrast, both Europe and the United States could significantly exceed their 2030 CCUS targets if all planned or announced projects are realized. However, these projects require a significant acceleration of FID and technical derisking, given their long construction timelines and relatively nascent infrastructure.
Battery energy storage systems (BESS) are another interesting contrast. While none of the regions in the analysis currently has enough planned or announced capacity to reach its 2030 BESS target, the rapid adoption of this technology could change that. The cost of batteries has lowered significantly in recent years, and the business case for operators (which includes balancing the grid through ancillary services and energy arbitrage strategies) has strengthened too, making this a fast-growing technology in the energy space.24
Here, we review three technologies that are most regularly associated with the power sector’s transition: offshore wind, solar PV, and BESS.
Offshore wind
China, Europe, and the United States will all likely miss their 2030 offshore wind targets because of slowing installation rates and project announcements (Exhibit 3). Despite no official offshore wind targets for China and the United States, our analysis indicates that significant growth in installed capacity is needed. For the United States specifically, there is a limited number of offshore wind projects at present, and as such, this technology is not currently positioned to play a meaningful role in the US transition or future power mix.25 In the European Union, while announcements still remain significant, recent trends have put into question whether the 2030 target will be met (for example, the Netherlands is lowering its 2040 offshore wind target, and there have been unsuccessful auction rounds in both Denmark and Germany).26

Solar PV
Solar PV continues to be the success story of the energy transition. Although Europe and the United States currently lack enough announced capacity to meet their 2030 targets, the ease of build-out suggests that these targets will still be met.27 In fact, China has already more than doubled its 2030 target, with approximately 300 GW of additions added since 2023 (Exhibit 4). This is due to the continued decline in costs and relative ease of build-out, including short installation cycles, which have spurred the adoption of large-scale and rooftop solar and made it attractive for commercial and household use alike.28

Energy price hikes and inflation have further pushed the adoption of rooftop solar, both improving affordability and security of electricity supply. However, further acceleration in solar build-out, which could compensate for lagging deployments in other technologies, is not guaranteed. Supply chain risks, tariffs, and other geopolitical forces could slow progress, with examples of this already emerging—the United States has recently rolled back many subsidy policies for solar.29
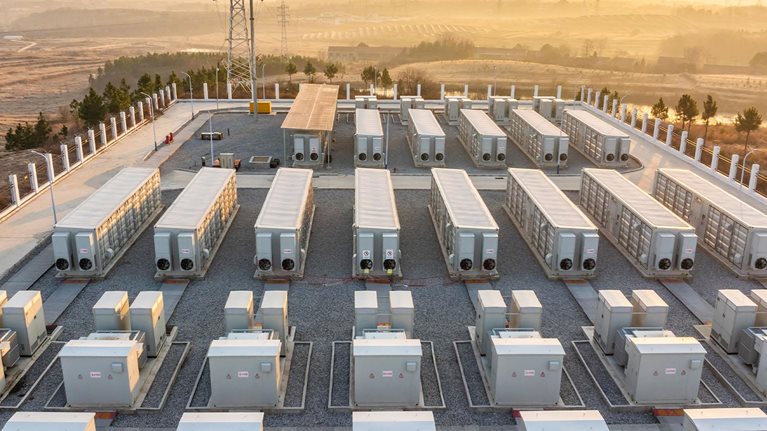
Battery energy storage systems
BESS remains the dominant question mark in 2025. While the current pipeline is not sufficient to meet targets across the regions analyzed, deployment over the past few years has grown rapidly. Our analysis shows that regarding time to site, permit, construct, and interconnect, a BESS project is materially faster than many other grid technologies, such as nuclear or gas combined with CCUS (Exhibit 5). The rapid acceleration of installations in the past five years is primarily because the business case for BESS has proven positive for large-scale operators and households alike when paired with rooftop solar.30 Load balancing is also becoming a popular source of revenue for battery operators.31 Planning and integrating BESS with renewable rollout (combining the business case) is critical if 2030 net-zero targets are to be met.

The challenges affecting low-carbon technology build-out
Three main reasons help explain the shortfall of key technologies against 2030 decarbonization targets.
Shifting policy focus
After a surge in sustainability policies during the 2010s, there is evidence that proposed and adopted policies have stagnated since 2020, particularly in OECD countries. Not only have decarbonization policies begun to stagnate, but governments are also increasingly shifting their policy priorities, with a refocus on defense spending—with some countries adopting a mandate to spend between 3.5 percent and 5.0 percent of GDP on defense.32 Additionally, energy price volatility has reminded policymakers of the need for secure and affordable energy supply in the face of rapidly rising demand, creating a very challenging environment for stakeholders to navigate while they aim to balance these goals with sustainability goals.33
Increasing costs
After years of declining costs for renewable energy sources (RES) and EV batteries, driven by continued technology improvements and efficiency gains, 2023 marked the first increase in low-carbon technology costs (Exhibit 6). This uptick is attributed to higher interest rates, which have increased financing costs by between 10 percent and 20 percent since 2020, as well as rising raw material prices, higher labor costs, and grid connection costs. As a result, some of the latest offshore wind tenders in Europe have been canceled or delayed.34 Offshore wind, in particular, is impacted because of the material intensity and high network costs required for construction. However, since 2024, these costs have begun to reduce, making the business case more attractive again.35

Growing geopolitical uncertainty
Over the past few years, the global geopolitical landscape has changed significantly, prompting some governments to reevaluate their defense budgets and prioritize energy security and affordability, which may reduce the resources available for decarbonization efforts.36 Additionally, high business case risks from market redesign, including capacity markets, subsidy reversals, and offtaker uncertainty, are dampening investment appetite for clean energy technologies. Tariffs and trade tensions are further exacerbating this uncertainty, making it even more challenging to commit to long-term, high-cost projects.37 Collectively, these factors are posing substantial obstacles to the energy transition.
Despite progress in certain technologies, several regions may not be on track to meet their 2030 decarbonization goals. However, there is time for regions and companies to make significant changes to ensure decarbonization by 2050.
While there is currently a gap in the required investments across various low-carbon technologies and regions to meet stated net-zero targets, a reversal in policy or an acceleration of capital deployment could be possible. Historically, rapid course corrections have occurred—the COVID-19 response, for example, and the financial bailouts in 2008. Although the contexts were different, these examples demonstrate the potential for swift action.
With only five years until 2030, the urgency is growing. Stakeholders across the value chain can revisit their decarbonization plans to ensure they are still sufficient to achieve their net-zero goals.