Introduction
Every country tells itself a story about who it is. For most of the past hundred years, Australia’s story was simple and comfortable: It was the lucky country, where with a bit of effort, great results came naturally. “She’ll be right, mate,” as the uniquely Australian idiom puts it.
Now, that story has changed, replaced by the very different sense that progress is stalling, that the country is no longer doing well, and that the birthright of prosperity is slipping away. Only 22 percent of Australians believe the next generation will be better off.1 Their lived experience suggests why: The country has not had such a slow decade of income growth since before the Second World War.2
But the story and the current perception share a flaw. Each casts Australia as a passive recipient of fortune: lucky then, unlucky now. Australia’s true experience is very different: It has made its own luck through deliberate choices, actions, and plain old “hard yakka.” That is the lesson offered in particular by Australia’s two boom periods (1945 to 1970 and 1993 to 2015)—periods we can learn from.
The McKinsey Global Institute (MGI), in its book A Century of Plenty, offers a global perspective with additional lessons.3 MGI’s research demonstrates that the past century brought material advances in standards of living globally, and that a second century of plenty is within reach. The same is true for Australia.
While the challenges are real, we hope Australia can build another great century if it can make the timely and deliberate choices that built the last one.
This paper explores that prospect in three parts:
- The past century of plenty. We look back at Australia’s exceptional ability to continually reinvent itself across the century and what drove its two eras of exceptional, world-beating growth.
- The lost decade of growth and a crisis of hope. We examine why optimism has eroded over the past decade, focusing on stalled productivity and new challenges that put prosperity at risk.
- A path to future abundance. We paint a picture of what another century of plenty could look like and set out the seven beliefs needed to turn that vision into a choice Australia can make.
Today, the country’s confidence is at a low ebb, and Australians feel that the country has perhaps irretrievably lost the special ingredients that made it a high-growth society. We cannot make any guarantees about the future, but we at least want to bring the possibility of progress back to life. Australia has a genuine option to choose growth.
Australia’s past century of plenty
Australia’s economic record over the past hundred years has rewarded its citizens and impressed the world in equal measure. The country has not only made good use of its natural and human resources but also, when needed, rejuvenated its economy and forged a strong compact for bold reform.
Some of the highest living standards in the world
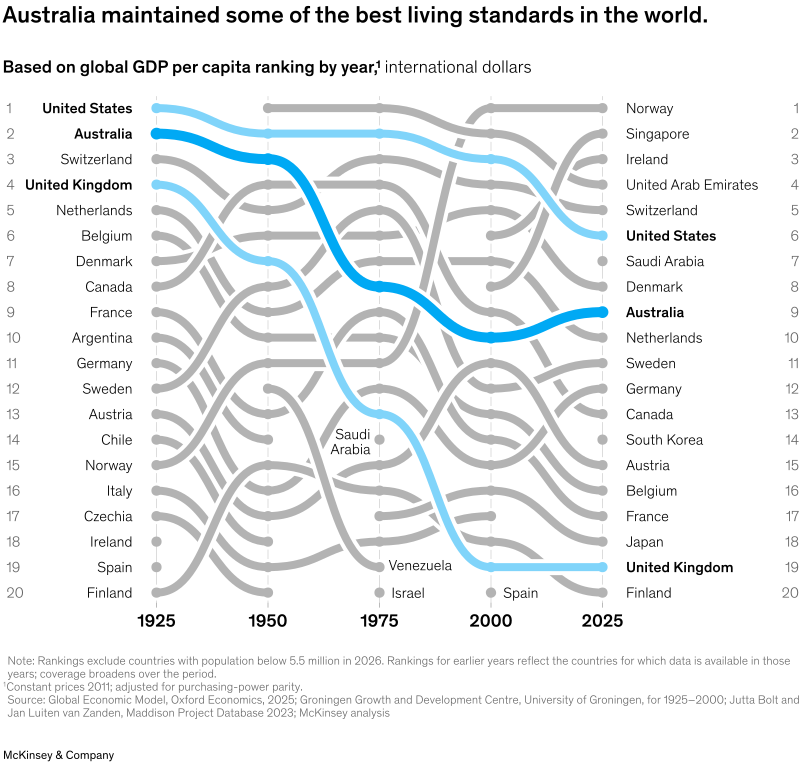
Australia entered 1925 with the second-highest standard of living in the world and has maintained a high level ever since. On the measure of GDP per capita, it is one of only four major countries to rank in the world’s top ten for each of the past four quarter-centuries, alongside Denmark, Switzerland, and the United States (Exhibit 1).4
By today’s standards, however, Australia in 1925 was poor. Its per capita income was about the same as Guatemala’s is now.5 Life expectancy was 21 years lower,6 child mortality was 20 times higher,7 indoor toilets were a luxury, electricity reached hardly any homes, and only one in five adults had progressed beyond primary school.8
To reach today’s standard of living, Australia’s GDP per capita grew sixfold in real terms, faster than that of many other rich nations (and a little slower than the United States). Back in 1925, Argentina had a similar standard of living, but its GDP per capita grew only threefold, capturing barely half of Australia’s gain. Had Australia grown that slowly, it would have sunk to about 60th today, just ahead of Turkmenistan.9
For the most part, this prosperity has been widely shared. Australia is in the middle of the pack in the OECD on inequality of disposable income,10 but it has one of the most economically mobile populations on the planet. Australia’s Productivity Commission found that a parent climbing ten percentile points up the income scale was linked to an increase of less than two percentile points in the eventual rank of their child. Success is more hereditary even in Sweden than in Australia.11 Over the past 20 years, wages of the bottom decile of earners have outgrown the median and the top-decile incomes.12 And the country’s system of progressive tax, transfers, and means-tested government services is particularly efficient at ensuring a good life for most. The Gini coefficient, a measure of inequality, almost halves as we go from private income to “final income,” which adds the impact of taxes, transfers, and in-kind services.13 Our job as a nation going forward is to maintain this ladder of opportunity and the dynamism that enables people to step up.
The glaring exception to the country’s otherwise broad economic progress has been Indigenous Australians, who are overrepresented in the lowest income quintile and have rates of secondary education completion and employment only two-thirds those of non-Indigenous Australians.14
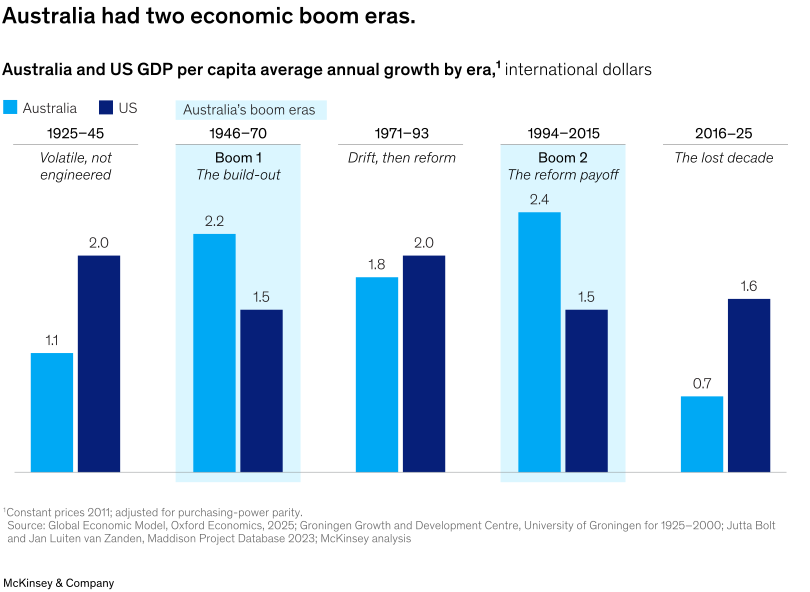
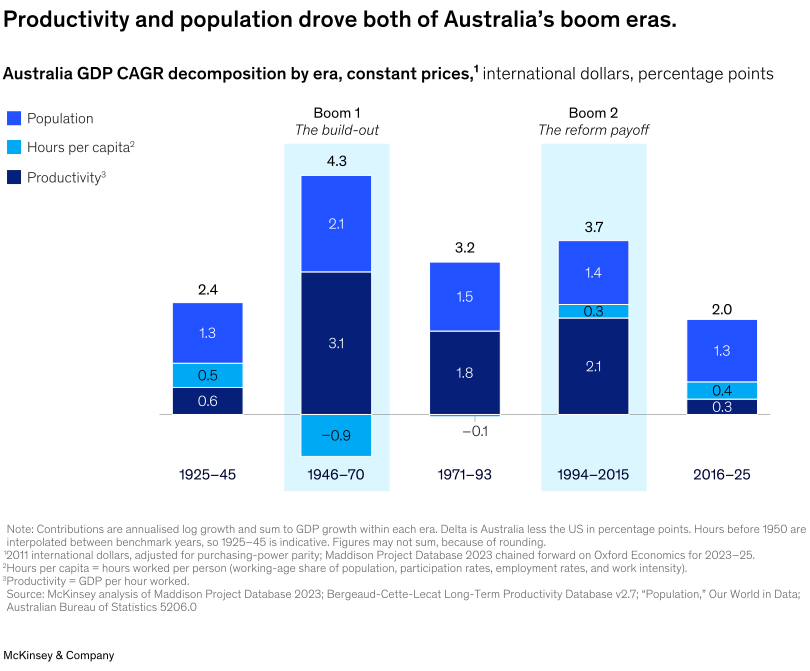
Two eras of strong growth drove Australia’s prosperity. Australia’s past century encompasses five distinct economic eras. Exhibit 2 compares Australia’s growth rates during those eras with US growth rates. Through the Great Depression and Second World War, Australia’s economy was unsteady and did not benefit from wartime industrialisation.15 Postwar, Australia embarked on a remarkable course of national construction, with a strong immigration program, national infrastructure projects such as the Snowy Mountain Hydro-Electric Scheme, and a huge surge in local and foreign investment. The payoff was annual GDP per capita growth exceeding 2 percent for over 20 years, well ahead of the United States. The global oil shocks of the early 1970s punished what had become a protected and inflexible Australian economy, which put an end to that run. Australia responded from 1983 onwards by unfettering its market forces with the boldest reform decade in its history: floating the dollar, cutting tariffs, opening the financial system, forcing industry competition, introducing compulsory superannuation, and privatising many public assets. The reward was a second boom period from 1993 to 2015, during which Australia maintained the longest stretch of positive growth in the OECD.
Abundant energy, capital investment, and people
Australia’s rare achievement of keeping living standards high for over a century did not happen by accident. It was driven by smart people on the edge of the world who understood the importance of adding abundant energy and capital to its growing human capacity. A machine of progress powered our economic rise.
Australia harnessed abundant energy at low cost. Since coal-fired electricity was first transmitted from Yallourn to Melbourne in 1924, total energy use has grown about 12-fold.16 Cheap oil, gas, and electricity underpinned competitive transport, resource processing, and manufacturing. Real electricity prices in New South Wales fell by roughly 70 percent between 1955 and 2004, becoming the fourth cheapest in the OECD.17 By 2016, however, our rank slipped to tenth, higher than the OECD average.18
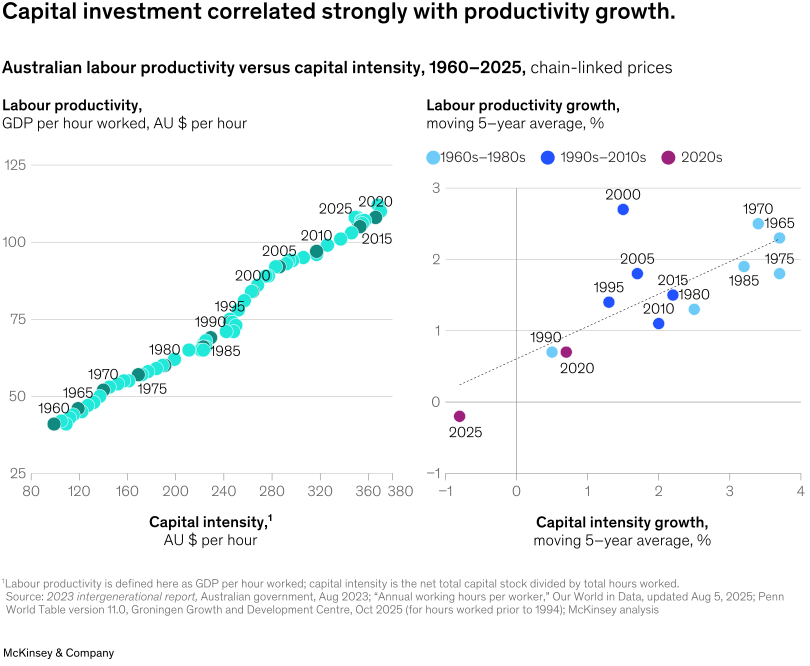
Australia invested capital to enable its workforce. Between 1960 and 2025, Australia’s real capital stock also grew nearly 12-fold, while its workforce grew only fourfold.19 As a result, Australian workers today have three times as much capital behind them as their 1960 counterparts20: bigger mines and ports, better machines, and more powerful computers.
Exhibit 3 shows how labour productivity has tracked that capital intensity closely since the 1960s (and also suggests how both have trailed off since 2015). And while centuries-old economic debates continue around capital versus labour, the truth is that capital and labour worked together to produce high productivity and wages. MGI’s research confirms this, finding that about 70 to 80 percent of growth from labour productivity stems from capital investment, or “deepening,” across the global economy.21
That investment was led by large, productive firms. The small-business sector is vital to Australia’s economy and culture, employing roughly two-thirds of its people22 and almost all of its entrepreneurs. However, large modern firms have emerged in every sector and can invest on a scale that lifts economy-wide productivity and growth. Australia’s 50 largest listed firms have lifted their share of GDP from 13 percent to 76 percent since 1978, meaning the average top 50 company’s market capitalisation grew 23 times larger in real terms over the past 50 years.23 On average, such larger companies have twice the productivity of smaller ones.24 And half of Australia’s non-mining investment since 1978 has come from firms in the top 1 percent of revenue.25 This investment was made possible by deeper capital markets: The initial impetus for this was extensive privatisations through the 1990s, followed by a pension pool that has reached $4.4 trillion, the world’s fifth largest and the fastest growing of the top five.26
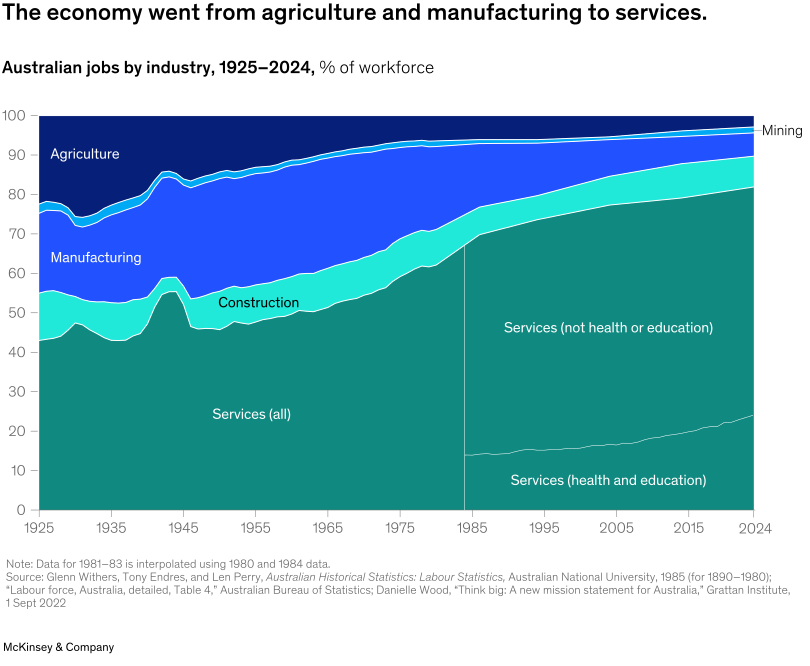
Australia built a larger and smarter workforce. Australia’s workforce has been bolstered by postwar immigration, baby boomers reaching working age in the 1970s and 1980s, and fast-rising participation among women. While the population grew fivefold27 over the century, the nonfarm workforce grew roughly eightfold.28 Australians also studied longer and harder. They are 32 times more likely to be in higher education today than in 1925, lifting tertiary attainment to 57 percent among those aged 25 to 34, six percentage points higher than the United States.29 This matched the nature of work in the economy: Australians moved off the land and then out of the factory into service-based and knowledge jobs, which now employ more than four in five people (Exhibit 4). A century ago, most Australians were paid for what their hands could do; today, most are paid for what their minds can do.
Reinvention, time and again
Constant reinvention drove Australia’s two eras of sustained growth. Each time, Australians drew upon strong foundations of natural, physical, financial, and human capital to reinvent themselves. The country reshaped its economy and trade, and supported companies in taking competitive advantage and innovation to the world.
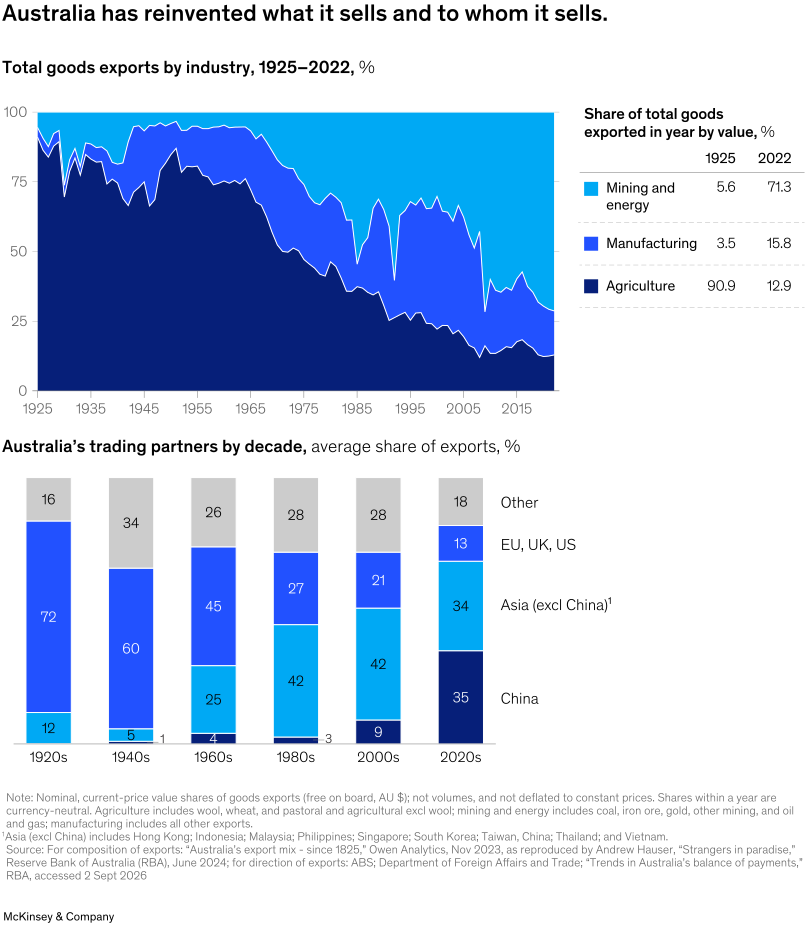
Australia reshaped its economy and what it sold to the world. Since the 1970s, Australia has steadily opened up its economy, cutting tariffs and signing free trade agreements (which have increased from one in 1983 to 19 today).30 That has helped Australia reinvent both its export base and its customer base roughly once a generation (Exhibit 5). Wool made up almost half of goods exports by value in 1950; today it accounts for just 1 percent.31 Iron ore was embargoed from export until 1960 to conserve the resource. Within a decade of the embargo being lifted, the exports were a pillar of the economy. Gas exports were unknown until the 1990s, yet Australia quickly became the world’s second-largest liquefied natural gas exporter (and was its largest for a time).32 Meanwhile, Australia’s export customers changed frequently, from the United Kingdom to Japan and the United States and then to China, which now buys more than one-third of everything Australia sells abroad (Exhibit 5).33
Australia’s companies developed innovations and competed on the world stage. Breakthrough technologies and companies remind us of what’s possible for Australia. Inventors developed and sold the underlying technologies for the cardiac pacemaker, the black box flight recorder, medical ultrasounds, frozen-embryo IVF, Wi-Fi, the cochlear implant, and the HPV vaccine.34 Equally welcomed were companies that could compete on the world stage. Each era had its global champions: early pastoral finance houses, such as Elders and Dalgety; postwar resource and manufacturing giants, including BHP and CSR35; firms that went global in the 1990s and 2000s, such as Amcor, Brambles, Macquarie, and Westfield; and today’s medical technology and software leaders, including Atlassian, Canva, Cochlear, and ResMed.
The past century of progress is worth being proud of: two long periods of abundant growth, repeated reinvention, and a society transformed in ways unimaginable to Australians 100 years ago.
The lost decade of growth and a crisis of hope
Australia is now deep into the fifth era of its postwar economic history. After riding high for era four’s quarter of a century, it has lost its capacity for renewal, productivity, and income growth—temporarily, we hope.
In this section, we examine how and why Australia has lost its 20th-century optimism over the past decade, particularly among younger generations. Younger people have shared less of the good times than their elders and now share less of the economic pie. Worse, the pie is not growing as it once did. Investment has slowed dramatically, particularly in the market sector, starving productivity of its fuel. And productivity has been lost in the key enabling sectors of energy, construction, and finance, reducing the overall competitiveness of the economy.
As a result, Australia is in a much weaker position to face three immediate challenges that will have lasting consequences: a new world order, an ageing population, and the sudden emergence of artificial intelligence. The strain of those challenges could result in a crisis of hope.
Australians are losing their optimism as incomes fall
Australians are no longer confident that “she’ll be right, mate.” Economic optimism has slumped from a peak of 86 percent in 2009 to an all-time low of 41 percent today.36 More than two-thirds of people say the country is heading in the wrong direction, four in ten say it’s difficult to make ends meet, and only 22 percent believe the next generation will be better off.37
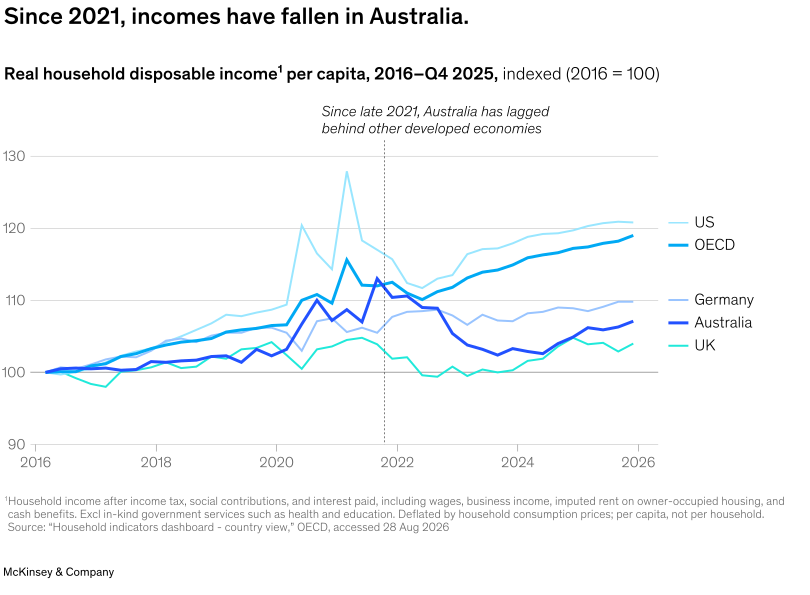
These sentiments are grounded in the numbers. Real household disposable income per capita has fallen 5.2 percent since mid-2021, even as the OECD average rose 6.3 percent (Exhibit 6).38 Australia has been in the bottom third of reporting OECD countries over the past decade and in the bottom four over the past five years. Exacerbating this trend is persistently high inflation, which remains the highest among advanced economies except Iceland, making this the longest stretch of high price growth since the 1980s.39
The generational compact is fraying
Younger generations are the least optimistic. While life satisfaction has fallen for every age group below 70, young adults aged 18 to 24 feel a decline almost twice as sharp as the rest.40
The age gap in optimism should come as no surprise. While young adults have known only an economic flatland, older generations have experienced Australia’s economic peaks and growth of more than twice the average GDP per capita. Since the global financial crisis of 2007, the average income of Australians under 35 has gone down, while that of older Australians has kept growing.41 More recent data backs up the divide.42 In the early 1990s, over-60s lived on net incomes worth about 61 percent of working-age households; today that figure has grown to 95 percent.43
Slow income growth for young adults is compounded by a decline in housing affordability. In Australia, to be “wealthy” is to own a home. Australia is among the wealthiest countries per capita (adjusted for purchasing-power parity), but almost 70 percent of that wealth is in residential property that now ranks among the most expensive in the world.44 In the early 2000s, the average home cost about four times the average yearly income; now it is ten times.45 Increasingly, young adults feel locked out of that market; while two-thirds of those aged 30 to 34 owned a house in the 1980s, fewer than half do now.46 Homeownership is our biggest pool of wealth but has also become a chasm of intergenerational divide.
The economic engine has stalled
Australia’s GDP per capita has been falling because productivity has flatlined. Productivity growth fell to roughly zero in 2015 and has been negative since 2022 (Exhibit 7).47 Instead, growth has been carried by more people and more hours. With unemployment at a near-record low and participation at a near-record high, those levers are no longer real options. There is only one durable solution: improved productivity.48
Ahead of last year’s Economic Reform Roundtable, McKinsey outlined the reasons for our flatlining productivity—and these reasons have not changed.49 First, investment has dried up, especially the most productive kind. The critical enabling sectors of construction, energy, and finance have become less productive, reducing our competitiveness. Australia has not created an environment for standout firms to thrive and invest. Work has migrated to the nonmarket sector, where productivity growth is harder to deliver. But our biggest question remains: How do we forge a compact that prioritises productivity?
The market sector is not investing enough.50 As we have seen, backing workers with more capital is the surest way for economies to raise productivity. Australia’s capital stock per hour worked grew at a healthy 4 percent a year in the decade to 2015, before the growth rate fell to an almost stagnant 0.5 percent (Exhibit 8, right-hand side), compared with 1.2 percent in the United States.51 This investment shortfall accounts for an estimated 70 percent of Australia’s productivity decline since 2016.52 Australian workers increasingly have less capital, and fewer up-to-date tools, to work with.
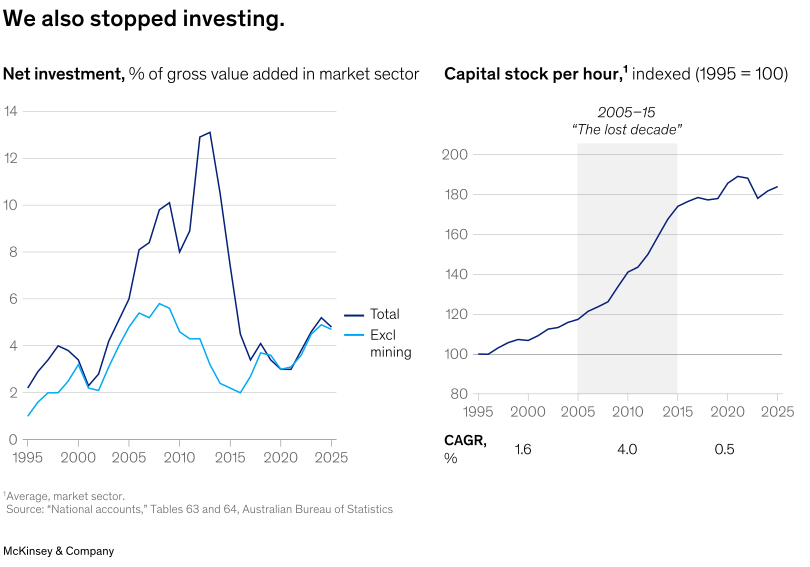
While investment has declined in growth, it has also been directed to less-productive uses. Australia has shifted from investment in machinery and equipment toward infrastructure, which now receives more than half of the country’s productive investment.53 And we are underinvesting in intellectual property at just 19 percent of productive investment, less than half that of the United States at 39 percent. Research from e61 Institute suggests that this alone accounts for much of the yawning productivity growth gap between Australia and the United States.54
Australia does not lack capital: The banking system’s assets were about 240 percent of GDP in 2024, and the superannuation system holds $4.4 trillion in assets.55 However, banks have been lending more to property than to business, with the ratio shifting from roughly 1:1 in the mid-1990s to nearly 2:1 in 2024.56
Productivity in energy, building, and finance has gone backwards. These three sectors are key inputs to all sectors and are perhaps the strongest determinants of whether an investment project should proceed. Yet they are among Australia’s weakest in terms of productivity. They have also been a focal point of regulation, absorbing more than 80 major policy and regulatory changes since 2016.57
In construction, producing the same output now requires around 11 percent more hours worked than it did a decade ago (Exhibit 9).58 Large projects in particular rarely go according to plan.
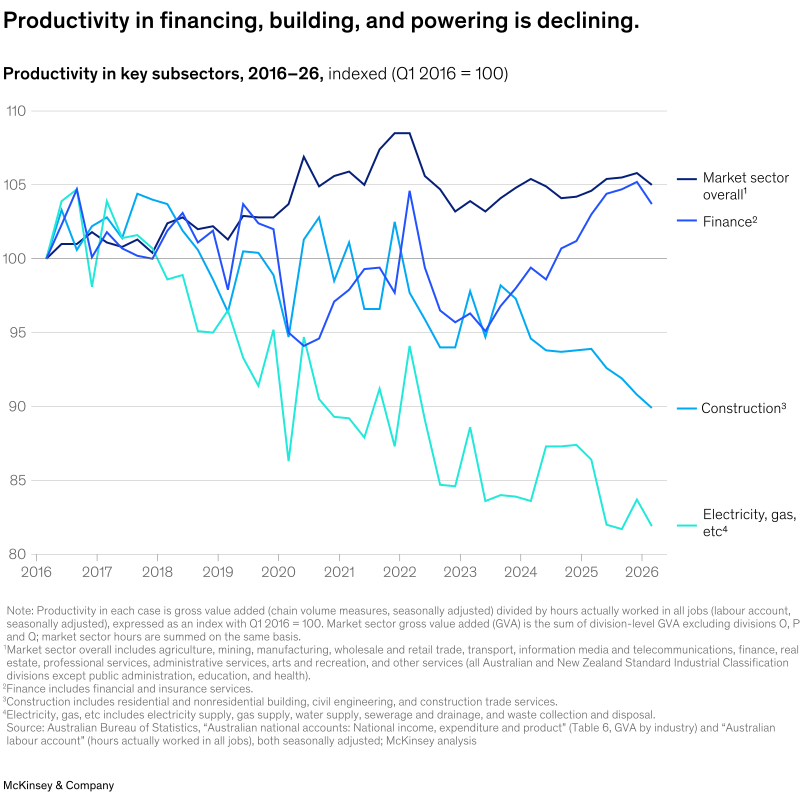
The pattern is similar in energy, where the same output now requires 20 percent more hours of work. Granted, Australia is in the midst of a once-in-a-century reconfiguration of how it generates, distributes, and uses energy. However, the country’s major energy transition projects have cost two to six times as much as initially estimated and are taking at least twice the intended time to build.59This has contributed to higher energy costs. As an energy superpower, Australia should be enjoying some of the cheapest energy in the world. Instead, energy prices ratcheted up over the decade to 2016, moving Australia from among the world’s most competitive energy markets in the OECD to the middle of the pack.60 From there, retail prices have stayed high and risen above overall inflation.
Australia’s banks once supercharged the country’s productivity, clocking 5 percent annual productivity growth between 1995 and 2016.61 Since the Banking Royal Commission in 2018,62 that productivity has gone backwards, although more recent data indicates some green shoots in productivity since 2023.63
Australians are not creating enough new large standout firms. MGI research shows that almost 80 percent of the productivity growth in an economy comes from 5 percent of its companies, what we call standouts.64 Through a combination of scaling excellent business models and renovating older ones, these companies are the ones that lift entire economies. Certainly the Australian corporate sector is showing less dynamism than the United States. Nine of the top ten US companies are new to the list since 2000,65 versus four in Australia. On average, Australian top ten companies are roughly three times older than US top ten companies.66 At the same time, Australia’s regulatory and tax environment has become more onerous. For example, the Mercatus Center reports a 52 percent increase in restrictive clauses in federal law since 2007.67 We have not created an environment where standout firms want to thrive and invest.
The nonmarket sector outpaces the rest of the economy. Hours worked in the nonmarket sector—education, health, and public administration—have grown at double the rate of the market sector for 30 years, and the rate of divergence is increasing over time. As a result, nonmarket sectors now account for 28 percent of hours worked, up from 20 percent in the mid-1990s. There is no doubting the value of a longer, healthier life and a well-educated child. But measured productivity in these sectors has declined since 2016.68 Further, more than half of Australia’s investment growth in the past decade has been in the public sector.69
New challenges are also weighing on optimism
Rejuvenating Australia’s productivity would be hard enough in a stable and predictable economy. However, like most countries, Australia is facing a host of structural and operational challenges that make it more difficult to choose the best path and stick to it. Primary among these are shifts in the geopolitical landscape, an ageing population, and the economic revolution of artificial intelligence.
A new world order is challenging trade and security norms. Australia is balancing its economic interests in Asia and its strategic priorities with the West in an increasingly contested geopolitical environment.70 China’s remarkable growth since 1990 to roughly 20 percent of world GDP means that the United States is no longer the sole superpower.71 The highest proportion of Australia’s trade with major economies as a percentage of GDP is with China, yet our strategic partnerships are elsewhere.72
Securing Australia’s economy in this environment will require Australia to have more strategic degrees of freedom. Yet with a thin industrial capability and heavy dependence on primary exports, Australia may not have that freedom and may be exposed to geopolitical and supply chain risk. Australia is now the least industrialised and the second-least-complex economy in the OECD (slipping from 33rd to 73rd in Harvard’s global rankings since 1995), as well as the world’s largest diesel importer.73 The recent crisis in the Strait of Hormuz is making this vulnerability apparent.
An ageing population is asking more of the working-age population. For the first time, the number of Australians aged 65 and up outnumbered those aged 16 and under.74 The number of working-age people for each person age 65 and up has already halved since 1970, from about 7.0 to 3.5 (Exhibit 10). The number of people aged 85 and up is growing 4.5 times faster than that working-age population.75
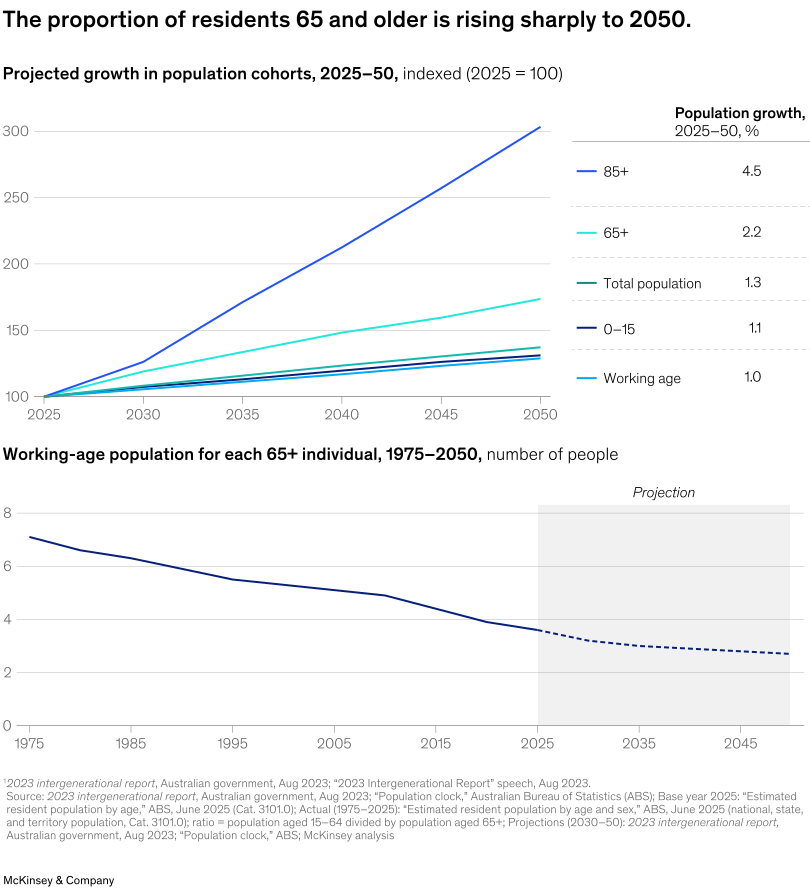
The economic consequences of the ageing population are profound. With a smaller proportion of people working, growth is far harder.76 The costs of care for the older population will further strain the fraying generational compact. The average 43-year-old contributes a net $15,000 to the public purse, while $24,000 is taken out for each 78-year-old.77 Balancing a budget with only 2.7 working-age people per retiree, as projected by 2050, will be no mean feat.78
The dramatic impacts of AI are only just starting to be felt. Artificial intelligence is evolving at an extraordinary rate. By several measures, the capability of AI models has been doubling roughly every seven months since 2019, and it may be accelerating.79 This is around three times faster than Moore’s Law concerning the improvement in semiconductors,80 which ushered in our digital age. Two years ago, we estimated that AI could technically automate up to 62 percent of task hours in the Australian economy,81 an estimation that can only have increased.
The labour market impact of the AI revolution is yet to be felt but may be larger than expected. Australia’s latest two government studies found that adoption is still early and that AI is more likely to augment jobs than replace them, although employment growth in the most exposed occupations has slowed.82 History backs up the finding that new technology creates work as well as displacing it: About six in ten US workers are employed in occupations that did not exist in 1940.83 However, the reach, pace, and scale of AI’s development might stretch the power of our historical comparisons. Whatever happens, we know there will be a very big workforce transition.
Lost optimism, increased generational divides, missing investment and productivity, and demanding new challenges: There is plenty from the past decade to fuel a “glass half empty” view of Australia’s future. Against that stands Australia’s economic record over a century and the country’s ability to come back time and time again. In truth, its glass is more than half full.
A path to future abundance
Australia’s past century has seen consistently high growth marked by two eras of deliberate and successful economic reform. When needed, the country has been able to guide its people, capital, and energy to new sources of growth and prosperity.
We see no structural reason why Australia cannot do so again. It has not lost the attributes of its century of plenty: the natural resources, the institutions, the capital, the people, the innovation, the global cities at home and international networks that can connect them all. It has not lost the desire to rediscover its mojo and dream big.
This nation was not built by pessimists or zero-sum thinkers. Australia’s first job now must be to restore optimism—to restore the idea that growth is good, growth is for everyone, and growth is possible.
The country owes itself something more than cautious incrementalism. Australia has an obligation to dream big and choose plenty.
MGI’s Century of Plenty offers one vision of what “plenty” might mean at the end of the 21st century. Per capita income could more than triple, again, from about $60,000 now to $210,000 in real terms.84
Australia’s economy would expand nearly sixfold, though its population is projected to grow by 1.6 times, to 43 million.85
To reach an economy of that size, Australia would need to sustain real GDP per capita growth of about 1.6 percent, more than the last decade but lower than the previous century’s 1.8 percent. It would require homes, transport, water, and infrastructure for a population that is more than 50 percent bigger, as well as the capital to invest in industry. It would also need roughly twice as much energy, despite continued improvements in energy efficiency.86 As much of this energy would be electricity rather than gas or diesel, the electricity system would need to be roughly eight times as large as it is today. By 2100, about three-quarters of primary energy—how we heat homes, move people and goods, and run industry—would be delivered as electricity, up from just one-fifth today.87
Believing in Australia again
Dreaming big is a choice, not a prediction. But before the choice must come belief. We suggest that there need to be seven aspects of that belief:
- Australia can build standout firms that keep the country at the frontier.
- Australia can turn the AI boom into a productivity and entrepreneurship boom.
- Australia can age gracefully and turn longer, healthier lives into an economic strength.
- Australia can remain the resource superpower of the 21st century.
- Australia can continue to be the place the world’s most talented people want to live and work.
- Australia can again reinvent itself in an evolving world.
- Australia can reclaim its capacity for large-scale deliberate reform.
These are the conditions that make it rational to be an optimist—to make the machine of incremental productivity improvement that drove our progress hum once again.
1. Australia can build standout firms that keep the country at the frontier
Almost 80 percent of productivity growth in an advanced economy comes from just 5 percent of firms.88 Australia does not need a large number of standout firms, only a few. It has always had globally competitive firms and can build them within a single generation: Atlassian, Cochlear, CSL, and Fortescue were all built in the past 30 years. New firms may well emerge in 18 future arenas—from cloud services and cybersecurity to robotics, batteries, obesity drugs, and space—that are growing roughly four times the average in market capitalisation and ten times as fast in revenue.89 To assist them, Australia must create an economic environment that fosters and rewards bold and ambitious companies.
2. Australia can turn the AI boom into a productivity and entrepreneurship boom
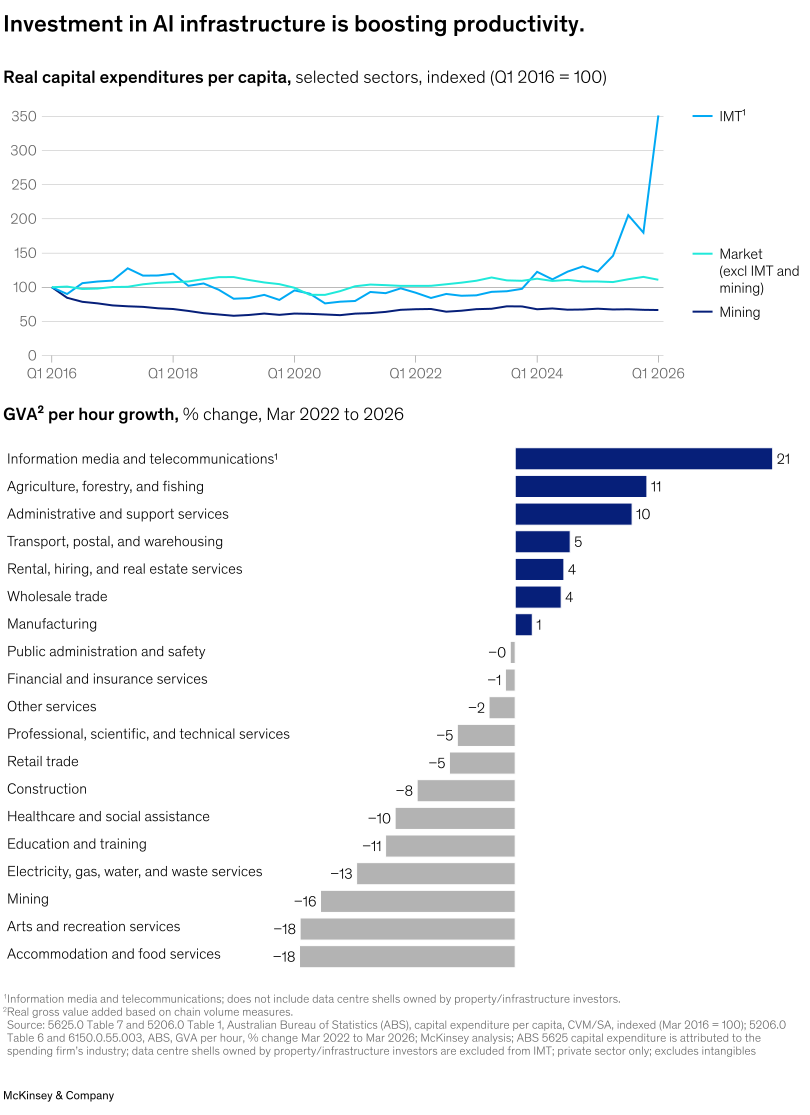
While AI is a challenge, it is certainly also an opportunity. Just nine US companies, which the McKinsey Global Institute calls “omniscalers,” deployed more than US $800 billion in 2025 alone, roughly six times Australia’s entire private capital expenditure for the year. Australia has already started to take advantage of that scale of investment without having to repeat it. Information media and telecommunications is the only sector in which capital spending and productivity are rising together. Since March 2022, investment per person has almost quadrupled,90 and gross value added per hour is up 21 percent against an economy-wide fall of 5 percent (Exhibit 11).91 If Australia captured just half the potential of automation, it could restore productivity growth to more than 2 percent a year.92 AI can radically increase those outcomes as AI agents begin writing and shipping software themselves.93 The surest path to productivity may be in applying AI to industries in which Australia already has standout global firms: in the discovery of pharmaceuticals, the search for critical materials, and the design and running of mines.
3. Australia can age gracefully and turn longer, healthier lives into an economic strength
Perhaps counterintuitively, automation and AI might make it easier for Australia to make the most of longer, healthier lives. Increasing the workforce participation of older Australians is essential for a return to high national productivity. Australia can redesign work so that the workforce stays engaged for longer because it wants to, not because it must. Flexible hours and tax settings can increase the rewards, automation can remove the physical load, and AI can remove the need for deep software retraining.
Indeed, a shift is already underway. The participation rate of Australians aged 65 and over has risen from 6 percent to 16 percent over the past 25 years, moving toward the Japanese rate of 26 percent.94 Over a similar period, “full-health expectancy,” or the age to which people can operate as they always have, has risen two years to 73.95 Australia is well placed to increase productivity, reduce the economic burden on younger generations, and allow individuals to age gracefully and live healthy, longer lives, with more professional meaning and purpose.
4. Australia can remain the resource superpower of the 21st century
Natural resources have underpinned Australian prosperity for more than a century, and the odds are that it will continue to do so. Australia has deep reserves across both its traditional resource base and all six key energy-transition minerals tracked by the IEA: copper, lithium, nickel, cobalt, graphite, and rare earth elements.96 Global demand for those resources is both broadening and deepening. Comparing the next 75 years with the last, the world is expected to consume five times as much copper, nearly seven times as much aluminium, and almost nine times as much nickel. Lithium will run at more than 100 times the level of the past 25 years.97 At the same time, demand remains strong for our traditional exports, such as iron ore, coal, and gas. Australia has proven capacity to tap these reserves at scale, with operational capabilities and institutional strengths far greater than most resource-rich countries.
5. Australia can continue to be the place the world’s most talented people want to live and work
The most important resource in any economy is its people. Australia has ample talent at home and can attract more from around the world. Its cities are among the best in the world to live in, and with reasonable planning, they are likely to remain so. In fact, Australia is the only country on Earth that receives more migrants from the United States than it sends there.98 It has large populations from every continent, helping people feel at home. Nine of its universities are in the world’s top 100, and roughly 60 percent of Australians aged 25 to 34 hold tertiary qualifications. This talent is already proving itself on what might seem to be a shoestring budget. Per dollar of venture capital invested, Australia has produced the third most unicorns in the world and the most decacorns.99 It’s not unreasonable to expect that global talent will continue to come to Australia and that global capital will back it even more.
6. Australia can again reinvent itself in an evolving world
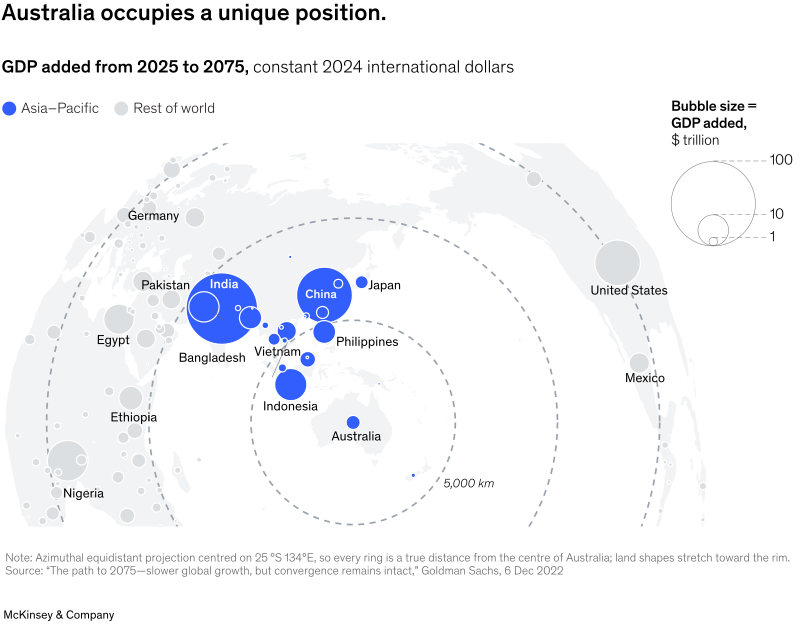
A strong national economy knows its place in the world and how to benefit from it. Australia has always been able to find that place. It has shifted its trade to partner with Britain, then Japan, and then China as each country’s wealth rose, each time adding to its economy rather than upending it. Now, Australia is poised to benefit from another economic boom, one even closer to home. Asia–Pacific is forecast to add nearly half of all global GDP growth this century, overtaking the size of today’s global economy in just 30 years.100 Australia has a front-row seat (Exhibit 12), with a portfolio of things the region will need (energy, minerals, food, education, and professional services) and the connections to deliver it (trade, compatible time zones, stable institutions, and ties built through migration and education). Australia can once again add to what it sells—and to whom.
7. Australia can reclaim its capacity for large-scale, deliberate reform
The first six beliefs would make Australia’s return to growth more likely but not inevitable. Each requires choices about Australia’s people, assets, and relationships with the world. Together, they depend on a return to arguably Australia’s most valuable trait: the willingness to dig deeper and alter course when needed and to work together to do so.
Each of Australia’s past booms followed deliberate reform, and the next one will demand the same. In the 1950s and 1960s, the nation-building deal was migration, protection, and public investment. When the 1990s demanded a new formula, an accord between business and unions laid the foundation for free trade, deregulation, and privatisation.
These deals were shared visions for shared benefit. Not everyone benefitted directly or immediately, and the national strategy was fiercely debated. But all sides were respected; the national media, institutions, and political parties were relatively aligned on the facts and what was needed; and once decisions were made, the country held firm. If Australia is to restore optimism, as it must, it must restore the idea that growth is good, growth is for everyone, and growth is possible.
Choosing another century of plenty
For most of the past 100 years, Australia has been known for its confidence and economic resilience. Its living standards, measured by GDP per capita, remained among the highest in the world. This record was a result of deliberate reform, not luck, and Australia’s exceptionalism has been its willingness to remake its economy every generation.
Now, after a decade of economic stagnation, Australia has temporarily lost that confidence. The capacity to change has stalled, just when a new world order and a new technological era demand that it be strong. To regain that confidence, Australians need to refocus the national conversation on the country’s collective strengths, rather than its emerging divisions.
Those strengths are foundations that few countries can match: a unique mix of stable social, legal, political, and economic institutions; excellent natural endowments, from resources to liveable climates; and a wealth of human and financial capital.
From here, Australia’s to-do list seems clear. It can pave the way for its great firms to compete in the industries of the future. It can continue to be a resource superpower in a world that needs both molecules and electrons to fuel progress. It can harness the potential of new technology to propel productivity and to allow people to work longer and more safely. It can continue to be a magnet for the world’s best minds and to use those minds to get in front of a new global order.
As it has done before.