At a glance
- Around 25 percent of $19 trillion in global imports confront significant vulnerabilities, representing the “Achilles’ heel” of the world economy. This means they face at least two of three vulnerabilities: product criticality; supplier concentration; and geopolitical distance. With around 80 percent of maritime trade passing through a geographic chokepoint, the economic risks compound further.
- Trade dependencies are asymmetric but not one-sided, and no economy is immune to them. For many economies, China supplies 30 to 60 percent of their Achilles’ heel imports, while individual partners typically account for only 5 to 15 percent of China’s. Yet dependence can run the other way at the product level: Australia supplies more than half of China’s iron ore imports.
- Building resilience means responding selectively to dependencies, not eliminating them. Resilience strategies depend on alternative suppliers, domestic production capabilities, and ripple effects on value chains. Our “Six R’s” framework (rearrange, relocate, ramp up, reserve, reduce, and rally) helps identify potential responses for specific products and economies. Rearranging supply may take weeks; ramping up production can take years.
- The Achilles’ heel can also be a map of opportunities for both resilience and growth. As economies and businesses invest in addressing trade dependencies, new markets may emerge for companies offering alternative production capacity, materials and technologies, products designed for greater geopolitical optionality, and solutions that enhance supply chain visibility and resilience.
Around one-quarter of global trade falls into the “Achilles’ heel.”
Note: Figures may not sum to 100 percent because of rounding. Concentration and geopolitical distance are assessed at the economy-product level and then consolidated globally. Product vulnerability is based on majority exposure: If more than 50 percent of imports come from geopolitically distant partners, all imports in that product category are classified as distant.
1Total trade of $19 trillion is the value of global goods imports in 2024, excluding intra-Europe-30 trade, where Europe-30 comprises the 27 member states of the European Union plus Norway, Switzerland, and the United Kingdom.
2Includes rare-earth magnets.

Global trade has withstood a succession of shocks. A global pandemic, geopolitical tensions, and new conflicts have reshaped where and how countries trade but have not fundamentally disrupted how much is traded for many sectors.
Rather than retreating into deglobalization, trade has reconfigured. Flows are traveling greater geographic distances but shorter geopolitical ones, as economies shift toward trade partners with which they are more geopolitically aligned.1 Public and private actors alike have shown agility in absorbing shocks: rerouting shipments; renegotiating sources of supply within weeks of a tariff announcement; or tapping strategic oil reserves in response to the closure of the Strait of Hormuz and other logistics “chokepoints.”
As a result, global trade has remained strong. Global goods trade grew by around 7 percent in nominal terms in 2025, outpacing global gross domestic product growth, and continued to expand in 2026, supported in part by the AI boom and associated demand for technology goods.2
That resilience rests on a deeply interconnected global economy. Trade ties bring significant economic benefits.
But these connections may also create dependencies that are amplified by catalysts like geopolitical conflict. Critical goods and materials may get too expensive when there are tariffs, trade restrictions, or blockades. Economies need to be prepared for the supply of a key input to potentially be shut off.
This research focuses on the approximately one-quarter of global imports that is exposed to two or more compounding vulnerabilities—product criticality, supplier concentration, and geopolitical distance—which we refer to as the “Achilles’ heel” of global trade. A smaller but consequential slice, 4 percent of global imports, faces all three simultaneously, concentrated in strategic goods like semiconductors, permanent magnets, and consumer electronics that can make economies especially vulnerable. Layered on top of this is physical exposure: Roughly 80 percent of maritime trade passes through a chokepoint, and many of these, including the Strait of Hormuz, have no viable seaborne alternative.
The geopolitical realignment of trade underway may just be the start, but it won’t play out everywhere. Much of the reaction from businesses and policymakers could be centered on the one-quarter of global trade examined in this report. The remaining 75 percent, which includes a lot of the products people consume every day, is important, but the adjustments to global conditions may largely play out as they have for decades.
Our analysis finds that short-term responses to disruptions are not always adequate. Tariffs can be absorbed for a while through pricing and rerouting; a chokepoint closure can be buffered by drawing on strategic reserves and using more existing pipeline capacity. But the deeper vulnerabilities—concentrated suppliers, critical inputs with few substitutes, and exposed trade corridors—do not resolve themselves once the immediate shock passes. They can persist, compound across products and regions, and leave economies and companies exposed to a subsequent disruption.
Managing this exposure requires a different kind of response: a deliberate strategy on identifying which vulnerabilities are most material; understanding how they build on one another; and matching them to the tailored mix of interventions. These can range from rearranging supply networks and building domestic capacity to reserving critical stockpiles and shifting capital into domestic manufacturing. Building lasting resilience requires examining a broad tool kit and applying the right lever to the right problem.
This report offers a framework to consider for making that distinction. It addresses three questions:
- Where are the vulnerabilities? Which products, economies, and trade relationships are most exposed to overlapping sources of vulnerabilities, and how do maritime chokepoints amplify them?
- What builds resilience? Which levers are best suited to different vulnerabilities, products, and economies?
- How can decision-makers act? How can businesses and policymakers translate these insights into targeted action?
The objective of this framework is not self-sufficiency. It is targeted resilience: identifying the parts of global trade where disruption warrants greater attention and action, while preserving the benefits of global connections elsewhere.
Identifying the Achilles’ heel
Every economy has an Achilles’ heel. Of the $19 trillion in global imports analyzed for this report, around one-quarter faces at least two of the three vulnerabilities: product criticality, supplier concentration, and geopolitical distance (Exhibit 1). Just ten products account for 35 percent of the global Achilles’ heel. The scale and composition of vulnerabilities vary widely and are most pronounced where these exposures overlap, narrowing the options to mitigate risk.
Why does this matter? Trade risks are a fact of life in the global economy. But they become paramount during times of economic uncertainty, geopolitical risk, and conflict, all three of which are present in the world to varying degrees.
Achilles’ heels are shaped by three factors: how critical a product is to economic activity; how many sources of supply are available; and the degree of geopolitical alignment with trading partners (The analysis in this report measures goods trade. Of course, there are other types of flows that are crucial for economies including services, data, and capital that are outside the scope of this report).3
These exposures reveal asymmetric relationships between countries. China supplies 31 percent of US Achilles’ heel products, compared with just 8 percent in the reverse direction, a nearly fourfold difference. But vulnerability often runs both ways. While China accounts for 60 percent of Australia’s most vulnerable imports, Australia supplies more than half of China’s iron ore imports—one of China’s largest imports exposed to all three dimensions of vulnerability, underscoring the mutual dependence embedded in global trade.
Of course, a country’s position as a key supplier of Achilles’ heel products or sectors doesn’t necessarily mean it would seek to use the position it has for economic leverage, as that carries costs to both sides of a trade relationship.
Trade vulnerabilities can create economic risks
Just 4 percent of global imports face all three sources of vulnerabilities outlined above at once, including China’s iron ore imports from Australia and US rare-earth magnets and smartphones from China.
But exposure to even two could have consequential impacts in the event of a sudden supply disruption, as illustrated by US reliance on a small number of economies, primarily Taiwan for advanced integrated circuits, Japan’s dependence on the Middle East for crude oil, and most economies’ reliance on Vietnam for electronic screens.
Even products that are not essential to economic activity—such as sneakers and toys—can remain highly exposed to supply disruption. Their disruption may not threaten essential economic functions but can still translate into shortages, higher prices, and adjustment costs for firms and consumers. All told, 23 percent of imports sit at the Achilles’ heel of global trade, making these vulnerabilities difficult for economies to ignore.
These exposures have steadily intensified over the past two decades, where imports that face two or more vulnerabilities rose from 15 percent in 2000 to 23 percent in 2024, suggesting structural shifts entrenched within the global trading system. This increase reflects a shift toward more critical trade, rising from 30 to 44 percent, led by electronics, where concentrated supply and geopolitical distance have especially increased exposure between China and Western economies.
Ten products make up one-third of global import vulnerabilities
More than 60 percent of the Achilles’ heel falls within three key sectors: electronics; basic manufacturing; and metals and minerals. Largely within these sectors, ten products account for roughly one-third of the global Achilles’ heel (Exhibit 2).
10 products account for 35 percent of global trade vulnerabilities.
Note: Achilles’ heel refers to imports that are exposed to at least 2 of the 3 trade vulnerabilities: product criticality, supplier concentration, and geopolitical distance of trading partners. Basic manufacturing includes sectors such as textiles, rubber and plastics, wood and paper, and food and beverages.
1Refers to computer hardware that handles data processing (ie, server racks), but does not include a built-in screen, keyboard, or mouse.
Crude oil accounts for the largest single product exposure at 7 percent, but the electronics sector remains the primary locus of vulnerability. Just five electronics products, including smartphones (7 percent), memory chips (5 percent), and laptops (4 percent), combine for about 20 percent of the global Achilles’ heel. Iron ore is another at 4 percent, constrained by a highly concentrated supply base in Australia and Brazil.
The rapid expansion of AI could further amplify these vulnerabilities. Growing demand for AI infrastructure is increasing the strategic importance of advanced semiconductors, high-bandwidth memory, and other specialized components whose production is concentrated in a handful of economies. As AI adoption scales, existing supply concentration could become more consequential, while new dependencies emerge across computing infrastructure, energy, and critical materials.
Each economy has vulnerabilities, with Asian hubs, the United States, and Europe-30 economies having the largest
Larger economies are disproportionately exposed to all three sources of trade vulnerability, but their drivers are structurally different (Exhibit 3). While Asian industrial hubs (China, Japan, and South Korea) face vulnerabilities driven by their deep interdependence in electronics networks and inputs, the United States and Europe-30 are also exposed because of their reliance on a few, sometimes distant, Asian suppliers, especially for final electronic products.
Asian economies, the US, and EU face the largest relative exposures.
Note: Column width represents total imports.
1Trade vulnerabilities include product criticality, supplier concentration, and geopolitical distance of trading partners.
2Europe-30 includes the 27 member states of the European Union plus Norway, Switzerland, and the United Kingdom, excluding intra-Europe trade.
Economies such as those in the Association of Southeast Asian Nations (ASEAN), the Middle East, and Latin America tend to rely less on geopolitically distant partners, reflecting their position on the geopolitical spectrum.
(For more detail on the geopolitical spectrum, see sidebar “Quantifying geopolitical distance.”)
Quantifying geopolitical distance
To quantify geopolitical alignment in a way analogous to geographic distance, prior MGI research developed a measure based on UN General Assembly voting records from 2005 to 2022 (exhibit). Using principal component analysis, we map each voting economy onto a one-dimensional spectrum scaled from zero to ten. This spectrum is not defined relative to any single country or pair of economies. The geopolitical distance between two economies is the absolute difference between their positions on this scale. We treat this distance as fixed over the period analyzed; accordingly, changes in the geopolitical distance of trade reflect shifts in the mix of trading partners, not changes in the underlying distance between any specific pair.
Economies hold different geopolitical positions.
1Calculated by principal component analysis of UNGA voting records in 2005–22, reduced to a 0–10 scale. To exclude procedural votes, a subset of UNGA votes are considered. For 2005–21, these exclude votes not designated as “important” in “Voting practices in the United Nations,” US Department of State. For 2022, votes addressing the war in Ukraine are included.
Source: “Geopolitics and the geometry of global trade”, McKinsey Global Institute, 2024; McKinsey Global Institute analysis
McKinsey & Company
This helps explain the wide variation in Achilles’ heels across these economies. Vietnam stands out, with around 30 percent of its imports being its Achilles’ heel, especially due to concentrated imports of electronics components from China and South Korea. Conversely, exposure in India, Malaysia, and the United Arab Emirates is below the global average.
From soybeans to chips: Criticality, concentration, and geopolitics shape exposures
The three sources of trade vulnerabilities reflect distinct shifts in how global trade is structured. We explore these drivers and differences across economies and sectors in turn.
Criticality: Most economies rely on imported commodities and electronics
While all economies rely on a similar set of critical products, how much of those are imported is largely determined by an economy’s core engine.4
China and other Asian economies including Vietnam and South Korea exhibit above-average exposure, with half or more of their imports being critical, due to their need for imported energy, raw commodities such as copper and aluminum as well as intermediate machinery to power their manufacturing capacity. (Exhibit 4). In contrast, the United States and Europe-30 face lower exposure (at around 40 percent), reflecting less reliance on imported upstream inputs, even while remaining reliant on finished critical products such as smartphones and laptops.
Energy, AI-related goods, and other electronics make up most critical imports.
Note: Pharmaceutical products include medical and scientific instruments. Others include sectors such as agriculture, food and beverages, textiles, transport equipment, wood and paper, and rubber and plastics. Global average is the weighted average of critical imports across total import value.
1AI-related goods include semiconductors, graphic cards, routers, and servers, which can also be used for non-AI applications.
Source: UN Comtrade; US Draft List of Critical Supply Chains (2022); McKinsey Global Institute analysis
McKinsey & Company
The relative sectoral exposure of each economy is shaped by its economic structure. For example, Brazil and Indonesia experience elevated exposure primarily from imports of fertilizers and industrial chemicals needed to sustain their agricultural industries.
Concentration: Specialization and endowments can lead to many electronics and commodities having few sources of supply
Trade concentration can reflect unique endowments, comparative advantages, or choices to maximize efficiency. Nonetheless, concentration can also be a source of vulnerability.
In some cases, concentration is a choice; while there are many available suppliers, economies tend to prioritize only a few, resulting in trade that is “locally concentrated.”5 This is often the case of smaller nations in integrated regional ecosystems that trade with their larger neighbors, such as US–Mexico–Canada. While there are many suppliers in the world, Mexico imports essentially 98 percent of its refined petroleum fuels from the United States.
But many products offer limited alternatives at a global level, especially when there are three or fewer economies accounting for more than 90 percent of global exports. We describe trade in those products as “globally concentrated.” Limited diversification options make these products difficult to replace in the event of disruption. Examples include soybeans with supply concentrated in Brazil and the United States, or palm oil from Indonesia and Malaysia.
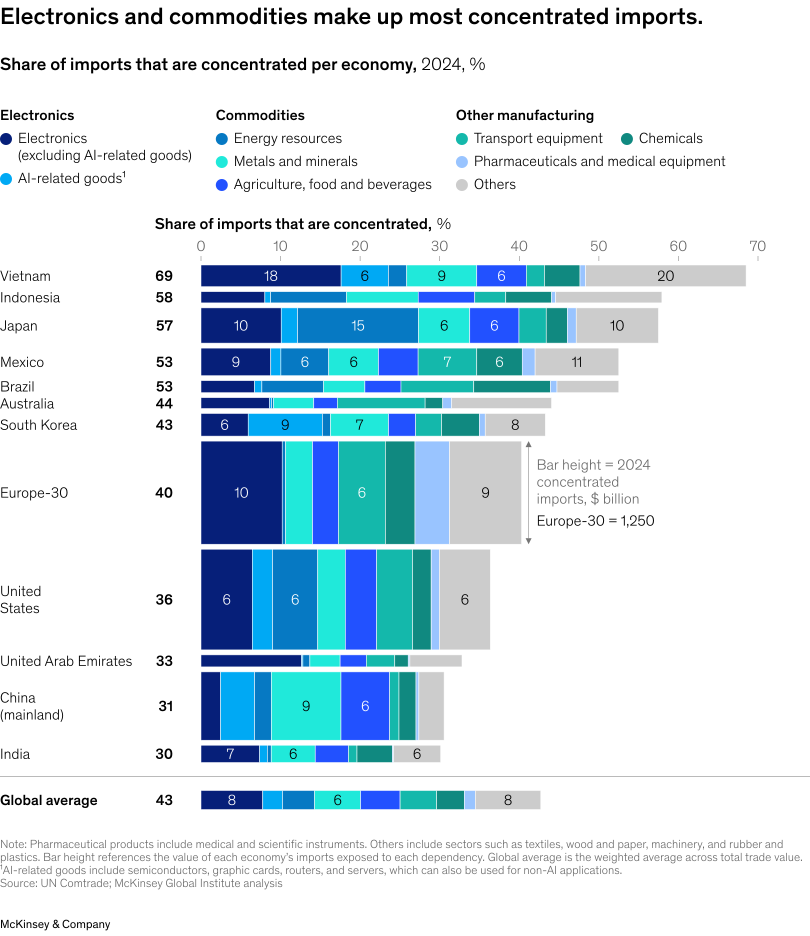
Most prominent are electronics, where production of critical components and finished goods is highly specialized, from advanced semiconductors and lithium-ion batteries to smartphones and laptops. Often each step is done primarily by one or two economies, often in China and the broader Asia–Pacific region. For example, more than 70 percent of the global supply of advanced integrated chips originates from Taiwan. Economies such as Japan and South Korea also play an integral role in advanced semiconductor substrates and high-bandwidth memory chip production globally (Exhibit 5).
Supplier concentration is another trade vulnerability making up the Achilles’ heel. Its share of total imports ranges between 30 and 40 percent for the world’s three biggest economies and is even larger in some other economies, driven by electronics.
For many economies, concentrated imports come from China and other Asian economies, reflecting the importance of the electronics sector. For the United States, concentration is more prevalent with its trading partners in North America.
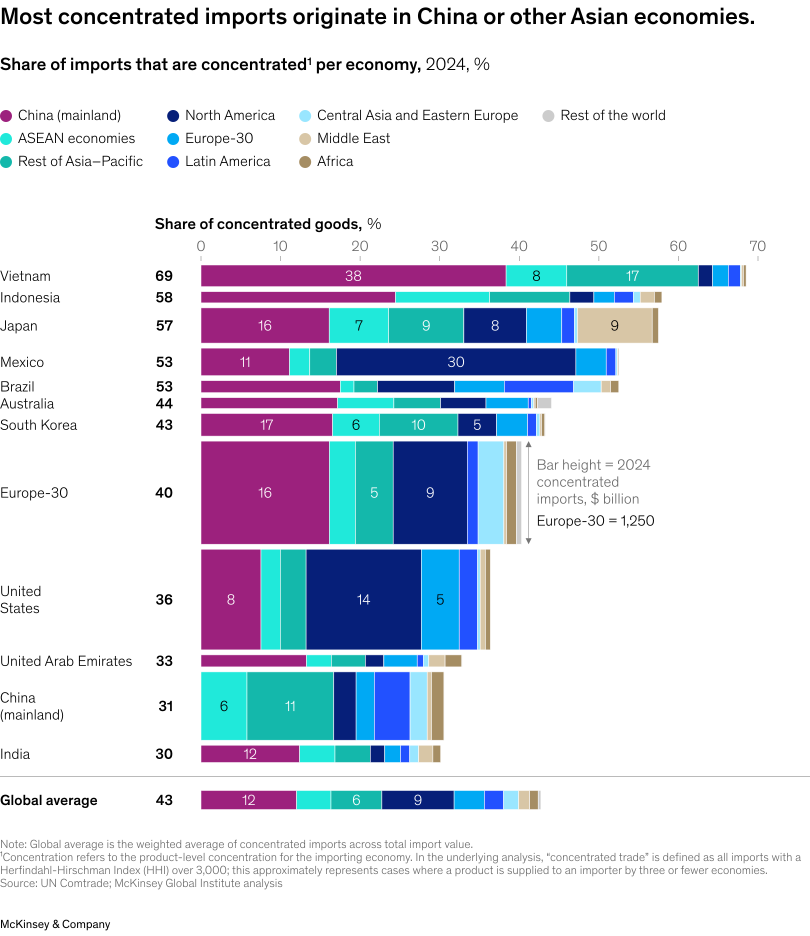
Geopolitically distant trade is driven mostly by China either as a source or as a destination
For advanced economies, exposure to geopolitical distance is often driven by imports of Chinese electronics (Exhibit 6). However, it flows in both directions. China’s exposure stems from reliance on geopolitically distant partners for raw materials and advanced capital goods, notably Australian iron ore and semiconductor manufacturing equipment from Japan and the Netherlands.6
Most geopolitically distant trade starts or ends with China.
Note: Global average is the weighted average of distant imports across total import value. Trade flows with a value-weighted average distance above 7 are flagged as “geopolitically distant” because they represent interactions between economies positioned at opposite ends of this UN voting spectrum. Economies that have no distant partners sit in the middle of the UN voting spectrum, where all partners are not geopolitically distant.
Source: UN Comtrade; McKinsey Global Institute analysis
McKinsey & Company
Economies across ASEAN, the Middle East, and Africa occupy a middle ground, allowing them to maintain trade relationships across the geopolitical spectrum.7
Trade dependencies can be asymmetric but not one-sided
Dependence does not run equally in both directions. For many economies, China supplies 30 to 60 percent of their Achilles’ heel imports, while individual partners typically account for only 5 to 15 percent of China’s. This reflects its broad role as a supplier across value chains. For instance, the United States sources the majority of its vulnerable imports across a wide range of products from China, from rare-earth magnets to laptops, game consoles, ovens, Christmas decorations, and industrial chemicals.
Comparatively, while China has its own “Achilles’ heel,” it tends not to rely on any single economy for much of it (Exhibit 7).
Trade relationships are asymmetric.
1Achilles’ heel refers to imports that are exposed to at least 2 of the 3 trade vulnerabilities: product criticality, supplier concentration, and geopolitical distance of trading partners.
2Europe-30 includes the 27 member states of the European Union plus Norway, Switzerland, and the United Kingdom, excluding intra-Europe trade.
But aggregate asymmetries can mask important dependencies in the other direction where individual products depend on one another. The China–Australia relationship illustrates this interdependence: China supplies more than half of Australia’s Achilles’ heel products, while relying heavily on Australia for key commodities, most notably iron ore, as well as agricultural products such as live cattle, oats, and nuts. Europe-30 economies depend on China for 53 percent of their Achilles’ heel, while China in turn relies on Europe-30 economies for more than half its imports of retail medication and vaccines.
This creates a more nuanced picture than bilateral trade balances suggest. A relationship can be highly asymmetric overall while containing individual products for which dependence runs strongly in the opposite direction. An economy that appears less dependent overall can still have specific Achilles’ heels tied to the same trading partner.
Export dependencies matter, too
This report focuses on imports. But end-market concentration also creates dependencies for exporting economies. Systemic vulnerability is generally lower as most maintain diversified export mixes. However, asymmetric dependencies emerge at the product and regional levels, creating potential “export” Achilles’ heels (exhibit).
These asymmetries become more distinct at a product level. For instance, Germany, South Korea, and the United States import 75 to 85 percent of their metal permanent magnets from China, while China sends 38 percent of its magnet exports to those three markets. Mutual reliance is evident in agriculture, where China sources 69 percent of its soybeans from Brazil, while China accounts for 73 percent of Brazil’s total soybean exports, leaving Brazil highly exposed to any shifts in Chinese demand.
Regional integration creates sharper asymmetries. Canada and Mexico send 75 to 80 percent of their total exports to the United States, yet, combined, they represent around one-third of total US export demand. Sector-level concentration is even more pronounced: Canada exports 96 percent of its crude oil to the United States (constituting 59 percent of US imports), while Mexico sends 94 percent of its data processing units to the United States (67 percent of US imports). As partners prioritize resilience, these highly concentrated export corridors highlight critical vulnerabilities for export-oriented economies.
As trading partners increasingly prioritize supply chain resilience, export-oriented economies could also assess whether heavy reliance on a few key markets creates long-term demand risks and look to actively consider strategies such as diversifying their export destinations.
Export dependencies can also be asymmetric.
1Europe-30 includes the 27 member states of the European Union plus Norway, Switzerland, and the United Kingdom, excluding intra-Europe trade.
This makes the product level crucial for understanding—and ultimately building—resilience. Economy-level exposure reveals where broad dependencies lie, but product-level analysis reveals vulnerabilities that aggregate figures can obscure. As chapter 3 explores, it can also help determine which resilience responses are most appropriate. While our analysis focuses on import vulnerabilities, dependencies can also arise on the export side, particularly when economies rely heavily on a few markets for their products (see sidebar “Export dependencies matter, too”).
The Achilles’ heel captures what and whom economies depend on. But vulnerability also depends on how goods physically reach them. The next chapter adds this geographic dimension, examining how maritime chokepoints can amplify existing vulnerabilities—and create distinct risks of their own.
Physical chokepoints amplify the Achilles’ heel
Chokepoints are a distinct amplifier of trade risk.8 There are many kinds: geographic infrastructure; natural resources and commodities; trade networks and logistics; financial; technological; and regulatory.9 The focus of this report is on the maritime variety, because the vast majority of trade is seaborne, and the 2026 Strait of Hormuz crisis highlighted how widespread the impact of its disruption can be.
Most seaborne trade passes through at least one of the 24 major passages examined in this report. Disruption at these narrow corridors can delay or interrupt trade, raise freight and insurance costs, and propagate through supply chains far beyond the passage itself. Where chokepoint exposure overlaps with an existing Achilles’ heel, the consequences can compound.
The instinct to control these passages goes back centuries. Chokepoints were a major pillar of Portugal’s strategy in the early 1500s under Afonso de Albuquerque—as evidenced by the seizure of the straits of Hormuz and Malacca and the attempt on Aden, the gateway to what is today the Bab el-Mandeb Strait. The logic was that control of these passages equated to control of the flow of spices from Asia to Europe without needing to hold territory in between.10 This isn’t just a history lesson. All three appear in our map of 24 key chokepoints today.
Most maritime trade crosses a chokepoint
Eighty percent of seaborne trade transits at least one of these passages, but this trade is unevenly distributed across oceans, converging along optimal routes determined by where distances are shortest and historical patterns of commerce have concentrated infrastructure. As a result, a handful of straits and canals handle volumes far beyond their geographic footprint, and many major shipping lanes pass through several chokepoints in sequence (Exhibit 8).
Around 80 percent of all seaborne trade transits maritime chokepoints.
Note: The list of maritime chokepoints is based on IMF PortWatch, with the exclusion of Kerch, Bering, Balabac, and Mindoro straits due to their smaller volumes. Danish Straits is an accepted naming convention used by the UN General Assembly and refers to the entire gateway of chokepoints between the Baltic and North seas, including Oresund. UN Comtrade total trade (mode-agnostic) values are overlaid with World Trade Service data on the seaborne share by sector to yield by-sector seaborne trade values. Routing logic is then applied to determine the ports involved in each trade flow and consequently which chokepoint is relevant for which flows and values.
1The classification of the feasibility of rerouting through alternative maritime routes is based on Verschuur et al., “Systemic impacts of disruptions at maritime chokepoints” (2025).
Four of these chokepoints—the Strait of Hormuz as well as the Bosporus Strait, the Bohai Strait, and the Danish Straits—have no viable seaborne alternative.11 Each carries a distinct sectoral signature. Additionally, an economy’s exposure is driven as much by its partners’ geography as by its own; for example, though South Korea sits in open water, it still sees higher-than-average exposure.12
The long way home is not always an option
Chokepoint disruption generates two main types of economic damage. The first is immediate, lost route capacity showing up as delays, rerouting costs, higher freight and insurance premiums, or outright trade interruptions. The second follows as those disruptions propagate through supply chains and commodity markets, reaching producers and consumers far from the chokepoint itself. For example, the closure of Hormuz led to the price of urea jumping by as much as 80 percent in 2026, disproportionately affecting sub-Saharan African countries and major agricultural economies like Bangladesh, India, Indonesia, and Thailand.13 What determines the severity of both is largely a function of whether disruption can be rerouted, and at what cost.
Of the 24 passages we study, 14 are readily reroutable (as shown on Exhibit 8) and include the Korea Strait, Malacca Strait, and Dover Strait. Even at this tier, rerouting still incurs costs and delays, and a single geopolitical event may disrupt multiple straits that would have otherwise been the other’s alternative route.
An additional six passages require longer, more costly diversions. The 2021 Suez blockage, for example, held up an estimated $10 billion in trade per day, and Red Sea/Bab el-Mandeb disruptions since late 2023 forced widespread rerouting—adding roughly two weeks to many Asia–Europe lanes.14 The 2023–24 El Niño drought cut Panama Canal daily transits by roughly one-third and led to the Panama Canal Authority initially projecting a $600 million to $800 million decline in revenue.15 This event also underscored that chokepoint disruption is not limited to conflict or geopolitical upheaval—it could also be due to other causes such as environmental and major climate events.
The most severe exposure belongs to the four passages that have no viable maritime alternative at all: the Strait of Hormuz, the Bosporus Strait, the Bohai Strait, and the Danish Straits.16 If one of these is pinched, both the first-order shock and its downstream ripples are felt more keenly, with little to no routing workaround to absorb them.
The impact can also depend on what flows through each chokepoint, and each has a unique fingerprint. Hormuz and Bosporus are energy-heavy, while Bohai is concentrated in metals and minerals, requiring different resilience responses (Exhibit 9).
Non-reroutable chokepoints in aggregate have high energy exposure, but each chokepoint profile is unique.
Note: The classification of the feasibility of rerouting through alternative maritime routes is based on Verschuur et al., “Systemic impacts of disruptions at maritime chokepoints” (2025). Total values for “All trade transiting at least one chokepoint” and “All trade transiting at least one non-reroutable chokepoint” are de-duplicated (trade flows transiting multiple chokepoints are not double counted) and will therefore not match, eg, the sum of individual values attributed to each chokepoint in Exhibit 8.
1Others include sectors such as agriculture, food and beverages, textiles, wood and paper, and rubber and plastics.
Source: Container Trades Statistics; IMF PortWatch; S&P Global Trade Analytics Suite; UN Comtrade; Verschuur et al., “Ports’ criticality in international trade and global supply-chains” (2022); McKinsey Global Institute analysis
McKinsey & Company
The 2026 Hormuz disruptions illustrate what this looks like in practice. Conflict-driven closures brought ship transits down by as much as 95 percent from pre-conflict baselines—a significant shock for a strait that carries roughly 20 percent of global oil trade, and a similar share of liquefied natural gas.17 With no viable seaborne alternative, the only workaround was overland: existing pipeline bypass capacity. But this could address a small fraction of normal Hormuz flows; additional measures underway or in discussion could potentially offset 35 to 70 percent by 2030.18 Pipelines, however, can carry their own risks—both as physical infrastructure vulnerable to disruption and as capital investments that could themselves become stranded if maritime trade through the strait eventually resumes.
Two maps matter: Yours and your partner’s
An economy does not need to sit behind a chokepoint to depend on one. Exposure reflects both the routes into an economy and the routes out of its suppliers. This explains why South Korea, for example, has relatively easy navigation lanes into its own ports and yet sees relatively higher exposure to non-reroutable passages. In this case, it is the export geography of its partners, not its own bottlenecks, which drives exposure (Exhibit 10). Based on this dynamic, we find three main takeaways.
Chokepoint exposure depends on an economy’s own geography and that of its trade partners.
Note: The boundaries and names shown on this map do not imply official endorsement or acceptance by McKinsey & Company.
1The thresholds reflect the global weighted-average exposure to external, non-reroutable chokepoints of 16 percent, with a higher threshold of 40 percent capturing economies geographically constrained by a non-reroutable strait outside their control.
Source: Container Trades Statistics; IMF PortWatch; S&P Global Trade Analytics Suite; UN Comtrade; Verschuur et al., “Ports’ criticality in international trade and global supply-chains” (2022); McKinsey Global Institute analysis
McKinsey & Company
- Geography can create unavoidable exposure. Some of the most exposed economies are in the Middle East and Eastern Europe, where trade must pass through non-reroutable chokepoints. The United Arab Emirates, for example, has 78 percent of its seaborne imports exposed, while Ukraine is at 84 percent. Eastern Europe faces two layers of exposure, with significant trade volumes transiting both the Danish and Bosporus straits.
- Geography can also provide a natural buffer. At the other end of the spectrum, only 4 percent of US seaborne imports transit externally administered, non-reroutable chokepoints, reflecting the United States’ geographic position and domestic energy production. For such countries with lower-than-average exposure to these chokepoints, supply chain vulnerability tends to be concentrated in product risk rather than routing risk. That said, even this group is not immune to them once they are disrupted. Asian countries, for example, have been heavily impacted by the Strait of Hormuz disruption and experienced fuel price hikes, work-from-home mandates, and declarations of national emergencies.19
- Trading partners can transmit chokepoint exposure across borders. An economy does not need to be located near a non-reroutable passage to depend on one. India, for example, relies heavily on Persian Gulf economies for energy resources through its suppliers.
The origins of chokepoint exposure can also shape how to mitigate it. When exposure is inherited through trading partners, economies may have room to diversify suppliers or work with partners to develop alternative routes. Japan, for example, has sought to diversify energy sourcing away from the Gulf and explore routes that bypass the Strait of Hormuz.20 When exposure is dictated by an economy’s own geography, options are more constrained.
Chokepoints can amplify Achilles’ heels—and create vulnerabilities of their own
Chokepoints are not correlated with the baseline trade vulnerabilities explored in the previous chapter but are instead a distinct amplifier of them. Most economies may therefore treat supply chain resilience (addressing the Achilles’ heel) and physical routing resilience (addressing chokepoints) as distinct issues.
The United States combines average exposure to overlapping trade vulnerabilities with low exposure to non-reroutable chokepoints, making its Achilles’ heel the more prominent source of risk. For economies in similar positions, the resilience agenda is primarily one of supplier diversification and import substitution. Thus reducing concentration in critical inputs, rather than rerouting trade, becomes the priority.
Certain economies in the Middle East and Asia, such as India, Saudi Arabia, and Thailand, see the reverse: relatively modest exposure to sources of trade vulnerabilities at a product level but high exposure to non-reroutable passages, especially in energy flows, making physical routing a more prominent concern.
South Korea and Japan confront meaningful exposure on both dimensions, as vulnerabilities in their supply networks are compounded by chokepoints inherited through their trading partners. Certain pharmaceutical products like vaccines, cultures, and insulin-related medicaments, for example, are all Achilles’ heels (critical and concentrated) for Japan. Much of these come from Europe, and while air freight tends to be the preferred method of transportation for many pharmaceutical products, any that take maritime routes may necessarily transit the Suez Canal, the Bab el-Mandeb Strait, or both. Canada has lower-than-average exposure on both dimensions (Exhibit 11).
Achilles’ heel and chokepoint risk may be addressed independently.
Note: Chokepoint exposure refers to the percentage of that economy’s total imports that passes through at least one maritime chokepoint, regardless of reroutability. Achilles’ heel refers to imports that are exposed to at least 2 of the 3 trade vulnerabilities: product criticality, supplier concentration, and geopolitical distance of trading partners. Europe-30 includes the 27 member states of the European Union plus Norway, Switzerland, and the United Kingdom, excluding intra-Europe trade.
Source: Container Trades Statistics; IMF PortWatch; S&P Global Trade Analytics Suite; UN Comtrade; Verschuur et al., “Ports’ criticality in international trade and global supply-chains” (2022); McKinsey Global Institute analysis
McKinsey & Company
Achilles’ heel and chokepoint risks are often independent
Resilience is ultimately about both what economies depend on and how those goods reach them. Addressing an Achilles’ heel does not necessarily secure the route, just as securing the route does not resolve the underlying exposure to trade vulnerabilities (see sidebar “Air transportation”). The next chapter turns from diagnosis to action, examining how different vulnerabilities call for different resilience responses.
How Six R’s could spell resilience
There is no single fix for an Achilles’ heel. It depends on the product, the capabilities of the economy, and the consequences if supply is disrupted. Some vulnerabilities can be addressed by rearranging supply from existing producers or relocating to add new sources; others require ramping up new capacity, holding reserves, reducing demand, or rallying other partners. We use three questions to diagnose these vulnerabilities and a “Six R’s” framework to identify a potential response.
But resilience doesn’t stop at the end-product level. Vulnerabilities can sit deep upstream and propagate across value chains, meaning that securing a final product may simply shift the dependency elsewhere.
No single solution—each vulnerability demands a different response
Economies have multiple levers to address trade vulnerabilities, but their effectiveness varies by product. To determine the optimal path, our analysis maps each product’s resilience footprint against three guiding questions for each economy.
- Can alternative supply be secured? Some products are produced by only a few economies, leaving few viable alternatives. China makes up roughly 65 to 75 percent of the global exports of smartphones, laptops, and permanent magnets. Conversely, while the United States sources 72 percent of its refined copper cathode imports from Chile and 15 percent from Canada, the global supply is relatively diversified with alternative suppliers in Japan and Australia. In these cases, economies can rearrange trading partners with available suppliers. We measure this using the concentration of global exports at the product level, as discussed in chapter 1.21
- Can domestic supply be built? Whether a product can be manufactured domestically depends on factors like infrastructure, ecosystem, and talent. Proximity to the existing manufacturing base eases scaling of certain products. China, for example, leveraged expertise in consumer electronics like lithium-ion batteries to scale electric vehicle battery production. Economies may try to leapfrog into lower-proximity sectors. Developing new, unfamiliar capacities entails high costs, long timelines, and execution risks. For example, South Korea paired patient state capital for its nascent chip industry in the 1980s and 1990s, enabling it to cement its position as a global leader in semiconductors.22 We measure the fit with existing domestic capabilities based on how closely a product is related to what an economy already produces.23
- How disruptive would a supply interruption be downstream? Disruptions to inputs that everyone depends on, like industrial chemicals or semiconductors, may cause large shocks across the manufacturing ecosystem. Consequently, building resilience for these critical inputs is often more urgent than for final goods with isolated linkages. We measure this by estimating how much downstream trade relies on each product as an input.24
The six levers that could provide a menu for resilience
Economies could draw on six broad resilience levers—the Six R’s—to address different types of trade vulnerability: rearrange; relocate; ramp up; reserve; reduce; and rally. The appropriate mix depends on the vulnerability, the product, and the economy.25
- Rearrange: Economies may diversify supply or reroute to avoid maritime chokepoints by working with existing suppliers. Japan has started diversification efforts to reduce reliance on Middle Eastern producers by securing long-term contracts with the United States, as well as exploring pipeline expansion projects that bypass the Strait of Hormuz.26
- Relocate: Companies may create new sources of supply, often requiring investment in new capacity. Apple has expanded its manufacturing footprint toward India and Vietnam as part of a broader diversification of its production base away from China.27
- Ramp up: This involves expanding domestic production. The United States has supported its semiconductor manufacturing through state investment, tax incentives, and R&D support.28
- Reserve: Strategic inventories can act as short-term shock absorbers. The United States maintains the Strategic Petroleum Reserve, while Japan, through the Japan Organization for Metals and Energy Security, stockpiles critical minerals, including rare metals.29
- Reduce: This addresses sudden supply shocks. In the short term, demand can be curbed through measures like rationing or remote work to limit energy consumption. Long-term demand may be reduced by substituting materials, redesigning products to use less of these imports, or adopting alternative technologies to decrease usage, such as deploying low-emissions technologies to lessen reliance on crude oil and petroleum imports.30
- Rally: This involves collaborating with allies to overcome vulnerabilities that can’t be solved alone. For example, the Minerals Security Partnership brings together 14 countries and the European Union to develop more diverse and sustainable supply chains for critical energy minerals through coordination of governments, financial institutions, and the private sector.31
The optimal mix varies product by product
Each economy-product pair has a distinct resilience map, reflecting its vulnerabilities and manufacturing base (Exhibit 12). The appropriate mix depends on economic scale and capabilities, with larger and more advanced economies generally having greater scope to build domestic capacity while smaller economies typically rely more on international diversification and partnerships.32
Resilience requires product- and economy-specific strategies.
Read outward. Each corner runs from 0 to 100, with 100 leaning toward “no” on each of the three questions—fewer alternative suppliers, a wider capability gap, greater downstream impact.
Some levers move in opposite directions:
Rearrange vs Rally: Trade cannot be rearranged when alternative suppliers are scarce, but economies can rally others to develop new supply.
Ramp up vs Relocate: A wide capability gap makes ramping up difficult, favoring relocation. Where ramping up is feasible, relocation can still offer a more competitive option.
Materiality of levers. Shading indicates whether implementation feasibility or importance is high or low, based on the assessed variables.
1Supplier scarcity (global concentration in the methodology): Herfindahl-Hirschman Index of global exporter shares, converted to a percentile rank. A higher percentile means supply is held by fewer exporters.
2Capability gap (capability adjacency in the methodology): based on Harvard Growth Lab’s Distance indicator, converted to a percentile rank. A higher percentile means the product sits further from the capabilities the economy already has.
3Ripple effect (trade adjacency impact in the methodology): trade value of downstream products that use the focal product as an input, converted to a percentile rank. A higher percentile means a disruption cascades further downstream.
Putting it all together, each economy–product pair calls for a different mix of resilience levers. Some vulnerabilities can be addressed relatively quickly by rearranging supply among existing suppliers or drawing on reserves, while relocating production or ramping up domestic capacity can take years. Where vulnerabilities are harder to resolve, reducing demand or rallying partners may also be needed. Resilience strategies therefore often require a portfolio of these Six R’s, combining near-term buffers with longer-term changes to supply, capacity, and demand.
Resilience requires looking beyond individual products
Resilience cannot be assessed at the final product stage alone. A shift in final assembly may reduce one dependency while leaving vulnerabilities embedded several layers upstream. Mapping the full value chain can reveal where criticality, supplier concentration, and geopolitical distance persist beneath the final product to determine a suitable portfolio of “Six R’s” for each product supply chain.
Identifying vulnerable nodes is the first step. For smartphones, 38 percent of their tier-one and tier-two upstream inputs are exposed to two or more sources of trade vulnerabilities, including lithium-ion batteries, rare earths, and processor and controller chips (Exhibit 13).33
Resilience requires a whole of supply-chain view—smartphones are vulnerable, but so are their components.
US smartphone case study, imports by product, 2024, $ billion
Note: Values are total US imports of each product across all end uses, not the share consumed by smartphones. Tier-1 inputs are directly linked to smartphone production in the production network, while tier-2 inputs are linked indirectly through tier-1 inputs. Tier-2 products are shown as a count, not by value, which the source does not record for them; 11 of the 871 are not classified by dependency and are shown in the lightest gray. The outer band is ordered by dependency rather than grouped by product family, because 479 of the 871 tier-2 products feed more than one family; hover over a product to see its own.
Source: AI-Generated Production Network; UN Comtrade; US Draft List of Critical Supply Chains (2022); McKinsey Global Institute analysis
McKinsey & Company
Applying these considerations at the product level, coupled with product-specific analysis maps, points to very different combinations of resilience levers even within the same value chain.
Smartphones illustrate this challenge. Although rewiring downstream assembly from China to India may lower exposure of the United States to geopolitically distant trade, this does not necessarily protect the value chain. Advanced chips—where global supply is concentrated, domestic capacity is difficult to build, and disruption can propagate widely—warrant a broader mix of interventions, including ramping up, reserving, and reducing (Exhibit 14). Permanent magnets exhibit a similar resilience map, hence calling for a comparable portfolio of interventions to advanced chips.
Each economy-product combination has tailored resilience levers.
1Supplier scarcity (global concentration in the methodology): Herfindahl-Hirschman Index of global exporter shares, converted to a percentile rank. A higher percentile means supply is held by fewer exporters.
2Capability gap (capability adjacency in the methodology): based on Harvard Growth Lab’s Distance indicator, converted to a percentile rank. A higher percentile means the product sits further from the capabilities the economy already has.
3Ripple effect (trade adjacency impact in the methodology): trade value of downstream products that use the focal product as an input, converted to a percentile rank. A higher percentile means a disruption cascades further downstream.
On the other hand, while high-purity silicon also carries significant downstream impact, global supply is relatively diversified, with the United States among the top three global suppliers. This gives the United States greater flexibility to rearrange trade toward alternative suppliers, while also drawing on its own domestic production.
There is no universal recipe for resilience. The right mix of Six R’s depends on the product, the economy, and where vulnerabilities sit across the value chain. The next step is for businesses and policymakers to turn that diagnosis into action.
Acting on the Achilles’ heel: Agenda for decision-makers
Resilience does not mean eliminating points of vulnerability or pursuing self-sufficiency.34 Dependencies are inherent in an interconnected global economy, and global connections often bring significant economic benefits. The challenge is to distinguish those that create material vulnerabilities and respond in ways that preserve the benefits of global integration.
This would require action from both businesses and policymakers. Businesses can translate vulnerabilities into sourcing, production, investment, and operating decisions. Policymakers can create conditions for businesses to act, intervene where markets fall short, and work with partners where vulnerabilities cannot be addressed alone.
Businesses can translate vulnerabilities into targeted action
Translating vulnerabilities into action requires an understanding of how risk plays out in practice. The same product may carry different risks depending on where it is sourced and produced, what markets it serves, and which physical routes connect them. Mapping these exposures at a granular level could help companies translate economy-level vulnerabilities into targeted sourcing, inventory, production, investment, and product decisions. Of course, not every exposure requires the same degree of intervention. Our analysis helps frame the potential losses associated with potential disruptions to trade against the costs of investing in various resilience measures. Decision-makers can assess plausible disruption scenarios, their likelihood, and potential economic impact, alongside the costs and effectiveness of alternative responses.
Look beyond your sector to find hidden vulnerabilities
No business is an island. Companies depend on inputs from across sectors, meaning vulnerabilities in one can quickly create risks in others. Yet those vulnerabilities vary sharply across sectors. Electronics carries the largest Achilles’ heel, with 43 percent of imports facing two or more trade vulnerabilities, while commodities are more exposed to physical chokepoints. Nearly 30 percent of energy imports and 11 percent of metals and minerals rely on maritime routes that cannot be easily rerouted (Exhibit 15).
Sector exposure to trade dependencies and chokepoints can diverge.
Note: Chokepoint exposure refers to the percentage of that economy’s total imports that passes through at least one maritime chokepoint, regardless of reroutability. Dependencies refer to the following: product criticality, supplier concentration, and geopolitical distance of trading partners.
1Any non-reroutable chokepoint that is not domestically administered, eg, Bohai Strait for China, Danish Straits for Europe-30.
2Includes domestically administered non-reroutable chokepoints where relevant.
Source: Container Trades Statistics; IMF PortWatch; S&P Global Trade Analytics Suite; UN Comtrade; Verschuur et al., “Ports’ criticality in international trade and global supply-chains” (2022); World Trade Service; McKinsey Global Institute analysis
McKinsey & Company
These differences matter because sectors are deeply interconnected. Electronics, for example, are deeply embedded in machinery, automotive, and energy infrastructure, meaning disruption to the supply of concentrated semiconductors or components can propagate well beyond the sector itself.35 Conversely, electronics production depends on energy, metals and minerals, and chemicals—sectors with very different exposure to chokepoints. Blockades in one place may cascade rapidly across other industries, as demonstrated in the recent Strait of Hormuz disruption, which saw knock-on effects extending to fertilizers and agriculture.36
For businesses, this means looking beyond their own sector and direct suppliers. They could map crucial dependencies further upstream, identify where those dependencies overlap with trade or chokepoint vulnerabilities, and monitor emerging disruptions that could affect them. This broader view can help inform sourcing, inventory, production, and investment decisions before vulnerabilities turn into operational disruptions.
Tailor the Six R’s to your global footprint
Companies inherit vulnerabilities from the sectors they depend on. But their actual exposure more likely depends on their specific operating footprint—what they source, where they produce, which markets they serve, and the physical routes connecting them.37 By mapping these footprint components, companies can expose hidden risks and target mitigation actions.
Illustrative example: Automotive manufacturing
We illustrate this journey through a hypothetical automotive original equipment manufacturer with production facilities in Detroit and Shanghai. It serves markets across North America, Europe, the Middle East, ASEAN economies, and China. The analysis focuses on gas-powered passenger vehicles, whose production requires multitiered networks of power trains, electronics, metals, and structural body assemblies. Despite producing the same vehicle, the two hubs inherit very different vulnerabilities from their locations and trading relationships (Exhibit 16).
Businesses can map out whether their inputs sit in the Achilles’ heel of economies where they are based.
1The classification of the feasibility of rerouting through alternative maritime routes is based on Verschuur et al., “Systemic impacts of disruptions at maritime chokepoints” (2025), based on illustrative end markets across North America, Europe, the Middle East, ASEAN economies, and China (mainland).
2Exposure of upstream inputs to chokepoints is calculated by weighting gas-powered vehicle inputs by trade value at a sector level, multiplying each sector by its exposure to each type of chokepoint, then summing up the resulting percentages.
For the hypothetical Detroit facility, 26 percent of the upstream supply chain faces exposure to two or more trade vulnerabilities, including key inputs such as aluminum, copper, and rubber.38 Upstream inputs include both those directly linked to production at the facility (tier one) and those linked indirectly through these direct inputs (tier two). In contrast, the Shanghai facility experiences lower exposure with 22 percent of its upstream supply chain facing overlapping vulnerabilities. Both facilities would require different resilience strategies depending on their location and exposure to import vulnerabilities, even though they make the same product.
From a physical chokepoint perspective, the United States is less exposed for its upstream imports as well as export markets than China in this hypothetical example. While exports from the US facility to Europe remain exposed to transatlantic passages such as the Danish Straits, Strait of Gibraltar, and Dover Strait, the Detroit hub can reach North American markets via secure overland routes. Cities like Shanghai are far more exposed, relying on maritime nodes like the Strait of Malacca and the Suez Canal to serve export markets in ASEAN economies, the Middle East, and Europe.
But companies are not limited to their existing footprints. They can shift production to locations that strengthen resilience while remaining competitive, weighing factors such as operating costs, supplier ecosystems, and access to end markets. But shifting manufacturing footprints requires balancing resilience with competitiveness. MGI research finds that levelized costs can vary substantially across locations, with the highest-cost locations in selected industries costing 40 to 260 percent more than the lowest-cost locations.39 Companies can therefore assess where greater resilience justifies a potential cost premium—and where supplier ecosystems, market access, or industrial-policy support can narrow the gap enough to make an alternative location competitive. But today’s cost gaps need not be fixed. Companies can also change the cost equation itself: Investments in automation and physical AI could reduce labor and operating-cost disadvantages, potentially making resilient locations that were previously uneconomic more competitive.
These localized footprints can translate into a different “Six R’s” resilience portfolio. For example, while copper wires are concentrated for both hubs, both Detroit and Shanghai can mitigate this by shifting to globally available suppliers, building inventory buffers, and reducing material reliance.
Institutionalize geopolitical and supply chain intelligence
Companies could benefit from institutionalizing the capabilities to identify vulnerabilities early and respond quickly. Yet geopolitical preparedness is limited: Only 15 percent of surveyed executives have dedicated intelligence units, while less than one-third view their risk management capabilities as mature.40 Closing this gap likely requires both greater visibility and the ability to act on it: mapping dependencies beyond direct suppliers (tier one) to suppliers further upstream in the value chain (tiers two and three); monitoring real-time disruptions through digital control towers that can provide a bird’s-eye view across supply chain planning; and embedding agile scenario planning and operations to reallocate supply as needed.41 For example, DHL established a proprietary DHL Globalization Tracker which functions as an early-warning system and maps potential exposures for the company, continuously monitoring shifting trade policies and broader global developments.42
Similarly, Walmart has strengthened its supply chain agility by scaling AI and automation across its global operations. Its systems predict demand, reroute inventory, and optimize fulfillment. Beyond its internal operations, Walmart has developed Scintilla, an insights platform that provides suppliers with actionable data and AI-powered insights to support more effective coordination and informed decision-making in response to changing market conditions.43
Turn resilience gaps into investable opportunities
Resilience is not only a cost to manage. It can also provide upside. Outperformers are more prepared to manage disruptions better than their competitors or use disruption to strengthen their competitive position. They identify new markets, including areas where governments are willing to support new capacity; invest in resilience; and offer customers ways to reduce supply chain risks.
BASF illustrates how resilience can protect against downside during disruptions. Despite Middle East supply disruptions, volumes rose 7 percent year over year in the second quarter of 2026, supported by a diversified production footprint, flexible operations, and trading capabilities that enabled it to secure alternative supplies and continue serving customers.44
For businesses, trade vulnerabilities can also signal where future investments may flow. For instance, India has identified roughly $51 billion of strategic imports where it aims to build domestic capacity, providing a signal to private investors on where government priorities could create new manufacturing opportunities.45 This kind of policy action effectively acts as an opportunity map where companies can identify products adjacent to their existing capabilities, anticipate where new supplier ecosystems may emerge, and use partnerships or industrial-policy support to close competitiveness gaps. Often, companies can work with governments to capture these emerging markets.
Resilience investments can create opportunities across entire ecosystems. Efforts to diversify rare-earth magnet supply, for example, are attracting public and private capital into new capacity, supported by mechanisms ranging from direct investment to long-term offtake and price guarantees. Opportunities extend beyond rare-earth producers themselves to the businesses that finance, build, insure, and connect new capacity. Lynas Rare Earths has expanded its role in the global rare-earth value chain, supported by long-term customer commitments and government-backed initiatives. The company contributes additional processing capacity to a market where supply remains concentrated, helping customers enhance supply chain resilience for applications including automotive, advanced manufacturing, and robotics.46
Companies can design geopolitical optionality into their products. Customers’ Achilles’ heels can create markets for new product designs. For example, suppliers can develop electric-vehicle motors that eliminate heavy rare earths such as dysprosium and terbium for automakers seeking to diversify critical-mineral exposure, while one high-tech company developed different product specifications to serve markets facing different trade restrictions. This optionality can also help companies expand into adjacent markets—for example, some automakers are adapting commercial technologies and products to serve growing defense demand.
Software companies now sell sub-tier supply chain visibility as a commercial service so that corporations can better identify potential concentration risks further up in their own value chains. For example, companies have leveraged AI and supplier-verified data to map these extended networks continuously, alerting clients to financial distress, sanctions exposure, and geopolitical events that propagate up through sub-tiers.
Build coalitions for problems no company can address alone
Structural bottlenecks cannot be solved in isolation. Disruptions may cross borders and require corporate ecosystems designed to collectively mitigate shared risks, integrate complementary industrial capabilities, and navigate complex cross-border jurisdictions.
US hospitals did that through the formation of a nonprofit generic drug company. Seven major hospital systems built collective purchase commitments large enough to ensure sufficient buffer inventories for generic drugs. This had not been possible previously because manufacturers were not incentivized to invest in resilient supply chains for low-margin drugs.47
Collaboration is also relevant in R&D, as evidenced by the development of the Interuniversity Microelectronics Centre (IMEC), a research institute co-funded by leading semiconductor players globally. The institute enables industry players to share the high up-front costs and risks of pre-competitive semiconductor research while preserving proprietary development of next-generation semiconductor process technology.48 To date, IMEC has translated this collaborative model into concrete technological advances, including demonstrating next-generation chipmaking technologies that could help continue the advancement of the semiconductor road map and commercial production of advanced chips.
Policymakers can play an integral role in setting businesses up for success
The starting point for policymakers is a clear view of where their economy’s vulnerabilities lie, and which matter most. Not every dependency warrants intervention, and different vulnerabilities call for different responses. With that in mind, policymakers could translate resilience into investment road maps: enabling businesses to act quickly and invest with confidence; intervening selectively where markets fall short; and working with partners in areas where no economy can build resilience alone.
Create an enabling environment for the Six R’s to move quickly and flexibly
Putting these responses into practice often depends on conditions outside the control of individual businesses. As governments identify strategic dependencies, they may direct where investment opportunities emerge and support long-term resilience initiatives by streamlining regulation, building infrastructure, cultivating specialized talent, and improving access to finance.
Clear, long-term policy signals can give businesses the confidence to invest, particularly in future-shaping industries where capacity and capabilities take years to build. For companies weighing where to relocate or expand production, industrial policy can help close competitiveness gaps in cost, infrastructure, or capabilities, making otherwise marginal locations viable. Policy uncertainty, in contrast, can weaken the economic case and delay investment precisely when it matters most.
From the EU’s Critical Raw Materials Act to the US FAST-41 program, economies seeking to lower dependence on critical minerals have introduced initiatives to streamline multiple, overlapping approval processes that could previously take decades.49 The United States has extended this approach to coordinate permitting timetables and interagency reviews for qualifying infrastructure projects across energy, semiconductors, and AI.50
Intervene strategically and efficiently when markets fall short
Policy interventions would not necessarily benefit all of the $19 trillion in global imports we examined. But targeted state support could be helpful when market forces alone fail to address strategic vulnerabilities. They could be designed as part of broader frameworks that address specific problems and act as a market catalyst within time and budget constraints.
For example, Japan’s support for TSMC’s first Kumamoto fabrication plant illustrates a state-funded catalytic capital approach that later unlocked more than $20 billion of investment to expand Japan’s domestic semiconductor ecosystem.51 Other tools exist apart from capital. The United States can assign priority ratings to specific orders via the US Defense Priorities and Allocations System to ensure sufficient national supply even if it requires companies to break existing commercial agreements or sacrifice higher-margin private contracts. This mechanism was invoked for ventilator production during the COVID-19 pandemic, and recently for infant formula and semiconductor materials during supply chain shortages.52
Build resilience through alliances that no single economy could achieve alone
More than 50 percent of economies see similar products in their Achilles’ heel such as smartphones, memory chips, and lithium-ion batteries, a scale far too large to tackle alone. Different models of multilateral collaboration are emerging with the aim of combining scale and capabilities to protect shared economic interests.
For instance, the Comprehensive and Progressive Agreement for Trans-Pacific Partnership pooled the collective scale of 12 nations that represent roughly 16 percent of global imports, creating an independent, multicontinental economic corridor.53 A sector-specific example includes the ASEAN Framework Agreement on Petroleum Security, which coordinates emergency fuel-sharing during severe supply disruptions.54
Even as the immediate pressures on global supply chains ebb and flow, our analysis reveals the surprising flexibility of global trade despite its structural fragilities. True resilience is not about achieving complete self-sufficiency, but about building a more diversified, agile, and collaborative global system. Forging this new era of trade security will likely require strategic alignment from both public and private sectors, and continued collaboration for economies to safeguard their interconnected prosperity.
Related Articles

Geopolitics and the geometry of global trade: September 2026 update

Ramping up manufacturing in America?
