As former US Secretary of State Condoleezza Rice observed at the 2026 Aspen Security Forum, “I’m very often asked, is what we’re seeing a revolution or an evolution? And I say that a revolution is what happens when you don’t see an evolution coming.”1
For a generation, companies and governments have operated in a broadly predictable environment of open markets and deep global integration. That world delivered enormous growth, but it also left behind a series of imbalances, among them: a widening US–China trade gap, deep dependence on foreign suppliers for goods critical to national security, and intensifying competition for the same limited set of growth arenas. To correct some of these imbalances, governments are taking an increasingly active role in the global economy, primarily through rapid expansion of industrial policy, tariffs and trade barriers, sanctions and export controls, and other measures that can distort trade.
As governments act in the national interest, the rules that companies have operated under for decades are being rewritten. Many have found the uncertainty unnerving. Most have taken action to mitigate risk—and even pursue opportunity. Leading companies are trying to understand their exposure at both the product and country level, for each aspect of their business; the speed at which they can adjust; and the costs associated with doing that. Indeed, these companies are turning their understanding of six patterns illustrating geopolitics’ impact on trade and competition into their own new playbooks for growth.
Globalization is not in retreat—trade is reconfiguring according to geopolitical logic
Trade is still growing, but the geopolitical distance traveled by trade is falling: Global goods trade grew 6.5 percent in 2025, outpacing global GDP growth of 5.4 percent even as US tariffs reached their highest level in 80 years.2 But how much that trade traverses geopolitical boundaries, or geopolitical distance, is shrinking. Since 2017, the geopolitical distance of global trade has declined by around 8 percent, and by nearly 13 percent for the United States, even as geographic distance has grown slightly (Exhibit 1).3
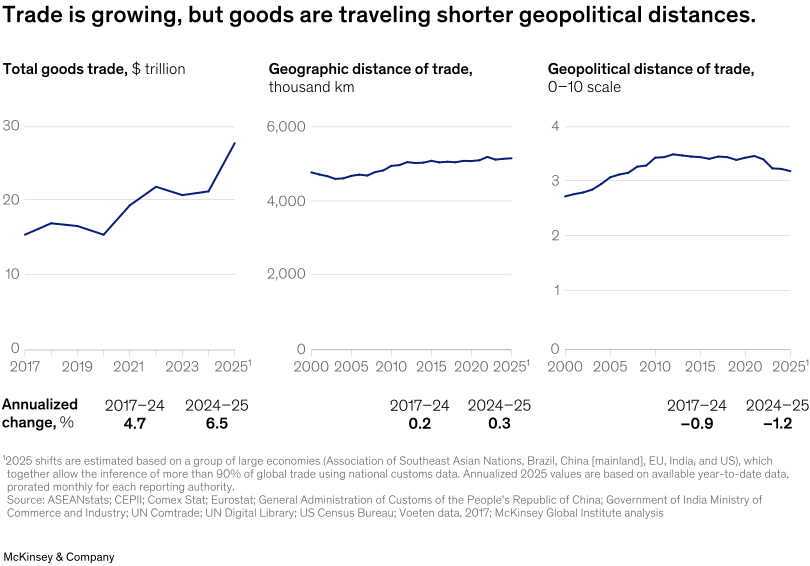
Countries are trading more with geopolitically aligned peers and trading less with distant ones. For example, China’s share of US imports fell 4.4 percentage points between 2024 and 2025—more than triple the decline recorded between 2017 and 2024. Meanwhile, US imports from Association of Southeast Asian Nations economies and other countries in Asia–Pacific rose significantly.
China, seeing its access to the US market decline, is pivoting to become the “factory to the factories.” In 2025, China’s exports of consumer goods fell for the first time since 2019, while exports of intermediate and capital goods—the machinery and inputs other countries need for their manufacturing—rose by $175 billion, much of it flowing to fast-growing production hubs in lower-income regions.
As global trade is increasingly informed by geopolitical logic, companies should anticipate changing patterns in their product flows and supply chains. These shifts in trade will create opportunities in some corridors and disruption and challenges in others. Companies that realign themselves with growing trade could maximize upside and minimize disruption. For example, US imports from Vietnam, one of the fastest-growing corridors, rose 42 percent in 2025 to nearly $195 billion as trade was rerouted away from more geopolitically distant partners.4 There is an opportunity for companies that are already trading in this corridor to capture new sources of value and a strong signal of potential growth for new companies just entering the corridor.
Governments are actively opening new corridors, too: India and the United Kingdom struck a bilateral trade agreement in 2025, and the European Free Trade Association signed a new pact with the Mercosur bloc. Both agreements are likely to create meaningful opportunities for companies to capture value in those respective corridors.5
Global footprints, once seen primarily as a source of cost or complexity, are again being considered a source of strength. They imbue companies with the kind of geographic agility they need to minimize disruption and move swiftly to expand or enter new corridors. Leading companies are leveraging their global footprints and investing in agility to source, sell, and manufacture across a wider range of markets than less agile companies.
Building that agility means scoping relevant disruption scenarios, quantifying the value at stake for the organization, compiling an ecosystem of insights by gathering regional intelligence, considering joint ventures or option contracts, building redundant sourcing, and much more. In this way, leaders can move their enterprise up the “tolerance curve” to operate in geopolitically distant environments rather than retreat from them.
Agility in today’s geopolitical environment means that geopolitical disruption from some is opportunity for others. For example, recent disruptions in the Middle East may have rattled operations for many of the region’s largest air carriers, but Turkish Airlines was able to leverage its scenario planning to quickly reallocate capacity toward Asian and European routes. It expanded its seat occupancy in Asia by 18 percent and captured the largest second-quarter load factor in its history as demand shifted elsewhere.6
Countries are prioritizing security in critical products and allowing markets to lead in others
Global trade is now governed by two different logics. One covers what we call “Achilles’ heel” products, where geopolitical logic is more likely to prevail and states are more likely to actively secure supply chains with less emphasis on cost. The other covers the rest of product trade, which is primarily governed by market logic: price, speed, and quality still rule. Leading companies are learning to run both playbooks simultaneously.
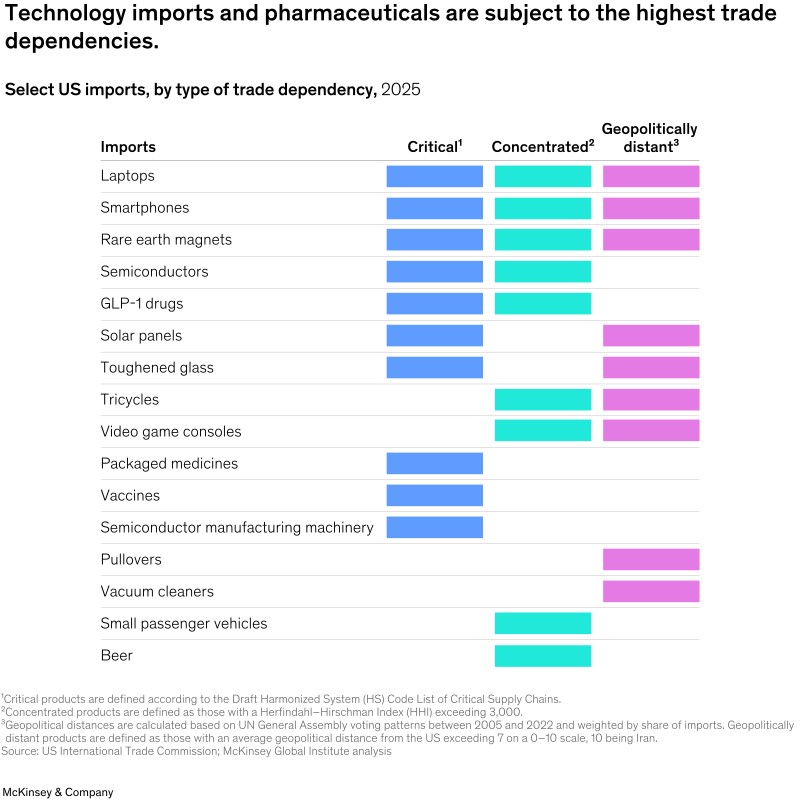
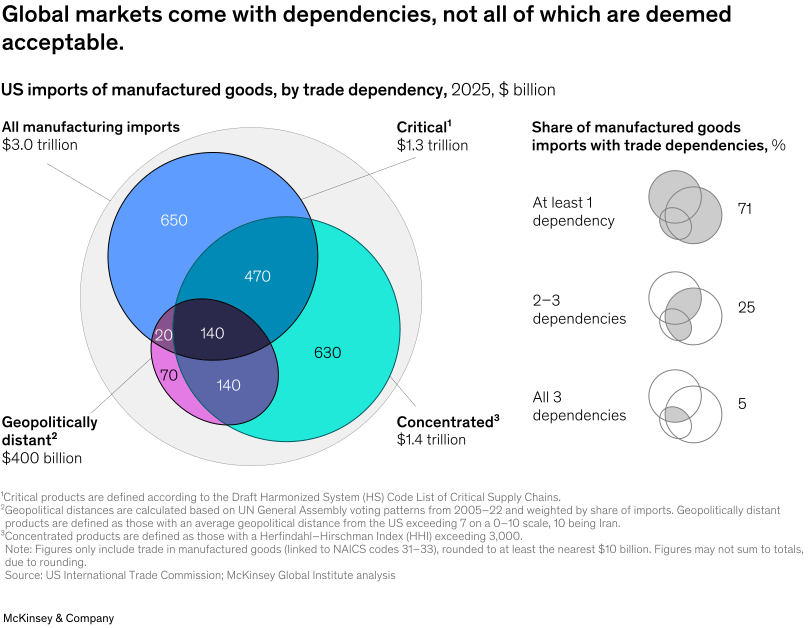
Across major economies, one-quarter to one-third of manufactured imports qualify as Achilles’ heel products—or goods exposed to at least two of the following three dependencies: critical to national security, concentrated among a handful of suppliers, or sourced from geopolitically distant partners.7 Rare earth magnets, for instance, meet all three dependencies for the United States and Europe. In April 2025, China’s export licensing on seven rare earths resulted in a roughly 75 percent reduction in magnet exports, idling production lines across Europe that were several steps removed from any direct purchase from China.8
These dependencies can be structural: The United States is more than 70 percent import-reliant for roughly 25 critical minerals, and, in the specific case of rare earth magnets, its imports from China exceed the combined exports of the same product from all other economies (Exhibit 2).9
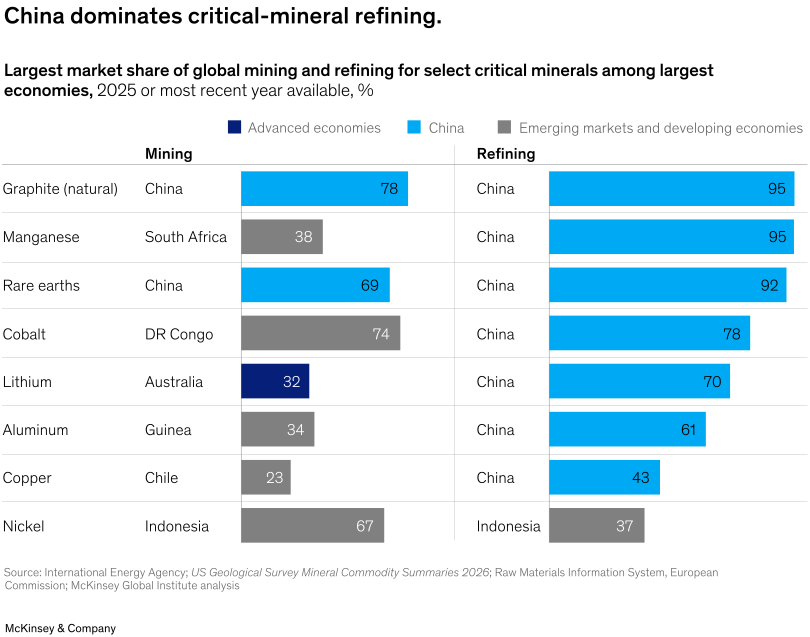
China’s advantage starts upstream in refining, where it leads processing of nearly every critical mineral (Exhibit 3). It has leveraged this position through export controls on selected minerals.10 Because refining capacity is difficult to build quickly, securing supply is likely to require managed interdependence rather than full self-sufficiency in the near term.
The companies that saw this coming acted early to secure their supplies of critical Achilles’ heel products. Hyundai stockpiled a year’s supply of rare earth elements after China’s 2025 export controls.11 And Toyota, having diversified its chip suppliers well before the 2021 shortage, kept its North American plants running at up to 90 percent of capacity while peers cut production.12
Governments are helping to underwrite this shift. In July 2025, the US Department of Defense took a 15 percent equity stake in rare earth miner and processor MP Materials, with a ten-year price floor and a commitment to buy 100 percent of output from a new magnet facility.13 The US government followed with similar equity stakes in Korea Zinc, Trilogy Metals, USA Rare Earth, and Vulcan Elements.14
Beyond Achilles’ heel products, trade corridors are likely to keep growing based on economics. Companies’ decisions to enter new markets will increasingly depend on their existing footprint and operations and whether there are established or strengthening trade corridors between two countries. For their part, top companies are rewiring themselves not just to optimize costs but also to broaden their footprints so they can shift to more favorable trade corridors. For instance, Foxconn is regionalizing AI server assembly into Mexico for the North American market rather than concentrating it in China.15 The company’s move is not defensive; leaders are placing big bets on where growth is heading.
Investment competitiveness is a national priority creating growth opportunities for companies
The shifting geopolitical sands have highlighted the lack of investment in strategic industries such as energy and semiconductors. McKinsey research shows that net productive investment in the United States and Europe has stagnated over the past 30 years, while China’s investment has boomed, keeping pace with GDP growth.16 McKinsey Global Institute (MGI) research comparing ten sample investment cases in future-shaping industries found that the United States and Europe have levelized break-even costs that are 50 to 300 percent higher than those of global leaders, notably China.
There are a variety of levers that both states and companies can pull to address this concern. Capital expenditures can be industrialized, accelerated in permitting and execution, and made more efficient. R&D can be parallelized, and regulatory oversight can be reformed. Energy supplies can be significantly expanded, and labor productivity can be supercharged by deploying AI. Companies can take steps to address some of these, but, ultimately, addressing the structural challenges behind the competitiveness challenges will require coordinated public and private action.
Some governments are using industrial policy to level the playing field in the short term: The number of global industrial policy actions increased by 390 percent between 2017 and 2024.17 China has been the most aggressive proponent of industrial policy, using it to boost domestic firms to global dominance: For instance, Huawei has received an estimated $75 billion in state support since the 1990s and is now the world’s largest telecom equipment supplier.18
China is likely to deploy trillions of dollars in industrial policy over the coming decades.19 In response, the United States and Europe have launched their own initiatives to support important sectors of their respective economies.20 The United States has committed nearly $40 billion in CHIPS Act grants and loans and taken some $27 billion of equity positions in strategic sectors.21 Europe launched the European Chips Act, with about €3.3 billion in funding. Moreover, Europe’s Net-Zero Industry Act and the Critical Raw Materials Act both offer streamlined permits and priority access to financing incentives.
Leading companies are treating these programs as a genuine input to capital strategy, not an afterthought. Micron secured $6.4 billion in direct funding to build fabs in Idaho and New York, anchoring a $250 billion US investment plan through 2035. Separately, Micron opened a $2.75 billion assembly facility in India, with national and state governments funding up to 70 percent of the cost.22 Intel converted $8.9 billion of CHIPS and Secure Enclave grants into a roughly 10 percent US government equity stake, trading dilution for capital certainty to keep building in Ohio.23 And in Germany, Infineon captured roughly €900 million in state funding for its new fab in Dresden.24
Companies have opportunities to capture industrial policy incentives across multiple geographies, which can help them underwrite significant capital projects, ease balance sheets, and compete more effectively abroad. When considering significant capital decisions, leaders should identify potentially relevant industrial-policy incentives available in current geographies as well as exploratory ones.
Balance sheets and economic pathways are diverging, reshaping the cost of capital and growth outlook
Capital is flowing faster than trade, making it a useful early signal of where trade is headed next. Foreign direct investment (FDI) is one important metric of capital flows, and the geopolitical distance traveled by FDI has fallen at roughly twice the pace of trade itself since 2017.25
Companies’ recent investment decisions reflect this shift: Taiwan Semiconductor Manufacturing Company (TSMC) is upgrading its fab in Kumamoto, Japan—originally planned for older-generation chips—to advanced three-nanometer production, and has framed the move as a way to distribute advanced manufacturing among trusted partners.26 Schaeffler, the German auto parts and industrials supplier, is committing €100 million a year to India over the next five years, with CEO Klaus Rosenfeld explicitly citing geopolitical reliability as the rationale for deepening ties with India.27
More broadly, national balance sheets are under strain. US public debt is roughly 120 percent of GDP, and interest payments now exceed defense spending.28 China’s corporate debt is about 170 percent of GDP, roughly double the global average.29 Europe has capital but lacks an integrated capital market, making it more difficult to marshal capital at scale and boost growth. MGI’s 2026 update on the global balance sheet shows that global assets reached a record $1.8 quadrillion in 2025, and global household wealth reached a record $570 trillion, but only 20 percent of household wealth growth came from real investment. Most were gains on paper as valuations rose alongside debt. In the United States, equity valuations stood at 2.4 times the net asset value of all firms at the end of 2025, as earnings edged to historic highs relative to GDP and invested capital.
There are three ways to address these imbalances: grow out of them, inflate them away, or reset asset values and debt. Each path holds high stakes for corporations and individuals. For the United States, MGI estimates that up to $160,000 in per capita wealth will be on the line by 2033: A productivity acceleration path would add $65,000 in per capita wealth, along with strong growth above 3 percent annually, while a balance sheet reset would instead erode wealth by $95,000 and engender a lost decade.
Meanwhile, China’s household wealth could expand by as much as half under a productivity-driven scenario with continued rapid growth. Conversely, it could grow more slowly than it has in a generation if structural reforms to boost consumption do not materialize and the country continues its property-led balance sheet reset. Europe could face a decade of sluggish growth around 1 percent and low interest rates or accelerate if it manages to step up investment. Each region’s path to a better outcome requires a different lever: The United States will need to save more, Europe will need to invest more, and China will need to consume more—each on the order of 3 to 7 percent of GDP.30
Inherently, these balance sheet pathways will affect corporate strategy and investment decisions differently in each region as corrections occur. Leaders who track the right signposts in each region—US fiscal deficit and earnings projections, European pro-investment reforms, and Chinese consumption growth and pro-consumption policies—will see which correction, or combination of them, is taking hold before it shows up in economic data.
AI is a major geopolitical concern, with leaders diversifying access to models and infrastructure
AI is one of the critical areas around which global trade flows are concentrating. Trade in AI-related goods—such as semiconductors and data center components—grew by nearly 40 percent in 2025 and accounted for a third of all growth in global goods trade. The scale of investment reflects the degree to which AI has become a hotly contested arena. The combined capital expenditure and R&D of eight leading technology firms rose from roughly $25 billion in 2005 to about $722 billion in 2025.31
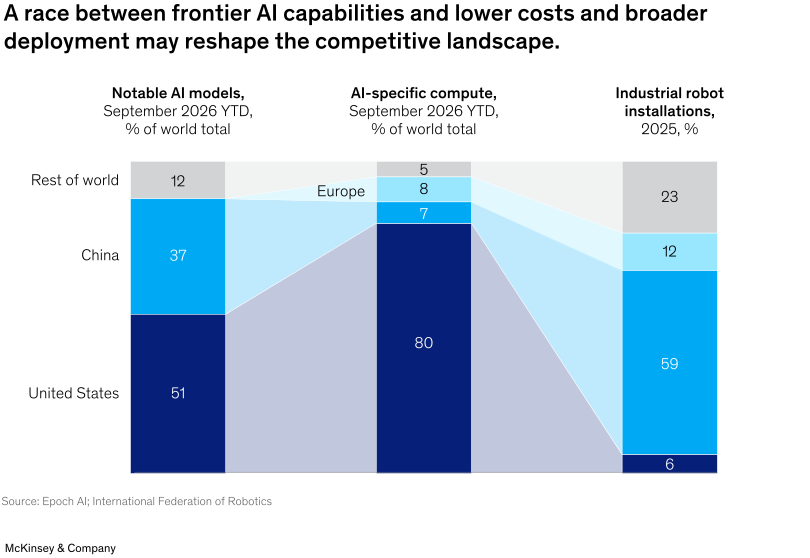
The United States leads in frontier AI model development and is widening its advantage in AI infrastructure. In 2026, major US technology companies are on pace for roughly $680 billion in capital spending, with a significant share directed toward AI infrastructure. US private investment in AI is approximately nine times that of the G6 and China combined.
Meanwhile, China’s open-weight ecosystem emphasizes deployment through cost efficiency and local customization. Chinese models account for a significant share of token volume on major inference platforms and are often priced at a fraction of leading US models, albeit generally at lower frontier capability (Exhibit 4).32 China’s manufacturing scale—including its large installed base of industrial robots—also provides a substantial platform for applying AI directly to both digital and physical industry.33 For its part, Europe retains strengths in industrial technology, semiconductor equipment, and standard setting, but remains underrepresented across much of the AI value chain.
Beyond capital and compute, data may become an increasingly important source of competitive advantage. Privacy, data access, and data governance differ substantially across China, Europe, and the United States, shaping the volume and types of data available to train, refine, and deploy AI systems. These differences could determine both model development and application-level advantage—and, in turn, the longer-term competitive landscape.
States are actively taking steps to shape competition in this area. As a result, access to frontier technology is becoming more conditional—and more political. For example, in May 2025, the US Commerce Department issued guidance extending export controls beyond hardware to the training of AI models themselves. Any exporter, cloud provider, or service that knows its chips or compute will be used to train AI models for parties in China or other restricted countries now risks being subject to a license requirement.
Meanwhile, Huawei’s Ascend chips carry a presumption of violating US export law wherever they are used.34 States are also negotiating access bilaterally: In November 2025, Washington authorized the United Arab Emirates’ AI and cloud computing group, G42, and Saudi Arabia’s Humain to each purchase tens of thousands of computing chips, with strict security and reporting requirements.35
Companies that operate across geopolitical fault lines are being steered toward a choice on AI ecosystems with significant technology architecture and data implications. Companies should segment value-creating business applications into those that rely on frontier models and those that do not. In certain areas, such as biopharmaceuticals research, cybersecurity, and so on, the frontier models will likely matter, and the geopolitical risk will be high. But in many other arenas, the constraining factor will not be the models’ capabilities but organizations’ ability to modernize their technology infrastructure and drive organizational change to capture the growth and productivity enabled by AI.
In these cases, older and potentially open-source models running on a depreciated tech stack may suffice, and leaders can worry more about the ever-present challenge of driving change in their organization rather than about geopolitical headwinds.
Most important, with the speed at which AI and AI-enabled innovations are moving, leaders would do well to continually assess the highest-value business applications, the constraining factors in unlocking value from them, and the exposure to geopolitical pressure in the tech stack related to them.
Energy security is a geostrategic priority, and a site selection criterion
About two-thirds of the world’s energy moves through at least one geographic chokepoint, and one-third crosses geopolitical lines. About 95 percent of the global population relies on energy imports, so these vulnerabilities matter. The past few years have repeatedly exposed the cost of that vulnerability—first the disruption from the Russia–Ukraine war in 2022–23, then the disruption in the Strait of Hormuz in 2026.36
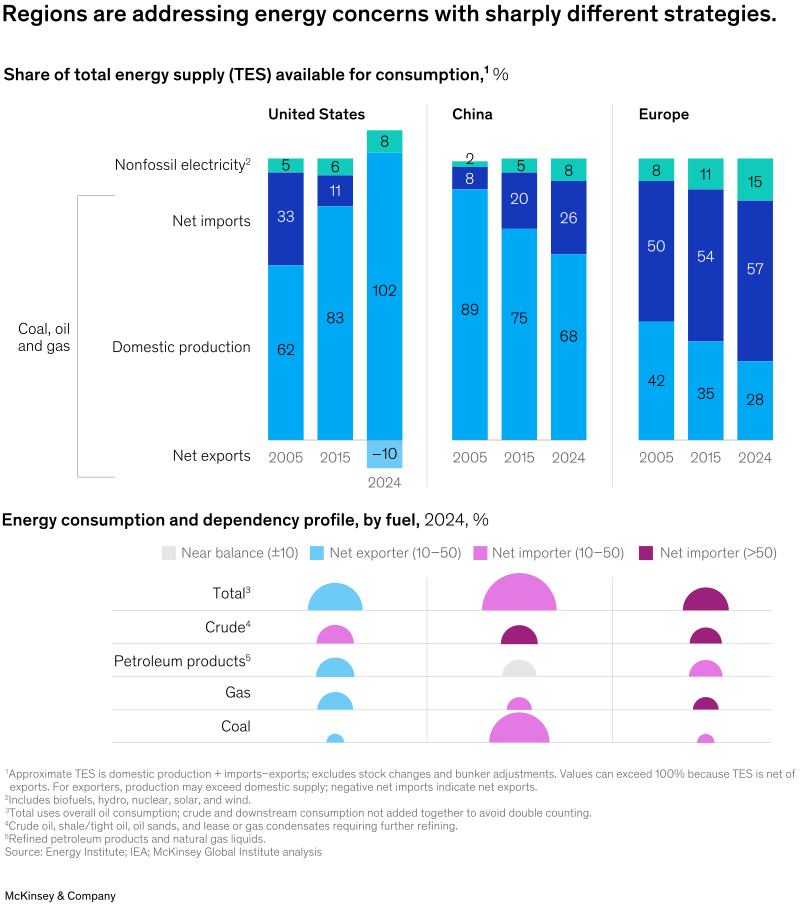
Energy security and resilience are at the top of the geostrategic agenda, and states are deploying diverging strategies. The United States, the world’s largest oil and gas producer, is leaning on shale production domestically and control of important reserves abroad. China is pushing aggressively toward clean energy and electrification but still imports more than 70 percent of its crude oil.37 Europe remains dependent on imported fossil fuels as it works to cut its reliance on Russian gas without driving prices higher still (Exhibit 5). Energy prices are diverging accordingly: When the disruption in the Strait of Hormuz hit, European gas prices rose 35 percent while US prices fell 9 percent.38
For energy-intensive businesses, the security of supply has turned into a capital-allocation decision. Microsoft and Amazon have both signed long-term power purchase agreements for data centers with nuclear power plants, totaling billions of dollars in commitments.39 SpaceXAI took a different path, opting to run its Colossus cluster in Memphis, Tennessee, on on-site gas turbines rather than waiting for grid interconnection. This was part of a broader shift that could put roughly 90 gigawatts of US data center capacity behind the meter.40 Similarly, European utilities are rewiring supply well ahead of the European Union’s 2027 ban on Russian gas imports.41 In 2026, Germany’s Uniper signed a 20-year deal for Canadian liquefied natural gas from the Ksi Lisims project.42
The strategies regions take to build energy security depend heavily on their starting position. For example, net energy exporters have many more levers to pull than importers do. The ability to deploy more extraction or generation, or to hold significant stockpiles, represents important levers for states to have at their disposal. However, the direction is the same for all: Companies are now weighing the global energy landscape when committing to capital decisions where the returns will depend on high levels of energy consumption.
Together, these six patterns describe the same underlying shift: Globalization is not retreating; it is realigning along geopolitical lines. Governments are taking more active roles in the economy to address imbalances left behind by the era of markets. The companies that are moving first to secure critical inputs, build competitive advantage, capture growth in trade corridors and capital flows, and build organizational agility are treating this reordering as an opportunity rather than a threat.
And they are not betting on everything with a single view of the future. They are building optionality—that is, scenario planning with real value at stake attached, signposts that tell them which future is arriving, and playbooks they can execute when those signals become clear. That discipline is what can turn geopolitical volatility from a threat into a true source of advantage.
Related Articles


The global balance sheet 2026: Imbalance and divergence