The need to make sustained and serious progress toward ethnic and racial justice is clear—in the United Kingdom and elsewhere. COVID-19 has disproportionately affected Britain’s ethnic minorities.1 In the longer term, globalization and automation could worsen inequality.
What to do depends on the specific circumstances of each country. Our colleagues in the United States have published a series of analyses on specific ethnic groups. In this report, we look at the United Kingdom, where about one in seven people, or 14 percent, belong to a minority ethnic group (Exhibit 1).2

Those figures are likely to change, however. Ethnic minorities are younger than average, accounting for 20 percent of those aged 24 or under; by 2051, they could account for one in five of the population. The implication is that ethnic minorities will become even more important in terms of their contribution to society and the economy than they are now. Already, they account for more than £300 billion in purchasing power,3 and ethnic-minority-owned small businesses contribute £25 billion a year—or as much as the chemical industry—to the country’s gross value added.4
The focus of our analysis is on the socioeconomic aspects of ethnic equality, looking at the position of Britain’s Black, Asian, and minority ethnic (BAME) groups in terms of employment, earnings, education, health, and well-being (see sidebar, “Highlights of the research”). The circumstances for different groups can vary significantly, so we also draw out findings on specific minorities throughout the report.
Overall, there are five major findings. First, over the past two decades, every British ethnic-minority group has made progress, in both absolute terms and relative to the white majority, in labor-force participation, employment, occupational mix, and education. Second, despite the progress, ethnic minorities still do less well than white people in most socioeconomic areas. (The exception is education, where minorities generally do better.) Third, there are large differences between specific groups. People of Chinese and Indian origin tend to do well on all measures studied, and often better than white people; the metrics for Bangladeshis, Black people, and Pakistanis are usually worse.5 Fourth, global shocks—including the coronavirus pandemic and large-scale automation—are not helping. Not only do all ethnic-minority groups have higher age-adjusted COVID-19 death rates than white people, but Bangladeshis and Pakistanis in particular are concentrated in occupations that have been hard hit by furloughs and layoffs. They also appear to be more vulnerable than other ethnicities to job losses associated with automation. And finally, our analysis points to clear priorities for communities, employers, and government at all levels.
How Britain’s ethnic minorities are faring in the labor market
How are Britain’s ethnic minorities doing in labor-force participation, employment, occupational mix, and pay? It’s complicated.
What is the labor-force participation and unemployment profile for ethnic minorities?
In 2018, all ethnic-minority groups had lower labor-force participation rates—defined as the percentage of 16- to 64-year-olds who were working or looking for work—than their white counterparts (Exhibit 2).6 For white workers, the combined participation rate for both sexes was 80 percent, followed by Indian workers, at 79 percent; for Black workers, it was 73 percent, and for Bangladeshis and Pakistanis, 62 percent. The overall gap between ethnic-minority individuals and white workers was 9.5 percentage points, down from 12.7 percent in 2004.

Most ethnic-minority groups have been closing the gap on labor-force participation.
| Ethnic group | 2004 | 2005 | 2006 | 2007 | 2008 | 2009 | 2010 | 2011 | 2012 | 2013 | 2014 | 2015 | 2016 | 2017 | 2018 | Net change 2004–18 |
|---|---|---|---|---|---|---|---|---|---|---|---|---|---|---|---|---|
| White | 77.46 | 77.6 | 77.8 | 77.7 | 78 | 77.8 | 77.2 | 77.6 | 78 | 78.4 | 78.6 | 79.0 | 79.2 | 79.8 | 79.8 | +2.4 |
| Indian | 72.9 | 73.8 | 74.5 | 74.2 | 74.1 | 74.5 | 75.9 | 76.4 | 76.6 | 75.7 | 75.7 | 76.3 | 76.9 | 78.1 | 79.3 | +6.4 |
| Black | 69 | 70.4 | 71.8 | 72.6 | 71.6 | 71.4 | 71.6 | 72.2 | 73.9 | 73.5 | 72.8 | 73.8 | 74.6 | 73.5 | 73.3 | +4.5 |
| Mixed ethnicity1 | 70.8 | 70.4 | 72.6 | 71.8 | 69 | 69.7 | 72.1 | 71.4 | 70.6 | 73.5 | 72.3 | 72.3 | 71.8 | 72.6 | 72.1 | +1.2 |
| Other Asian2 | 64.4 | 64.4 | 65.8 | 66.8 | 69 | 68.1 | 64.4 | 65.1 | 65.8 | 64.4 | 67.0 | 68 | 66.1 | 68 | 67.8 | +3.5 |
| Other ethnicity3 | 62.2 | 64.2 | 63.8 | 64.4 | 65.4 | 63.7 | 64.4 | 65 | 65.4 | 64.9 | 63.7 | 64.9 | 65.8 | 66.8 | 65.6 | +3.5 |
| Bangladeshi and Pakistani | 51.1 | 50.8 | 52.4 | 52.4 | 54.2 | 56 | 55.5 | 57 | 58.2 | 59.4 | 60.2 | 60.3 | 61 | 61.9 | 62.5 | +11.3 |
Notes
1"Mixed ethnicity" refers to individuals who report having two or more ethnic backgrounds; the largest subgroup is Black/white, accounting for about half the total group.
2"Other Asian" refers to individuals of Asian descent who are not Bangladeshi, Chinese, Indian, or Pakistani.
3"Other ethnicity" refers to individuals not included in any of the other groups; around 40 percent are of Middle Eastern descent.
Source: Annual Population Survey, 2020, Office for National Statistics, ons.gov.uk
McKinsey & Company
The gap is not very large between white men (84 percent) and ethnic-minority men (79 percent). The big difference is between white and ethnic-minority women, at 76 and 62 percent, respectively (Exhibit 3). The most extreme example is that of Pakistanis and Bangladeshis, where women accounted for 15 points of the 18-point labor-force participation gap. Age also plays a role. Ethnic-minority women in the youngest age bracket—between 16 and 24 years—trail furthest.7 The average labor-force participation among ethnic-minority women in this group is 43 percent, compared with 63 percent for young white women.

For all groups, except white men and men of mixed ethnicity, labor-force-participation rates rose between 2004 and 2018.8 White men’s participation rate stayed flat at 84 percent between 2004 and 2018, while participation of ethnic-minority men rose from 75 to 79 percent. White women increased their participation from 71 to 76 percent, while that of BAME women rose even faster (55 to 62 percent). The most striking gains were among Bangladeshi and Pakistani women. While their participation in 2018 was still low (45 percent), that rate is 15 percentage points higher than in 2004. This increase in participation was followed by that of Indian women, whose participation rose from 64 to 72 percent, and Black women, with an increase from 63 to 69 percent.
Regarding unemployment, the story is similar. In 2018, all ethnic minorities except Indians had higher unemployment rates than white people (4 percent). Black workers had the highest unemployment rate (9 percent), followed by Pakistanis and Bangladeshis (8 percent). BAME women tended to suffer from slightly higher unemployment rates than men, but the differences were smaller than those for labor-force participation. The only substantial intragroup gender gap was between Bangladeshi and Pakistani men and women: male unemployment for these groups was 6 percent, less than half that of females (13 percent).
Differences in unemployment rates have narrowed over time. Unemployment has fallen at least three percentage points for all ethnic-minority groups since 2004 while remaining stable for white workers. The largest improvements were among Pakistanis and Bangladeshis (from 13 percent to 8 percent); mixed-ethnicity individuals (from 12 to 7 percent), and Black workers (from 13 to 9 percent). To sum up, despite strong positive trends, labor-force participation and unemployment rates still show gaps relative to the white population, particularly among women.
What kinds of jobs do Britain’s ethnic minorities do?
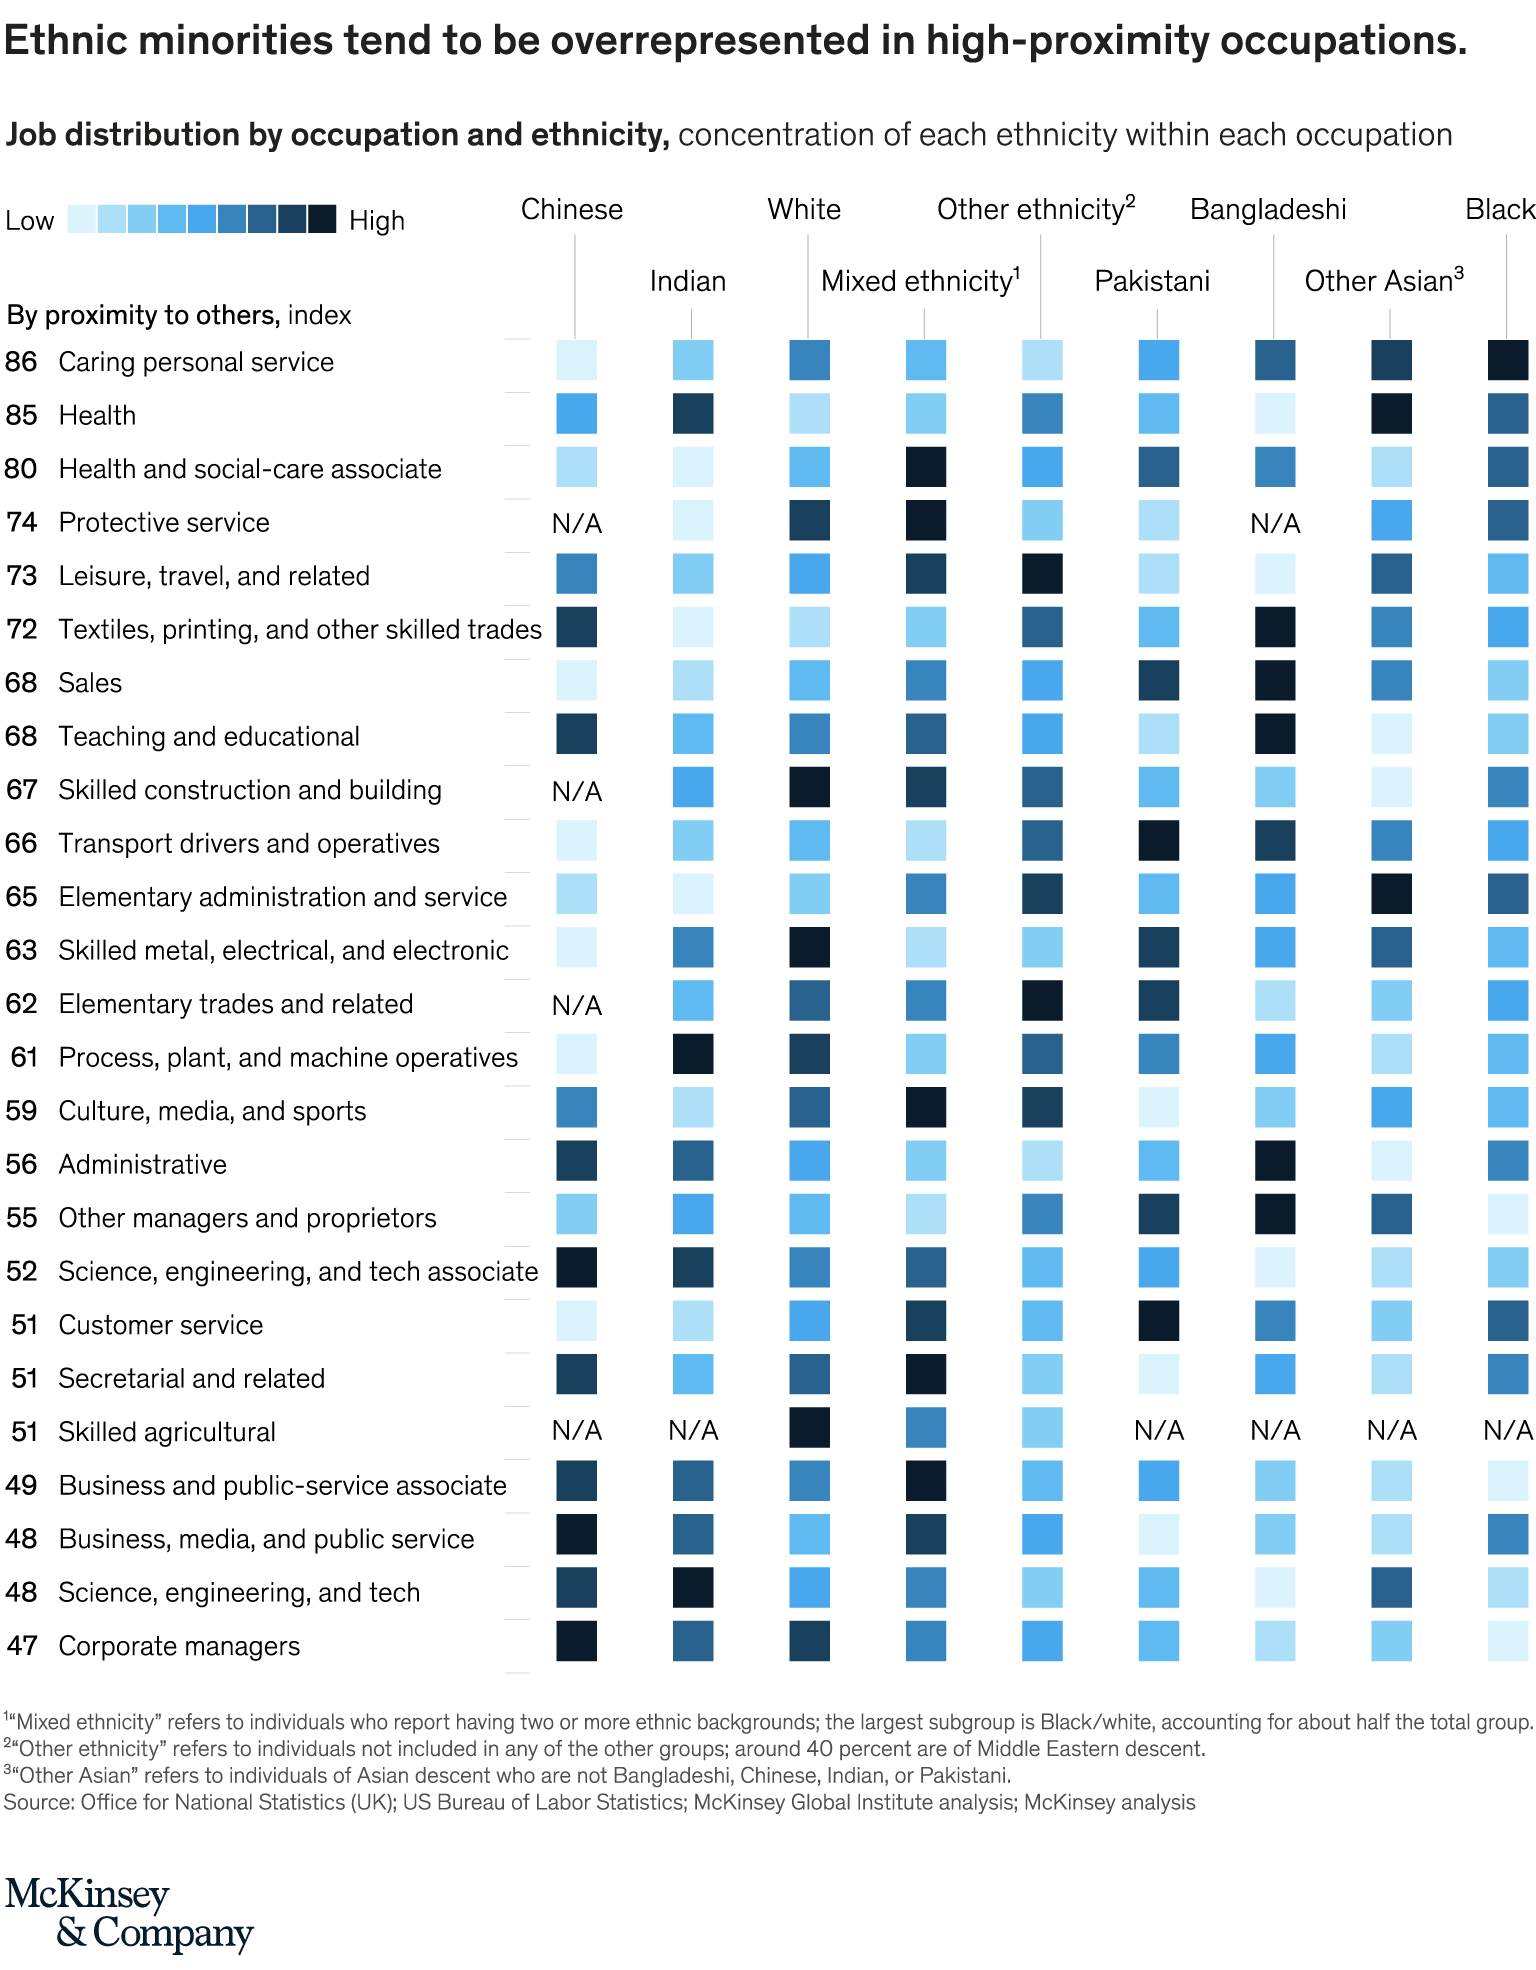
Different ethnicities have varying distributions across occupational categories (Exhibit 4).9 Chinese and Indians are likelier to work in the highest-paid occupations; they are overrepresented among corporate managers and directors, as well as in health occupations and among science, engineering, and technology professionals. For example, 13 percent of Indians are science, engineering, or tech professionals, more than double the share of the whole population (6 percent). White workers also are well represented in some highly paid occupations, and they have relatively more weight than Indians and Chinese in medium-pay jobs, including skilled construction and building trades and culture, media, and sports occupations. Ethnicities that are more likely than others to hold the lowest-paid occupations are Bangladeshi, Black, Pakistani, other Asian, and other ethnicity.
These groups vary, however, in terms of the specific types of occupations in which they are overrepresented. Black workers are significantly overrepresented in caring personal-service occupations (almost 16 percent, compared with 7 percent for the whole population), and other Asians also are overrepresented here (9.5 percent). This occupational grouping includes jobs such as nursery nurses and home carers. Bangladeshis and those in the other-Asian and other-ethnicity groups are much more likely to work in textiles, printing, and other skilled trades, as well as to be drivers or operatives. Pakistanis are highly overrepresented among drivers and operatives.
In recent years, all groups have improved their occupational mix toward higher-paid jobs, and some ethnic minorities have been doing it at a faster pace than white workers. Between 2015 and March 2020, total employment in the United Kingdom increased from 30.5 million to 32.5 million jobs. The top five occupations in terms of median hourly pay grew by 19 percent, while the bottom five shrank by 1 percent. For the white population, total employment grew by 5 percent, while employment in the top five occupations increased 17 percent, and employment in the bottom five declined by 2 percent.
Indeed, the occupational mix for all ethnic-minority groups also shifted disproportionately toward the highest-paid occupations. Among Bangladeshis, for example, the number of employed individuals in the top five occupations grew 74 percent, while it shrank 2 percent for the bottom five. For those in the other-ethnicity group, the top five increase was 40 percent, and the bottom five decline was 5 percent.
Overall, then, when looking at differences in ethnic minorities’ occupational mix, there are two main distinctions. Indian and Chinese workers are likelier than other ethnic groups to be in higher-paid jobs, such as management or technology. All other minority groups are more likely than average to work in lower-paid occupations, such as personal care, administrative, and sales jobs.
How do ethnic minorities compare in terms of pay?
The “unconditional pay gap”—the difference in median hourly earnings between ethnic minorities and white workers, without controlling for factors like education and age—follows the expected pattern given the occupational data. Chinese and Indians had higher median hourly earnings than white workers in 2018, while all other groups had lower earnings, with Bangladeshis earning the least, 20 percent less than white employees.
The unconditional pay gap may also reflect existing skill differentials in the adult population.10 One factor is historical education outcomes. Some older ethnic-minority individuals will have grown up in another country with worse overall education or may have been disadvantaged in the United Kingdom’s education system in the past. Another issue for ethnic minorities is access to coaching, training, and progression at work. Such opportunities tend to be more available to highly educated people, further polarizing the distribution of adult skills.
Moreover, within any given occupational group, some ethnicities are less likely to participate in training. For example, in a survey by the Office for National Statistics (ONS), 33 percent of all employees in caring, leisure, and personal-service occupations said they had participated in job-related training or education in the previous three months. Pakistani, Chinese, and Bangladeshi workers, however, were significantly less likely to have done so (25, 23, and 21 percent, respectively). Bangladeshis reported a lower-than-average rate of training in all nine occupational groups analyzed, and Chinese and Pakistanis in all but one.
While statistics on the level of adult skills by ethnicity are not abundant, the most recent data (2012) from the OECD’s Programme for the International Assessment of Adult Competencies, found that British adults from most ethnic minorities performed significantly worse than their white counterparts on tests of literacy, numeracy, and problem-solving skills.11 For example, for literacy, the average score for white people was 276, while the scores of those of other ethnicity, Asians, and Black people were 254, 244, and 242, respectively.
A more sophisticated analysis of the pay gap tries to determine whether ethnic minorities’ earnings are lower even after controlling for other factors that can affect income; this is called the “conditional pay gap.” In 2019, researchers at the Bank of England adjusted earnings differences between ethnic groups using several relevant factors, including age, qualifications, occupation, and sector.12 The report found that when comparing people with very similar individual and job characteristics, ethnic-minority workers earned 10 percent less than white workers in the period 2014 to 2019. This was true for all ethnic groups, except for mixed ethnicity. Bangladeshis had the largest average conditional pay gap (20 percent), followed by Black workers, Pakistanis, and other Asians, all of them at 13 percent. For Indians and Chinese, the conditional gaps were 7 and 6 percent, respectively.
Another distinction to consider is between those born inside and outside the United Kingdom. The Bank of England and the ONS have found pay gaps to be substantially larger for foreign-born individuals. The Bank of England estimated the conditional pay gap at 5 percent for UK-born ethnic-minority individuals, compared with 12 percent for foreign-born ones. Possible factors include poorer childhood education, language barriers, lower levels of integration, and weaker employment networks. Interestingly, unlike other labor-market metrics, the conditional ethnicity pay gap has not shrunk appreciably since 2000.13 In contrast, over the same period, the conditional gender pay gap has been declining gradually.14
How ethnic minorities are faring in education, health, and well-being
As in the labor market, the overall picture for measures of education, health, and overall well-being is one of progress—particularly when it comes to education—but with some troubling gaps.
BAME educational performance
What stands out in educational attainment is the generally strong and improving performance of ethnic minorities. This is likely to be one of the reasons for the progress they have made in the labor market.
Most ethnic-minority groups do comparatively well at school from a young age. At six to seven years old, math scores were higher for Chinese, Indians, and other Asians than for white students, while Bangladeshis and mixed-ethnicity pupils were close. Regarding writing, all ethnic minorities except Pakistanis and the other-ethnicity group had higher scores than white students. In reading, all BAME groups scored higher than white students, except for Bangladeshis, who did as well as white students.15
The scores are particularly striking when broken down by household income.16 White students were less likely than any other ethnic group except Indians to live in low-income households, defined as being eligible for free school meals (FSMs).17 Even so, white students scored comparatively low in math, reading, and writing at ages six to seven.18 Moreover, young FSM-eligible children of every ethnic minority scored higher than FSM-eligible white students in math, reading, and writing. Finally, the intra-ethnic attainment gap between FSM and non-FSM students was smaller for all minority groups.
Similar patterns show up in Attainment 8 scores,19 which refer to exams students typically take when they are 14 to 16 years old (Exhibit 5). Only Black and Pakistani students had lower overall Attainment 8 scores than white students, and the difference was small. Chinese and Indian students had the highest average scores. Once again, the results for FSM-eligible white students stand out: they had the lowest average score of any group, with FSM-eligible boys doing worst, by a large margin. Girls scored higher than boys across ethnicities and income groups.20

As for higher education, entry rates for everyone increased between 2006 and 2018, and students from all ethnic-minority groups are now more likely than white students to enter higher education.21 Chinese students were the most likely to do so (66 percent). The recent performance of Black students is particularly striking. In 2006, they were the least likely group to attend university (22 percent); in 2018, at 41 percent, they were third.
The news is not all good. For example, Black students were significantly more likely to drop out of university than white ones in 2015,22 and undergraduate grades earned by all ethnic minorities were lower than those of white students. Almost one in three white graduates obtained first-class degrees, but only one in five ethnic-minority graduates did so in 2018.23 There is no single explanation for these discrepancies, which exist regardless of students’ prior attainment at A-level. However, recent surveys point to, among other things, lack of diversity and role models among senior university staff, as well as institutional and cultural barriers that may disadvantage ethnic-minority students.24
A study published in 2018 also found that employment rates for all BAME groups six months after graduation were substantially lower than for white graduates, and earnings were slightly lower for some. Local area characteristics could account for some of these differences: with the exception of London, ethnic minorities are more likely to live in less prosperous regions, where job opportunities for graduates are fewer.25
Health outcomes and Britain’s ethnic minorities
Ethnic minorities have worse health outcomes than white people on many metrics, and there are significant variations among minority groups. In 2017, the white population had the lowest rate of infant mortality (3.1 deaths per 1,000 live births); Pakistanis had the highest (7.3).26 Infant mortality actually increased among Bangladeshis (from 4.7 in 2006 to 5.6 in 2017) and Indians (from 4.1 to 4.7). However, it decreased among Black infants, falling from 8.0 to 6.8.
Another important health factor is obesity. In 2018, 74 percent of Black adults were overweight or obese; that rate is 11 percentage points more than for white adults, who were the second-most-overweight ethnicity, and almost 40 percentage points more than the Chinese, the least overweight of the groups. These patterns have remained largely consistent since 2015.27 Black people and Asians have higher rates of diabetes than the population as a whole,28 and older Pakistani men have particularly high levels of cardiovascular disease.29 As discussed in the next section, these conditions also increase the risk of dying from COVID-19.30
Compared with white individuals, members of most ethnic-minority groups report higher prevalence of long-term conditions such as chest, breathing, heart, blood pressure, or circulation problems. This is true regardless of age, but particularly so among those at least 40 years old. Bangladeshis, Black adults, Chinese, Indians, Pakistanis, and other-Asians in this age cohort were more likely than white adults to report these conditions.31
Eating habits and physical exercise are relevant determinants of health outcomes. On average, white adults reported the healthiest eating habits, while Black adults had the unhealthiest ones.32 Physical activity shows a similar pattern: Asians (excluding Chinese), Black people, and those of other ethnicity were less active. This holds to a large extent regardless of occupational status, indicating that this pattern is unlikely to be explained simply by income or education.33
Research is at an early stage into the causes of higher COVID-19 mortality rates among ethnic-minority groups. Poverty and other socioeconomic characteristics are likely to be a contributing factor. For example, in July 2020, the age-standardized mortality rate for deaths involving COVID-19 in the most deprived areas in England was more than double the rate recorded in the least deprived areas.34 However, there is also emerging evidence that adjusting for income and other socioeconomic factors explains only a part of the higher COVID-19-related hospitalization rates among ethnic-minority groups.35 The preexisting health conditions mentioned above are likely to be an important factor, but more research is needed to fully understand the complex patterns at work.36
Would you like to learn more about our Public & Social Sector Practice?
Well-being measures and life satisfaction
Mental and physical health, along with job satisfaction and social relationships, are important determinants of life satisfaction. The generally worse physical health among ethnic minorities could help explain why their average well-being—most frequently measured by self-reported life satisfaction—tends to be somewhat lower than that of white people.37 In 2018, there were no ethnic minorities that reported higher levels of well-being than white people; but Bangladeshis, Black people, and those of mixed and other ethnicity reported statistically significantly lower levels of life satisfaction.
However, the trends in life satisfaction and other well-being metrics are positive. Self-reported well-being increased between 2012 and 2018 among all ethnicities and across all four metrics tracked by the ONS: life satisfaction, happiness, feeling worthwhile, and (lack of) anxiety. Moreover, the increase in well-being for individuals in most minority groups has been occurring at a faster pace than for white individuals, so the gap has been closing.
For example, in 2012, the average score for life satisfaction among the white population was 7.5, higher than for all ethnic minority groups except Asian other, Chinese, and Indians. Black individuals reported the lowest life-satisfaction score in 2012 (6.8). In 2018, the score for white individuals had increased to 7.7, and only four BAME groups remained significantly38 less satisfied with their lives—Black individuals (7.3), mixed-ethnicity (7.4), Bangladeshis (7.5), and those of other ethnicity (7.5).
On anxiety, in 2012, white individuals recorded the lowest score (3.0), while all ethnic minorities except the Chinese reported higher anxiety, ranging from the least-anxious Black individuals (3.2) to those of mixed ethnicity (3.5). By 2018, white individuals had reduced their average anxiety levels (to 2.9), but so had everyone else, and by more.
The findings on ethnic minorities’ relative outcomes in education, health, and well-being are important in at least in two ways. First, improving them—and reducing any gaps—is positive in and of itself. Second, they are crucial because they affect people’s ability to prosper. Better-educated, healthier, and happier individuals are also more productive, which increases their chances to engage positively with the labor market, economy, and society.
How COVID-19 is affecting BAME lives and livelihoods
The socioeconomic metrics we have considered—economic, educational, health, and well-being—are all under pressure from COVID-19, which has proved particularly challenging for ethnic minorities. They are more likely to die from the virus, be exposed to it at work, and to work in occupations hard hit by job losses and furloughs.
COVID-19 and ethnic minorities
After accounting for age, members of every ethnic- minority group in Britain are likelier than white people to die from COVID-19.39 For Black men (who have triple the white death rate) and Black women (more than 2.5 times), the difference is particularly stark. Bangladeshis and Pakistanis have the next-highest death rate (more than twice the death rate of the white population), while Chinese and mixed-ethnicity women have the lowest (5 percent and 33 percent more likely to die from COVID-19 than the white population, respectively). These differences partly reflect the patterns in health described in the previous section; many BAME groups have a higher prevalence of preexisting conditions that make COVID-19 more deadly, such as obesity and diabetes among Black adults and cardiovascular disease among Pakistani men.
Britain’s ethnic minorities are also more likely to live in densely populated areas or in overcrowded households, which makes them more prone to contagion.40 Occupational and socioeconomic status also play a role. Except for Chinese and Indian ethnicities, BAME groups tend to be overrepresented in occupations that require proximity to colleagues, customers, or members of the public. This may make them more likely to contract the disease. Some ethnic-minority groups are also more exposed to the virus at work: for example, 27 percent of Black workers are employed in the healthcare sector, compared with 14 percent of all workers.
The COVID-19 crisis does not affect all occupations and sectors equally: some jobs are more at risk than others. Jobs dependent on overseas tourism, for example, are more likely to be hurting than those in the package-delivery or health fields. Therefore, the distribution of jobs among different population groups is an important factor in COVID-19-related job losses or furloughs. Occupational patterns are especially significant because, in the United Kingdom, most of the short-term adjustment has taken the form of furloughs, in which people remain officially employed, making the unemployment rate a poor representation of COVID-19’s impact on the labor market.
Although we lack detailed information by ethnicity on who has been furloughed, two other variables offer a broad sense of how ethnic minorities have fared. One is the physical proximity required to do a job; the other is the percentage of workers who have been furloughed in a given sector.41 To the extent that an ethnic group is overrepresented in an occupation that requires close physical proximity or in a sector with a high level of furloughs, its members’ jobs are more likely to be vulnerable due to COVID-19.
The logic is that people in jobs that require high physical proximity to other individuals will not have been able to work during lockdowns and will likely be slow to return to normal work while physical-distancing requirements stay in place. (There are exceptions to this principle, such as essential workers in healthcare and transport.) Similarly, workers in sectors that have suffered a larger proportion of furloughs have experienced the impact of COVID-19 more severely, and are likely to continue to do so.
According to McKinsey research published in May, people belonging to a minority ethnic group were on average only slightly more exposed than white people to job losses or furloughs due to the pandemic. But when specific ethnic groups are considered, bigger differences emerge.
Some groups are overrepresented in high-proximity occupations and hence are more likely to suffer because of COVID-19 (Exhibit 6). Bangladeshis and those in the other-ethnicity group appear to be most vulnerable to COVID-19-related job losses or furloughs. One reason is that Bangladeshis and other-ethnicity individuals are likelier than others to be in occupations related to textiles, printing, and skilled trades (think tailors, printers, butchers, and chefs). Bangladeshis are more likely to be in sales occupations, such as retail assistants or cashiers. These two ethnic groups are also overrepresented in transport-related occupations.
The same two groups are also overrepresented in some economic sectors with high rates of furloughs and underrepresented in some low-furlough sectors (Exhibit 7). Bangladeshis and individuals in the other-ethnicity group are more likely than average to work in accommodation and food services, which furloughed 70 percent of their workers in the second quarter of 2020. Conversely, Bangladeshis are underrepresented in healthcare, and those of other-ethnicity are underrepresented in education. These two sectors generally require close proximity but had relatively low furlough rates (7 and 10 percent, respectively), because many of their personnel are classified as essential workers.

Pakistanis, Bangladeshis, and other-ethnicity individuals also have higher-than-average rates of self-employment, while all other ethnic groups have lower rates.42 COVID-19 appears to have hit the self-employed particularly hard: the self-employed account for 22 percent of job-support claims, higher than their share of the workforce (15 percent). It doesn’t help that, according to the National Federation of Self-Employed & Small Businesses, ethnic-minority-owned small businesses are more likely to be in less affluent areas and to be in sectors, such as hospitality and transport, that have been particularly challenged by COVID-19.43
Black people stand out for their high representation in caring personal services (15.6 percent, or more than twice the national average) and health professionals (8.9 percent, versus 4.8 percent for all ethnicities). These jobs require close physical proximity but are mostly in health and social care, the sector with the lowest rate of furloughs. Consequently, the health risks are greater, but the unemployment risks are relatively low.
Like Black individuals, Chinese ones face mixed employment prospects, but for the opposite reasons. On average, Chinese workers are highly concentrated in occupations that require low proximity, putting them at lower risk of COVID-19-related job losses. However, they also have a high percentage of jobs (16.7 percent) in the high-furlough accommodation and food-services sector and are less likely than average to work in low-furlough sectors like health care and education.
The evidence suggests that Indian workers are the least vulnerable to COVID-19’s impact on jobs. Indians have high representation in low-proximity occupations, such as those associated with science and technology. Moreover, they are more likely than average to work in low-furlough sectors such as information and communication (12 percent furlough rate), while they are underrepresented in high-furlough sectors, such as accommodation and food services and arts, entertainment, and recreation (70 percent for each) or construction (33 percent).
Coping with COVID-19
Ethnic minorities on the whole are more vulnerable than white people to other forms of economic distress. Take household savings, which are crucial not only to cover basic needs when income falls but also to provide long-term opportunity. According to the Institute for Fiscal Studies, about 30 percent of white and Indian households can cover six months of income with savings; for Pakistanis, the figure is less than 20 percent, and for Bangladeshis and Black households, less than 10 percent.44 Runnymede, an independent think tank, found a similar pattern when it came to wealth. White British households had, on average, the most wealth (£282,000), and Indians were next. Then, however, the drop-off was steep: Pakistanis held less than half this value of assets, Black households of Caribbean descent £89,000, and Bangladeshis and Black households of African descent less than £30,000.45
Another relevant issue is household type. Single-person households are more vulnerable than others to economic shocks because, in the case of income loss, no one else is there to pick up the slack. As for households with dependent children, if parents have economic or health difficulties, these can limit the children’s opportunities. The loss of a parent’s income, for example, may cause the family to not send its children to university.
According to the 2011 census,46 Black and mixed-ethnicity individuals were significantly more likely to live in one-adult households, while Bangladeshis and Pakistanis were the most likely to be raising dependent children. The combination of these characteristics—single adults raising dependent children—is most common among Black and mixed-ethnicity individuals and least common among Chinese and Indians. Considering that 86 percent of single parents are women47 and that the employment gap is larger for ethnic-minority females, the implication is that ethnic-minority lone mothers could be particularly vulnerable to COVID-19-related economic difficulties.
Household overcrowding is another factor to consider, for two reasons. First, living in overcrowded conditions likely increases the chances of contagion. And second, it can exacerbate other difficulties associated with COVID-19, such as mental illness and learning gaps, particularly in times of confinement or semiconfinement. When schools are partially or fully closed, an overcrowded household can create stress and a less favorable environment for students. According to government data, only 2 percent of white people live in overcrowded households, compared with 24 percent of Bangladeshis, 18 percent of Pakistanis, and 16 percent of Blacks of African descent.48
How automation and workplace transformations could affect ethnic minorities
Workforce transitions are an economic constant; they are necessary for countries’ continued development. But they are not painless. Previous work by McKinsey shows that, in general, automation and other trends that are transforming workplaces around the world also tend to create further inequalities. For example, the demand for workers is shifting away from lower-skilled routine and manual jobs to those requiring higher levels of education and more sophisticated cognitive, technological, and social and emotional skills.
What does this mean for Britain’s ethnic minorities? Again, the picture is not uniform.
Based on research analyzing which occupations are likely to be automated and what type of work is likely to be in high demand in the future, some of Britain’s most disadvantaged ethnic minorities could face big challenges. That is because there is a substantial overlap between occupations that have been hurt by COVID-19 and those that were already expected to face difficult employment prospects by 2030—and some BAME groups are concentrated in these jobs. Moreover, COVID-19 could accelerate automation, especially if employing people continues to be cumbersome or costly due to physical distancing.
We base our employment and automation projections on pre-COVID-19 research from the McKinsey Global Institute. Exhibit 8 combines the findings on the degree of employment impact that COVID-19 is having with the estimated automation potential by ethnicity.49

Bangladeshis and other-ethnicity individuals appear not only to be among the groups hurting most from COVID-19 but also to be overrepresented in occupations that are likelier to face reduced employment in the period to 2030, such as in textiles, printing, and other skilled trades. Bangladeshis and Pakistanis are also more likely than average to work in sales and customer-service occupations, which are relatively vulnerable to automation. On the other hand, these three ethnic groups are underrepresented in science, research, engineering and technology related-occupations, as well as in business, media, and public-service professions, where automation potential is much lower.
For Black workers, the picture is mixed. On the one hand, a relatively large proportion of Black individuals work in health and social care and other caring service occupations, such as nursery nurses and home carers. Due to the nonroutine nature of these roles and the importance of social and emotional skills, they are less likely to be automated than other jobs. Workers in these occupations are also among the most likely to participate in job-related training, so their skills are less likely to become obsolete. On the other hand, Black workers hold highly automatable jobs more often than average, such as roles in skilled trades and administrative services.
At the other end of the spectrum, Indians appear to have an easier path ahead given their above-average likelihood of working in health, research, and science, technology, engineering, and mathematics (STEM) fields—occupations characterized by limited automation potential and substantial future demand growth. Based on their current occupational mix, Chinese workers also are well placed for future employment growth, with their strong position in STEM occupations and above-average likelihood of holding business, media, and public-service professional jobs.
It is important to note that these observations refer to averages for entire ethnic groups. There are large differences between the most and least at-risk individuals within each group. For example, approximately 20 percent of Chinese employees are in occupations, such as administrative roles or skilled trades, where 40 to 60 percent of the hours worked today could be automated by adapting currently demonstrated technology.
Overall, the outlook is troubling. The most disadvantaged ethnic minorities—Bangladeshis, other-ethnicity individuals, and Pakistanis—are the most likely to suffer negative labor-market consequences from both COVID-19 and future automation.

COVID-19 in the United Kingdom: Assessing jobs at risk and the impact on people and places
How to accelerate progress toward equality
No single set of remedies can foster racial and ethnic equality; the groups and the individuals within them are too distinct. Moreover, McKinsey research on gender and ethnic inequality (with regard to African-, Asian-, and Hispanic-Americans) has demonstrated the intricate and indelible links between family endowment, education, employment, access to finance, representation, and social attitudes that influence both equality of opportunity and equality of outcomes. This work emphasizes that progress will require addressing deep-seated systemic issues.
The task is daunting but doable. Our recent research on racial justice, while focused on the United States, sets out a wide range of suggestions that also have broad relevance for the United Kingdom. Among them: ensuring that data collection and algorithms include appropriate relative representation of minority groups, broadening access to digital technologies, ensuring employment through targeted job-matching programs, and providing access to liquidity for small businesses and the self-employed. The latter could be particularly useful to ethnic minorities. According to the National Federation of Self-Employed & Small Businesses, the number of ethnic minorities who were self-employed rose 46 percent from 2011 to 2018, twice as fast as for the population as a whole. Black self-employment almost doubled. Moreover, ethnic-minority-owned small businesses were more likely to export and to engage in production innovation.50
Because the agenda is so expansive, we identify a smaller number of priorities that can provide a focal point for action for the United Kingdom. These are far from a full prescription but may constitute a necessary start.
Valuing diversity and inclusion in the workplace
The disruption caused by COVID-19 has put enormous financial pressure on many organizations, testing their commitment to diversity and inclusion (D&I). For example, early in the pandemic, 27 percent of executives surveyed said they were pausing all or most D&I initiatives.51 Others, however, have continued them, apparently concluding that these efforts are too important to put on the back burner.
According to McKinsey’s latest research on the topic, published in May 2020, this divergence was already taking place prior to the pandemic. The report found that a third of the businesses tracked over the past five years have improved both gender and ethnic diversity on their executive teams. Most, however, had stalled or gone backward.
Yet the evidence linking diversity on executive teams to superior performance has never been stronger. For example, a study in the Harvard Business Review found that companies with broadly diverse leadership teams were 45 percent more likely to report growth in market share and 70 percent more likely to capture a new market. McKinsey research has demonstrated a compelling correlation between companies that made gains in D&I over the past five years and these companies’ financial performance. (The links between diversity and success are less proven in the public and social sectors, where benchmarking performance is particularly challenging, but there is no reason to believe that diversity matters less.)
There is also evidence that organizations that prioritize D&I are more resilient and agile. One study that looked at more than 7,500 businesses in the United Kingdom, for example, found that those with culturally diverse teams were more likely to develop new products. Moreover, there is evidence that diverse teams are not only more innovative but also more adept at solving problems, because having variety of different people brings multiple perspectives to bear.
The United Kingdom has made progress, but more could be done. Ethnic minorities accounted for 11 percent of executive team members in the United Kingdom in 2017, significantly more than in 2014 but still short of their share of the population (14 percent). Board representation is just 7 percent. At the same time, McKinsey research has found that companies in the top quartile for ethnic and cultural diversity on executive teams were 36 percent more likely to have industry-leading profitability. And the reverse was also true: bottom-quartile companies lagged behind on profitability.
In short, fair practices and policies toward ethnic minorities are good for business. From a societal perspective, it is crucial that organizations act on this knowledge: some of the largest disparities between the white and ethnic-minority populations in the United Kingdom are related to work. It’s striking—and counterproductive, given the evidence—that such a large proportion of UK companies in 2017 had no ethnic minorities on their executive teams (56 percent) or boards of directors (59 percent).
Employers can help to close labor-market-participation gaps by ensuring fair hiring practices and considering new ways to find underrepresented talent. For some jobs it may be possible to broaden the hiring pool by considering skills rather than more easily tested criteria, such as academic qualifications. Doing so could also help to address the school-to-work transition. To reduce the unconditional pay gap, employers can ensure effective training for all. And to minimize the conditional pay gap, they can identify and eradicate unjustified differences in employees’ earnings.
Practical actions to improve ethnic representation include publishing data on hiring, firing, promotions, and pay and extending job searches to less well-represented groups. The use of advanced analytics can help to appropriately reflect differences in the underlying population and to calculate conditional statistics, such as those pertaining to pay gaps. Training current workers in new skills, particularly in occupations and sectors with large numbers of ethnic minorities, is likely to be both more inclusive and better value for money than firing and then hiring from outside.
All this effort may go to waste, however, unless businesses also consider the more subtle barriers to D&I. Research is increasingly emphasizing the importance of debiasing internal processes, pairing minority employees with mentors and sponsors, addressing microaggressions, and supporting community-based support networks.
Putting inequality at the heart of the recovery agenda
Narrowing racial and ethnic inequalities takes time, persistence, and coordination. The onset of COVID-19—with its disproportionate impact on some ethnic groups—is a reminder of the importance of this agenda. In addition to enabling local governments and communities to deliver targeted interventions, the central government and the devolved administrations of Scotland, Wales, and Northern Ireland need to recommit to addressing both general and ethnic inequalities. This means that policies to “build back better” after COVID-19 need to mitigate explicitly against the possibility of increasing disparities among different ethnic groups.
The equity case for this is clear: in a survey of 2,200 people from the United Kingdom in 2018, more than 70 percent identified strongly with the statement that it is “important that people are treated equally and have equal opportunities.” Two-thirds (67 percent) agreed or strongly agreed that “the government should take measures to reduce differences in income levels.”52 Moreover, history shows that the underrepresented suffer more during recessions. Therefore, it makes sense to direct more attention to those who most need it.
There is also an economic case. The same interventions—in education and the labor market—that help these groups move up the socioeconomic ladder could also increase national employment, productivity growth, aggregate demand, and overall prosperity. The potential benefits are substantial. To illustrate this, McKinsey undertook research on the status of women in the UK workforce and found that if all regions did as well as the best, national GDP could be boosted by 5 percent (£150 billion) in 2025. Reducing ethnic inequality could provide a similar growth dividend, albeit a smaller one.
Building back better requires sustained growth; it is not a stretch, then, to suggest that ethnic inequality be considered a factor in the making and implementation of post-COVID-19 economic policies. Moreover, the national government and devolved administrations are themselves, or directly fund, some of the largest employers in the United Kingdom, such as NHS England, NHS Scotland, and the British Army. The central government therefore has a critical role to play in ensuring that ethnic minorities are fully represented in economic-recovery efforts.
One possible approach is to identify and address specific pain points, such as the choice of careers, transition from education to work, adult training participation, and the conditional pay gap. The evidence is that some groups are structurally more fragile, whether at a given moment in their life journey, or as a result of COVID-19, or in regard to global economic shifts. Building back better means enabling them to fulfill their potential. It is important to note that this principle applies to the population as a whole, not exclusively to ethnic minorities: the lagging academic performance of FSM-eligible white pupils, for example, is troubling.
With rising unemployment and more than 10 percent of the workforce still furloughed as of September 2020, supporting displaced workers—regardless of ethnicity—in upskilling, retraining, and finding stable future employment (for example, through targeted job-search assistance) is an obvious priority. Given ethnic minorities’ lower adult skills and high representation in many fields vulnerable to automation, a focus on reskilling is particularly important. One area to look at is how to help people transition into “gateway” jobs—roles, such as computer help-desk staff, that have proved to be effective starting places from which people can advance into higher-paid positions, such as systems administrators.
At the same time, of course, the government needs to ensure that its broader policies are fair and equitable for everyone. This may mean compiling data on how different ethnic groups are benefiting from initiatives such as the Job Support Scheme, the Self-Employment Income Support Scheme, the Coronavirus Business Interruption Loan Scheme, and the Coronavirus Bounce Back Loan Scheme. The UK government could also improve its reporting of the impact that major policy decisions have on different ethnic groups, as it already does for different household-income deciles.53
Activating players at the local level
Communities and local governments are at the heart of reducing ethnic inequality. The challenges facing ethnic minorities differ for every group, in every location up and down the country. And while the economic trends affecting their livelihoods have a global dimension, experience from other initiatives, such as poverty reduction or child welfare, suggests that community-based integrated interventions are often the most effective. So, for example, initiatives that ensure that minority children do not fall behind in school due to COVID-19 disruption, or programs that equip more women with the skills and confidence to join the labor market, are often best operationalized at a local level.
Research in other contexts also suggests that the lack of trusted information channels and support networks can result in disadvantaged groups being the least likely to benefit from available help. Mobilizing social enterprises, charities, and religious and community groups can help to create effective solutions. This may involve, for example, considering fully the benefits of providing information in multiple languages and identifying upskilling opportunities for individuals whose jobs are at risk. Local governments can make a difference by convening, supporting, and commissioning such groups, tracking their progress, and amplifying best practices. Local authorities will also need to address the specific pressures of COVID-19 on ethnic minorities. This means reducing racial inequality in healthcare, housing, and access to digital infrastructure.
Colleges and universities also play an important role. Even before COVID-19, ethnic minorities were experiencing a less straightforward transition from education to work. To do better, further- and higher-education institutions need to redouble their efforts to promote individual success in areas such as student retention and graduate employment. Supporting young people early on in building their networks with businesses could help continue to close the labor-force-participation gap. This may be especially important among ethnic-minority women, given their significantly lower labor-force-participation.
The economic and social progress of Britain’s ethnic minorities is real. The risk is that the disproportionate health and economic effects of COVID-19 and the looming disruptions due to global economic trends could set it back. We hope that this research helps communities, social enterprises, businesses, and government focus on how to avoid that outcome and, instead, to consolidate existing strengths and accelerate improvements. Tracking progress and collecting data are the essential foundation.
This analysis is only the start. We hope that our work—and research to come—can help to illuminate the issues and enable the United Kingdom to use this moment to recommit to creating a fairer and more prosperous society.
McKinsey is expanding its efforts to deliver change within our firm and to play our part in combating racism and inequality. To do so, we have committed to ten actions.
Related Articles