The struggle to make the most of the world’s resources has many fronts—something worth remembering even as headlines trumpet the supposed end of the “commodity supercycle.” In fact, the vast majority of the world’s manufacturers have a wealth of opportunities to make more money and increase returns to shareholders by using fewer resources. Their full range of options includes maximizing the use of raw materials, minimizing harmful emissions, cutting water loss, and reducing or avoiding waste streams through recycling and energy recovery.1 (For more on the five interdependent beliefs underlying these options, see “Manufacturing growth through resource productivity.”)
Our experience shows that details count. We hope that by presenting some vivid examples of these concepts in action, this article will stir the imaginations of senior leaders about the possibilities for using resources more productively.
Think lean
The lean ideas first advanced in the Toyota production system gave organizations a new way to recognize and root out waste. Applying that same rigor to a specific form of it—energy and materials—lies at the center of resource productivity. (For more on lean and energy efficiency, see “Bringing lean thinking to energy.”)
In practice, these methods often involve following a product through a factory or service operation. That’s known as value-stream mapping, which can be illustrated by a Sankey diagram that highlights streams of resource waste—in this case, the analysis of a familiar process: baking cakes for a school fund-raiser. Exhibit 1 tracks inputs, such as ingredients and electricity for running the oven, as well as losses, such as heat leakage from the oven. Currently only one loss is recovered, and that only partially: apple cores are used to feed chickens. Could the oven lose less heat in baking? Could eggshells be added to garden compost? What if the oven ran on gas instead of electricity or the electricity came from a solar panel whose cost has already been paid?

Think limits
The starting point for most operational-improvement efforts is incremental change: taking an existing process as a baseline and seeing what improvements are possible from that point. For example, an organization might begin with actual consumption and identify ideas to reduce it. As Exhibit 2 suggests, an aggressive approach to resource productivity makes almost the opposite assumption. For any process, the baseline is the theoretical limit: the level of resource efficiency that the process could achieve under perfect conditions, such as a hypothetical state in which it produces zero emissions or if the heat it generates can be recovered.
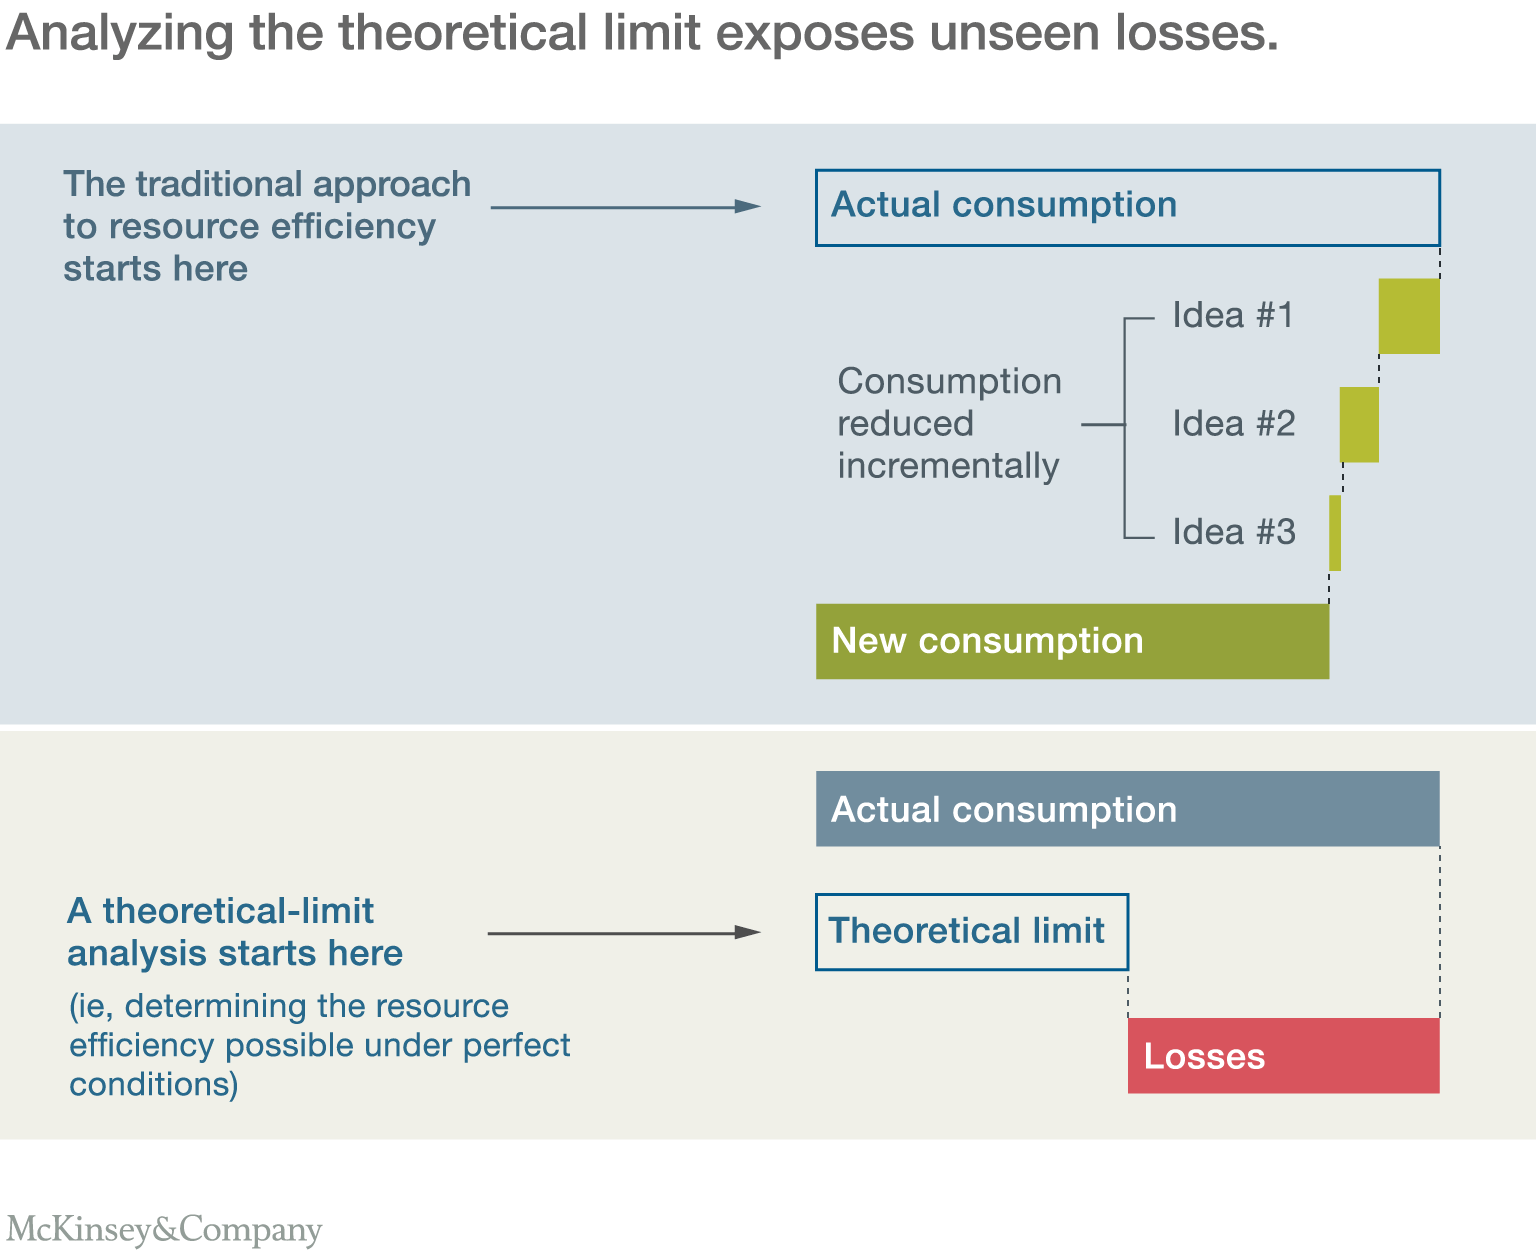
As the bottom part of the exhibit shows, the difference between the theoretical limit and actual consumption is labeled as what it truly is: a loss. Most people, and most organizations, are far more motivated to avoid losses than to reduce consumption. Reframing the problem in this way is therefore more likely to produce major improvement opportunities. An iron and steel manufacturer in China, for instance, followed this exercise and increased the power it generated from waste heat by 25 percent—which alone reduced its production costs by more than $1 per ton.
Think profits per hour
To choose among competing resource-productivity initiatives, companies need a common language for evaluating each idea’s impact and the trade-offs involved. Ideally, an organization would quantify potential savings by using the one metric companies generally care about most: profit. But until recently, inadequate data and limited analytic tools meant that many manufacturers could measure profitability only by the amount of product they generated—euros per ton, for example.
The problem is that profit per ton ignores an essential resource: time. If the same equipment can produce two different products with two different margins, using it to make the low-margin product reduces the time it’s available for the high-margin one. That loss cannot be recovered.
Now that companies can generate the needed analysis, the results are revealing. Exhibit 3 tracks a typical portfolio of products by profitability as a percentage of a company’s highest-margin offering. The x-axis shows each product’s margin on a traditional per-kilogram basis, while the y-axis shows the same product’s margin measured per hour. Most products end up near the same point on both measures. But two of the highest-volume products, shown at the center of the diagram in blue, are less profitable per hour than per ton, while several lower-volume products, shown in orange, are more profitable by the new metric.

That sort of comparison can help companies make crucial resource-productivity choices. For example, in the chemical industry, increasing a product’s yield usually reduces environmental waste but requires longer reaction times and leaves less capacity for other products. If, however, the product’s profit per hour increases by running the reaction longer and improving the yield, the decision to do so is an easy one.
Embrace state-of-the-art analytics
Advanced analytic techniques can multiply the power of profit per hour, helping companies sort through millions of possible interdependencies among variables such as the quality of raw materials, the configuration of equipment, or process changes. Exhibit 4 illustrates how a precious-metals company solved an especially thorny set of questions as it sought to increase yields from its processes. Initially, it found that the optimum yield came from a fairly narrow range of ore grades, but when it examined grades in more detail, it found no discernible patterns.

To understand what was at play, the mining company turned to neural networks to isolate specific days and events when the yield should have been higher. The gray line shows the actual yield, while the green line suggests what the yield should have been. (Arrows indicate points where the deviation was significant and required further investigation.) The analysis showed that increasing the concentration of oxygen in the process offsets the yield loss resulting from a decline of ore grades over the previous year. Thanks to the changed process parameter, the company increased yields (and therefore production) by 8 percent in three months.

Would you like to learn more about our Operations Practice?
Go beyond tools
Approaches such as the ones we’ve described here are only part of the story, of course. Resource productivity also requires a comprehensive change-management effort. Many organizations whose resource projects falter over time rely too much on teaching their employees specific resource-productivity tools and analyses. Success stories, however, change people’s underlying mind-sets so that they “think holistically” (Exhibit 5). Equally important, exceptional organizations support the new mind-sets with revised metrics and more frequent performance dialogues as part of a new management infrastructure. At these companies, resource productivity informs almost every aspect of operations, ensuring that people keep finding new opportunities to create more value from less.

Together, these shifts move organizations away from the traditional take–make–dispose logic: take raw materials out of the ground, assemble them into finished products, and then throw them away. A more sustainable logic is to “think circular,” creating new value for companies and society by looping products, components, and materials back into the production process after they have fulfilled their initial use. (For more on circularity, see “Remaking the industrial economy.”)
Related Articles


Bringing lean thinking to energy