At a glance
- Trade in concentrated products binds geopolitically distant economies. Trade between geopolitically distant economies accounts for nearly 20 percent of global goods trade but close to 40 percent of trade in globally concentrated products—products such as laptops and iron ore for which three or fewer economies provide at least 90 percent of global exports.
- Trade reconfiguration is under way. Since 2017, China, Germany, the United Kingdom, and the United States have reduced the geopolitical distance of their trade by 4 to 10 percent each. The United States has also reduced the geographic distance and diversified the origins of its trade. Meanwhile, economies of the Association of Southeast Asian Nations, Brazil, and India are trading more both across the geopolitical spectrum and over longer distances.
- Increased investment into a range of developing economies suggests further trade reconfiguration in coming years. While roughly 60 percent of greenfield investment has flowed to developing economies since 2010, its destination is shifting. The largest leaps in the past two years were in Africa and India, while announced investment into China and Russia fell by about 70 and 98 percent, respectively, compared with prepandemic averages.
- The future of global trade will involve trade-offs—reducing geopolitical distance comes with increasing trade concentration, and vice versa. We explore two types of reconfiguration. In one, economies shift their trade to more geopolitically aligned partners. As a byproduct, average trade concentration increases by 13 percent and economic growth suffers. In the other, trade relationships diversify so that no economy is highly dependent on another, but as a consequence, the geopolitical distance of trade increases by 3 percent. The degree of trade-off varies significantly across individual economies.
- Business leaders need to position their organizations for uncertainty. This positioning can involve cultivating an insights edge, anticipating and adapting with scenario planning, developing a portfolio of strategic actions, and building geopolitical muscle. Businesses can also embrace cooperation to contribute to, and help shape, the discourse on the evolution of global connections.
Trade reconfiguration has been making headlines. In 2023, Mexico became the United States’ largest goods trade partner. Vietnam’s trade with China and the United States has been surging. European economies’ energy imports shifted dramatically away from Russia, while imports of some products from China, such as electric vehicles, boomed.
Along with such headlines, a new lexicon has emerged among policy makers and business leaders. Use of terms such as “decoupling,” “derisking,” “reshoring,” “nearshoring,” and “friendshoring” in corporate presentations increased more than 20-fold between 2018 and 2022. The subtext of these terms is often geopolitical, which is increasingly a feature of talk about trade. Average tariffs on goods trade between China and the United States have increased between three- and sixfold since 2017. Following Russia’s invasion of Ukraine, the European Union (EU), the United States, and many other players imposed sanctions. A large majority of companies from Europe, Japan, and the United States withdrew or curtailed operations in Russia. The rerouting of shipping lanes due to the Red Sea crisis that started in December 2023 not only incurs additional costs, delays, and security complexities but also has the potential to create far-reaching shock waves beyond the immediate locations affected. More broadly, the number of new global trade restrictions each year has been steadily increasing, from about 650 new restrictions in 2017 to more than 3,000 in 2023.
How can we understand and calibrate these recent changes? Historically, value chains have shifted gradually, and recent years are no exception. No economy has gained or lost more than an annualized two-percentage-point share of global exports in any value chain since 1995. Despite increasing tariffs and restrictions in recent years, that has not changed. But, since 2017, the geometry of economies’ connections has been shifting. We analyze the changing geometry of global goods trade using four measures, each of which has its own limitations: trade intensity, geographic distance, import concentration, and a new measure of “geopolitical distance.” This new measure is the geopolitical analog of geographic distance. It is an imperfect approximation of how geopolitical alignment relates to trade, constructed by looking at UN General Assembly voting records.
These measures in combination help us to calibrate the speed and direction of recent shifts. For example, between 2017 and 2023, US imports became 18 percent less concentrated in their origins. This is a rapid reversal of the trend prior to 2017 of gradually increasing concentration of US imports. China has been increasing its share of trade with developing economies around the world. This has driven a 7 percent increase in the average geographic distance of its trade since 2017, a slight acceleration of the preexisting trend. Germany experienced a 6 percent drop in the average geopolitical distance of its trade between 2017 and 2023, driven by a decline in trade with Russia. However, Germany’s trade with China increased. Meanwhile, the economies of the Association of Southeast Asian Nations (ASEAN), Brazil, and India are engaging in more extensive trade over longer distances and across the geopolitical spectrum.
How this geometry will develop is uncertain. Take Vietnam, which has increased its exports to the United States while deepening its upstream trade and investment links with China. For some observers, the US shift toward imports from Vietnam represents a rerouting of trade from China, with limited value added in Vietnam. In this telling, China and the United States remain interconnected, but supply chains have become longer and more opaque. Seen another way, this shift could be the first step in a journey toward Vietnam emerging as a major global supplier for some goods, adding substantial value across a value chain well beyond final assembly.
The future is not set. But what could further reconfiguration entail? Hoping to bracket a range of futures, we consider two illustrative trade reconfigurations and their potential implications. In one, global trade fragments and “deglobalizes” by shifting to being between more geopolitically aligned partners. In the second, trade becomes more diversified, without a geopolitical lens. Both illustrative types of reconfiguration may involve trade-offs. Trade fragmentation may lower geopolitical risks, but it raises trade concentration and comes at significant macroeconomic cost. Diversification may improve resilience to some shocks and offer opportunity for a range of partners, but it retains ties among geopolitically diverse trading partners.
This paper concludes by exploring how business leaders might consider positioning their organizations for shifts in the geometry of global trade.
The world is deeply interconnected. Recent McKinsey Global Institute (MGI) research found that every major region relies on imports for more than 25 percent of its consumption of at least one type of critical resource, manufactured good, or service. MGI has also found that 10 percent of the value of today’s global goods trade is globally concentrated: three or fewer economies provide at least 90 percent of global exports.
Goods trade profiles vary substantially among economies
Not all economies’ goods trade is alike, and the geometry of their connections matters (Exhibit 1). We have looked at the three largest trading economies in the world, China, the United States, and Germany, as well as the combined membership of ASEAN, which represents the fourth. We have also considered the United Kingdom, as the second-largest economy in Europe after Germany; India, the world’s second-largest developing economy (after China); and Brazil, the largest developing economy outside Asia.
Four indicators capture some of the contours of that geometry. Economies vary in how much they trade in comparison to their size; this is their trade intensity. Economies also vary in their patterns of trade partners, in both where they are, or geographic distance, and how aligned they are on global issues, or geopolitical distance. For geopolitical distance, we introduce an imperfect but quantitative measure based on UN General Assembly voting records between 2005 and 2022 (see sidebar “Measuring geopolitical distance and its limitations”). Finally, economies differ in how broad or narrow their network of supply relationships is, or their import concentration.
ASEAN economies and Germany are highly integrated regional manufacturing hubs
The economies of ASEAN and Germany trade more in goods than many other large economies, measuring trade relative to their GDP. This is partly driven by their integration into regional manufacturing value chains that crisscross national borders. Correspondingly, Germany tends to trade over shorter geographic and geopolitical distances than do other major trading economies, because Europe is relatively compact and politically aligned. This integration between European economies also drives lower levels of import concentration due to extensive intra-EU trade. The United Kingdom is also integrated into regional trade networks, but its economy skews toward services, and it has lower goods trade intensity than Germany, for example. ASEAN economies, by contrast, trade intensively across Asia, which is farther flung geographically and includes countries that span a larger range on the geopolitical spectrum, from Australia to China.
The United States has more distant trade partners and lower trade intensity
The trade intensity of the United States is lower than that of many other large economies for a range of reasons, including the size and endowments of its domestic economy, which enables it to source many products at home. The value of freight between US states was similar in 2022 to the country’s international goods trade. Geography plays a role, too. Less than 5 percent of global GDP is generated by economies within 5,000 kilometers of the United States, mainly Canada and Mexico. By contrast, 26 percent of global GDP is generated by more than 80 economies within this distance of Germany. Not having a dense network of neighboring large economies contributes to the relative concentration of US trade relations and its trade across longer distances than average.
China trades across the geopolitical spectrum
China, the largest trading economy in the world, stands out for trading more with geopolitically distant partners than any other economy. It trades extensively across the globe, including with the EU, Japan, South Korea, and the United States, which in combination account for 40 percent of its total goods trade. As China’s economy has developed, it has come to consume more of what it produces, lowering trade intensity. Its total goods trade in 2022 was equivalent to 35 percent of its GDP, down from the peak of 64 percent in 2006.
Brazil’s trade travels farther than most, with significant volumes going to China
Brazil’s trade travels farther geographically than that of many economies, reflecting intensive trade with faraway China. The strength of this connection also contributes to Brazil’s relatively higher import concentration. Moreover, its export mix skews toward commodities. Indeed, five commodities (from iron ore to coffee) represented half of its exports by value in 2022. Its largest export is soybeans, with a cultivated area the size of Bangladesh dedicated to meeting China’s demand. As a result, its trade intensity can swing in line with commodity cycles, with recent high prices driving an uptick.
India is near the global average in its trade geometry
India sits toward the global average across dimensions. This reflects its broad trade relationships with Asia, Europe, and the United States, which also support relatively diversified import relationships. Its own position toward the center of the geopolitical spectrum—and its trade relationships across this spectrum—results in its trade traveling geopolitical distances that are similar to the global average.
Larger economies tend to trade over wider geopolitical distances
It is a notable feature of today’s trade geometry that some of the largest trading economies in the world, including China, Japan, and the United States, do significant business with economies at the opposite end of the geopolitical spectrum. In 2021, the average geopolitical distance that goods traveled was about the distance between Chile and the United States or China and Nigeria: 3.4 units apart on a geopolitical distance scale running from zero to ten. The trade of many large trading economies travels farther, sometimes substantially so, than this average geopolitical distance—for example, Germany and Russia are about eight units apart (Exhibit 2).
Countries toward the middle of the geopolitical range, such as Brazil, India, and Mexico, also trade over geopolitical distances similar to the global average. Why? Because their trade is mostly with economies at either pole of the spectrum. Overall, only 8 percent of global goods trade flows among economies that sit between two and eight on the zero-to-ten scale. Europe is different; its political alignment and economic integration of individual economies give rise to trade over shorter geopolitical distances. But even Europe has historically relied on geopolitically distant partners for certain critical products, such as Russia for energy resources prior to 2022.
Trade with geopolitically distant partners can be perceived as a source of economic vulnerability. Some economies may rely on geopolitically distant partners’ demand for their exports. If trade frictions arise—as they did in recent years for Australia’s exports of coal, wine, and barley to China, for example—the exporting economy may lose access to key markets. Other economies may rely on geopolitically distant partners for their imports of key products. For instance, although Germany’s average geopolitical distance of trade was lower in 2021 than that of many other large economies, its reliance on Russia’s exports of energy products led to a substantial, and difficult, trade reconfiguration following Russia’s invasion of Ukraine.
Nearly 40 percent of trade in globally concentrated goods is between more geopolitically distant partners
Concentrated trade between geopolitically distant partners may be a candidate for reconfiguration. Today, nearly 20 percent of global goods trade is between more geopolitically distant economies, defined here as more than eight units apart on the geopolitical distance scale (Exhibit 3). And that trade is skewed toward products that are highly concentrated in their sourcing—almost 40 percent of trade in globally concentrated products is between geopolitically distant economies.
Important examples of globally concentrated products traveling above-average geopolitical distances from exporters that are more geopolitically similar to the United States include iron ore, soybeans, and flat-panel-display manufacturing equipment. Iron ore is mainly exported by Australia, with more than 80 percent of its exports flowing to China. And China is the world’s largest soybean importer, with the majority of its imports sourced from the United States and Brazil.
Other products, such as laptops, cell phones, and computer monitors, travel above-average geopolitical distances, as they mainly flow from China to advanced economies such as Europe and the United States (Exhibits 4 and 5). This profile shows China’s role as a global processing hub—almost 20 percent of all flows of globally concentrated products go to China, often as imports of resources or capital goods. And a further 40 percent of all flows of globally concentrated products come out of China, typically in the form of manufactured goods.
Trade in some globally concentrated products is being scrutinized amid perceptions that it may pose higher risk. For example, the United States is looking carefully at its supply security for a type of permanent magnet made with neodymium (a rare earth metal). Germany, South Korea, and the United States all import more than 85 percent of the neodymium magnets they need from China. The magnets are used in a range of applications, from electric vehicle (EV) motors to industrial robots (see sidebar “Neodymium magnets”). As another example, China is exploring new sources for high-purity quartz. The United States is home to the world’s highest-purity quartz, which is required for manufacturing semiconductors.
Reconfiguring trade in globally concentrated products to avoid the risk of reliance on geopolitically distant partners would not be easy. Few alternative suppliers today are geopolitically closer for the importing economy. As such, globally concentrated products may represent a floor below which—at least in the near term—trade between geopolitically more distant partners cannot fall without leading to significant supply disruptions. They are both the ties that bind and arteries of vulnerability.
Historical shifts in the trade landscape have tended to be gradual. Since 1995, individual countries have gained or lost no more than 2 percentage points of annualized global export share in any given value chain. At the global level, despite recent disruptions, shifts in global export share have not moved faster than this historical pace. Since 2017, no economy has gained or lost more than 1 percentage point of annualized global export share in any given value chain.
But has the geometry of these connections been changing? In our four dimensions of trade—trade intensity, geographic distance, geopolitical distance, and import concentration—several meaningful shifts have emerged recently (Exhibit 6). Since 2017, China, Germany, the United Kingdom, and the United States have reduced the geopolitical distance of their trade. The United States has also diversified trade and reduced its geographic distance. Meanwhile, trade intensity for these economies has remained relatively constant, suggesting that reshoring to reduce dependency on critical imports by increasing domestic production has not yet occurred at scale. These aggregate shifts are due to changing trade patterns across the four dimensions (Exhibit 7). ASEAN, Brazil, and India are trading more—across the geopolitical spectrum and over longer distances—growing their participation in global trade with a wide range of partners around the world.
Although nearshoring has been a prominent feature of recent debate, the United States is a relative outlier in shifting some of its trade toward geographically closer partners. Moreover, the extent of this shift is less pronounced than the shift toward geopolitically closer partners. The other economies we analyze show no substantial evidence of nearshoring of trade relations; rather, their trade has often been traveling farther on average. It is a similar story for diversification: while the United States has materially shifted to a more diverse set of trade partners, others so far have not.
US trade is shifting away from China to a range of other countries, including Mexico and Vietnam
The United States has substantially diversified its import share away from China across a range of manufacturing sectors. Vietnam, in particular, and other Asian economies gained share. At the same time, Mexico has also gained US import share, in large part from Japan in transportation equipment and ASEAN in agriculture, a trend indicative of nearshoring. The net effects on US goods trade have been a sharp decrease in concentration of US imports, a 10 percent shortening of geopolitical distance, and a 3 percent reduction in geographic distance.
China’s share of US manufactured goods imports fell from 24 percent to 15 percent between 2017 and 2023. During this period, electronics was the sector with the largest drop in share, from almost 50 percent to about 30 percent. Vietnam experienced the most marked increase in share of US imports in this sector. These shifts have often reflected the impact of increased tariffs on imports from China, but this is not the entire story. For example, laptops and cell phones are not subject to trade dispute tariffs, but China’s share of US imports of these products still fell in 2022 and 2023, with share accruing to Vietnam.
In value-added terms, what the United States imports from China may not be falling so dramatically. In other words, the United States may be importing more goods largely produced in China, which are then rerouted through third countries that contribute a small amount to the final value—for example, simple final assembly. As a result, supply chains may be longer and not necessarily less reliant on China. Between 2017 and 2020, the most recent year for which data are available, China’s share of foreign value added in US final consumption increased slightly, from 24 to 25 percent (Exhibit 8). Laptops are an example. Between 2017 and 2022, US imports of laptops from Vietnam more than doubled, rising by about $800 million. Upstream of this, in the same period, Vietnam’s imports from China of laptop parts, such as printed circuit boards and touch screens, also doubled—rising by about $800 million, too.
Mexico became the United States’ largest import partner in 2023. Its largest share gains were in agriculture and transportation equipment, sectors where China is a less significant trade partner for the United States. Mexico’s share of US transportation equipment imports, for example, rose from 26 to 32 percent between 2017 and 2023. Most of this share came from Japan, which lost five percentage points of share of US transportation equipment imports in this period. However, China’s share in this sector remained stable at about 4 to 5 percent.
Europe’s trade with Russia has collapsed, but its trade with China has grown
Trade between the EU and Russia dropped around 80 percent between February 2022 and September 2023, reflecting the break in relations after Russia’s invasion of Ukraine. UK trade with Russia fell by more than 95 percent. Finding alternative supplies of energy resources became an urgent imperative, and this happened very swiftly. For instance, Russia’s share of Germany’s natural gas imports fell from around 35 percent in January 2022 to less than 1 percent in 2023 (Exhibit 9). Germany’s imports in this sector shifted, notably to Norway, supplemented by liquefied natural gas from the United States.
In manufacturing sectors, Germany’s exports have shifted away from Russia and, often, away from advanced economies in Europe, with increased share to the United States and developing European economies. Germany’s imports, too, have tended to shift away from large manufacturing economies in Europe toward smaller, often developing, economies in Europe—in particular Poland—as well as China.
Indeed, Europe’s trade with China has remained robust. The EU share of imports from China increased slightly, from 19 to 21 percent, between 2017 and 2023. In some sectors, the increase was more substantial. For example, the share of Germany’s imports of electronics from China grew from 24 to 30 percent between 2017 and 2023. This is the sector in which US imports from China declined the most. Similarly, China’s previously small contribution to Germany’s transportation equipment imports rose, driven by imports of EVs. In 2017, 1 percent of Germany’s EV imports came from China. In the first nine months of 2023, Germany’s EV imports totaled about $12 billion, with nearly a quarter coming from China.
As a result of these shifts, Germany’s trade distances increased between 2017 and 2023. Although there were some shifts indicative of nearshoring—for example, Poland gained share of Germany’s imports of electronics, machinery, and transportation equipment—often the import share gained by China in these sectors was even greater.
China’s trade has reoriented further toward developing economies
China has increased its share of trade with geopolitically closer partners, too. This has often been a result of forging stronger trade ties with developing economies and a relative reduction in trade with advanced economies such as Japan, South Korea, and the United States.
Between 2017 and 2023, China witnessed a decline in its share of exports bound for the United States (partly due to trade tariffs), offset by a rise in export share to ASEAN economies (Exhibit 10). China’s imports also shifted—away from Japan and South Korea, and toward ASEAN economies, Latin America, and the Middle East, along with Russia.
As a result, in 2023, developing economies tipped the balance to account for just over half of China’s goods trade, up from 42 percent in 2017. These shifts have tended to be toward geopolitically closer trade partners.
Nickel is an example of an import shifting toward a geopolitically closer partner and becoming more concentrated as a result. China’s imports of ferronickel, used to make stainless steel, from Indonesia have boomed, rising from under $2 billion in 2017 to more than $12 billion in the first 10 months of 2023. Indonesia is geopolitically closer to China than some other economies from which it had historically sourced nickel products, such as Canada. Chinese companies have been active in the development of Indonesia’s nickel industry and in investing in facilities in Indonesia that can process lower-grade nickel into battery-grade products.
There are exceptions to China’s general trend of shifting trade toward developing economies. Australia is an example. Between 2017 and 2023, Australia gained share of China’s imports, driven by iron ore and lithium. By 2023, Australia accounted for more than half of China’s lithium imports and 64 percent of its iron ore imports by value. The interdependence goes both ways. China is the destination for more than 80 percent of these exports for Australia. But this interdependence may become less pronounced in time. Between 2018 and 2021, China invested twice as much as Australia, Canada, and the United States combined to acquire lithium assets. And a joint venture including a range of Chinese and global stakeholders has been developing an iron ore mine in Guinea, which may become the world’s third-largest iron ore exporter.
Recent investment announcements suggest further reconfiguration in the future
Greenfield cross-border investment can be a precursor to a shift in trade patterns. Investment by one economy into another can stimulate increased trade growth between the two. For example, in the case of manufacturing, investment can be a precursor to new flows of intermediate and capital goods between the two economies. The shape of these investment flows today may be a leading indicator of how trade flows will shift in the future.
While roughly 60 percent of greenfield cross-border investment has flowed to developing economies each year since 2010, its destination is shifting. Announced investment into Africa, India, Central Asia and the Middle East, and developing economies in Europe has risen markedly relative to prepandemic averages (Exhibit 11). But announced investment into China and Russia has declined substantially—by 67 percent for Greater China (and 70 percent for Mainland China), and 98 percent for Russia. And advanced economies in Asia, Europe, and North America have experienced increases, too.
Developing economies that have experienced recent increases in investment announcements are often sourcing investment from economies across the geographic and geopolitical spectrum. For example, ASEAN economies have witnessed increases in investment announcements from China, Europe, and the United States. Both China and Europe have announced meaningfully increased investment into Africa, Central Asia and the Middle East, and developing economies in Europe. And while India has seen declining investment announcements from China, total investment announcements into India have surged, driven by economies spanning Asia, the United States, and Europe.
Investment announcements suggest that China’s trade reorientation toward developing economies may continue and that these economies may grow their global exports. On average, in each year between 2015 and 2019, about $50 billion (or 50 percent) of China’s announced outbound greenfield investment was destined for Africa, ASEAN, Central Asia and the Middle East, and developing economies in Europe. Between 2022 and 2023, this figure is on course to double to more than $100 billion, or more than 70 percent of total announcements annually.
In Africa, the region with the largest percentage increase in investment relative to prepandemic averages, investment has generally been destined for a narrow set of economies, mainly in North Africa, rather than the continent more broadly. Morocco and Egypt have seen the largest gains in dollar terms. Morocco, for example, has experienced a surge in announcements from Chinese companies investing in the EV battery supply chain. Excluding North Africa and South Africa, recent announced investment into the continent has been relatively flat. However, conditions vary widely within sub-Saharan Africa. For example, announced annual investment into the Democratic Republic of the Congo, Kenya, and Uganda collectively reached $15 billion on average in 2022–23, tripling relative to prepandemic averages. Over the same period, announced investment into Ethiopia, Ghana, and Nigeria fell by more than 35 percent.
US investment patterns suggest potential further trade reorientation toward ASEAN economies. In 2022–23, announced US greenfield investment into China fell 70 percent from the 2015–19 average, but announced US investment into ASEAN almost doubled. Recent US investment announcements do not yet indicate a sustained nearshoring boom to Canada, Mexico, or indeed Latin America. After a number of high-profile announcements of investment into Mexico in 2022, global announced investment into that economy in 2023 is on course to be about 30 percent lower than the 2022 figure, similar to the average between 2015 and 2019. And an increasing share of investment into Mexico is now coming from China; recent announced investment from China has more than doubled relative to prepandemic averages.
Although Europe’s trade with China has grown recently, investment patterns suggest the potential for a future shift toward economies in intra-European trade. Europe’s announced greenfield investment into China in 2022–23 was nearly 50 percent lower than prepandemic averages. Meanwhile, intra-European greenfield announcements surged, almost doubling relative to prepandemic averages. In 2022 and 2023, Germany’s greenfield investment announcements for economies such as Italy, Portugal, and Romania more than doubled relative to prepandemic averages.
While the geometry of global trade has been gradually reconfiguring, its future shape remains uncertain. One possibility is an increasingly fragmented “deglobalized” world in which trade reorients toward flowing between geopolitically aligned economies. This could be a continuation of the slight decrease in the geopolitical distance seen in global trade over recent years that has, for instance, been linked to the decreasing share of United States–China trade or the rapid reduction in EU–Russia trade. Another form of reconfiguration could involve diversifying trade relationships so that no economy is overly dependent on any other for the products it imports. This kind of trend could be consistent with increased greenfield investment in a diversity of developing economies.
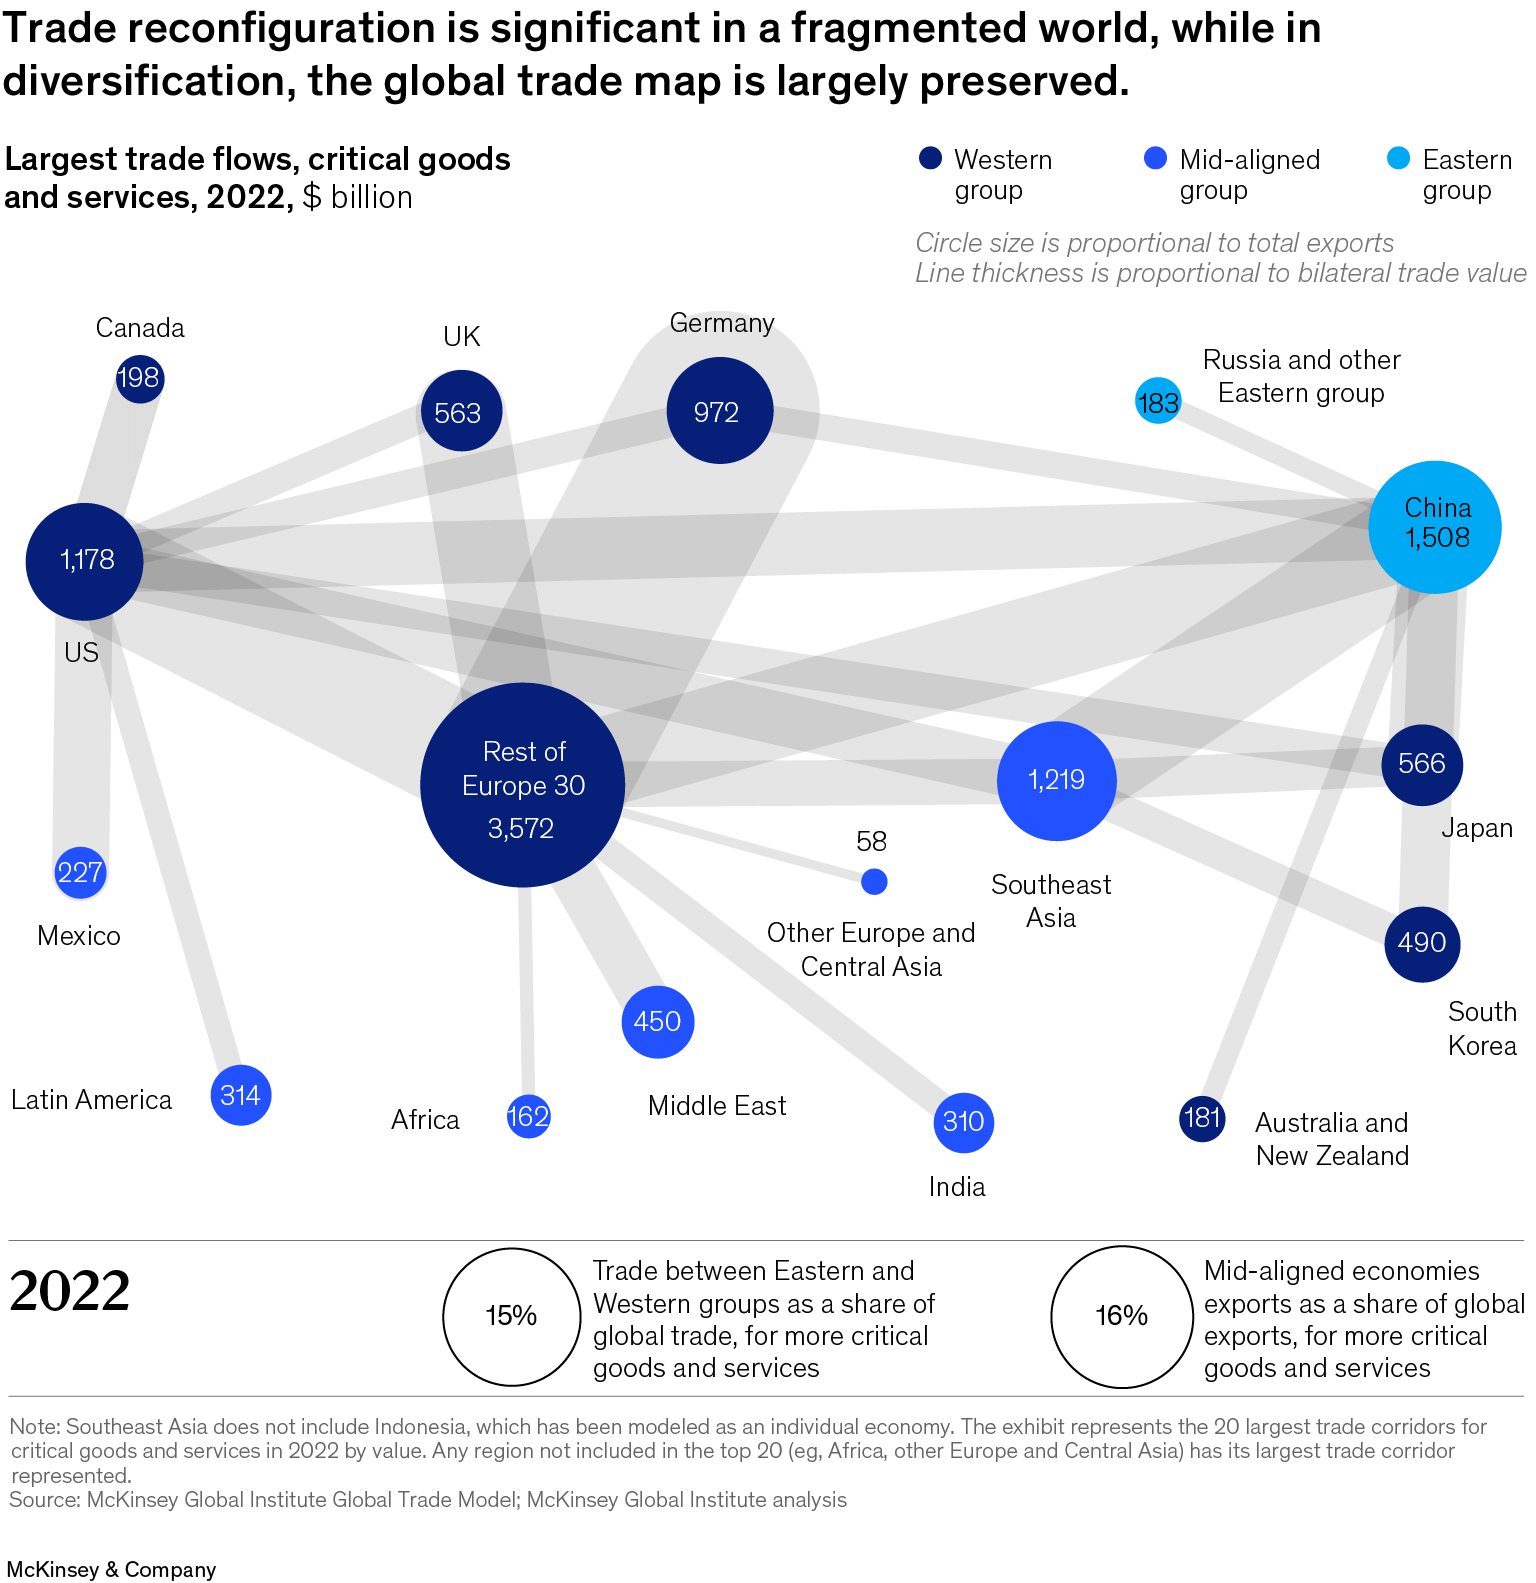
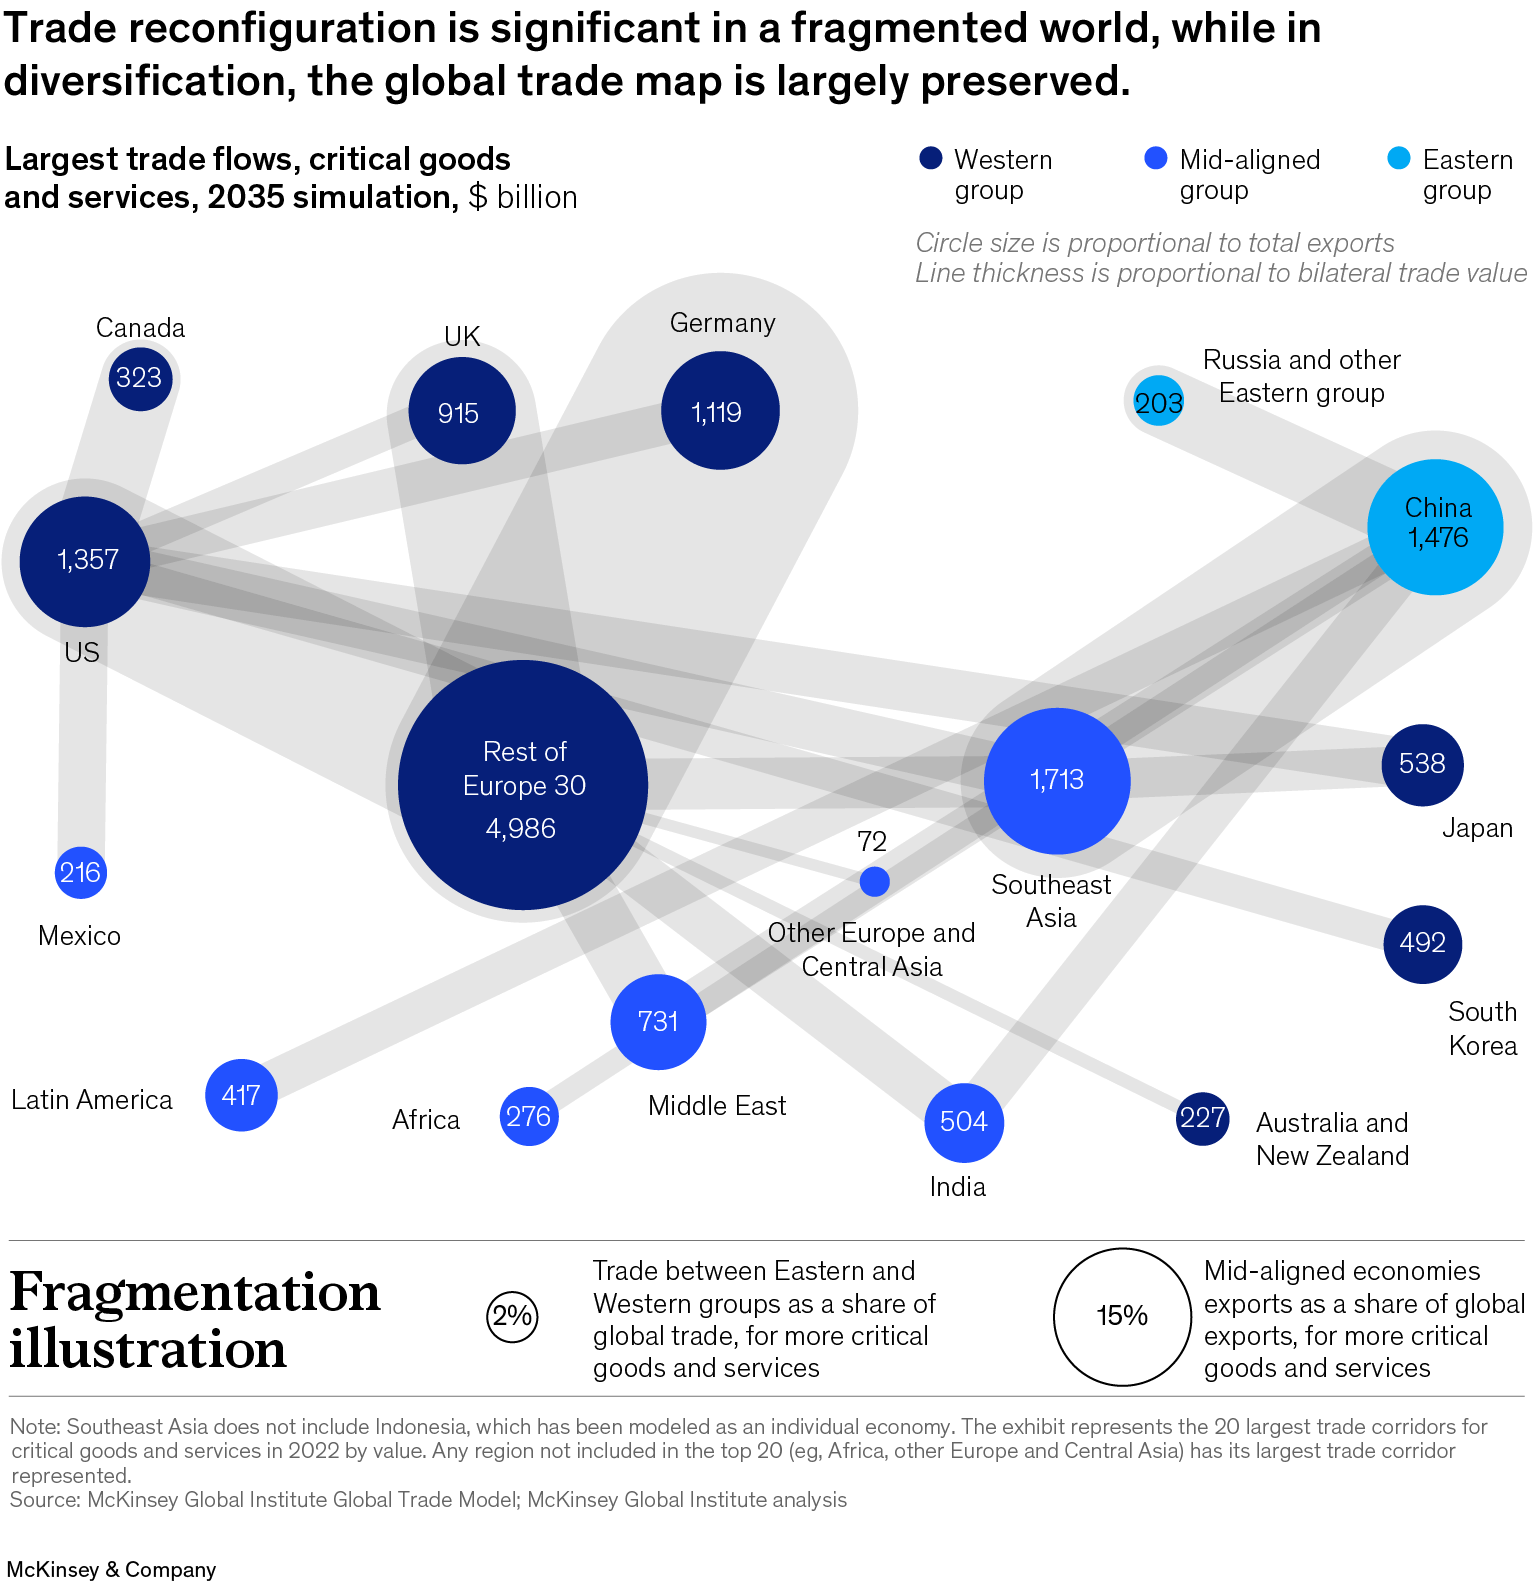
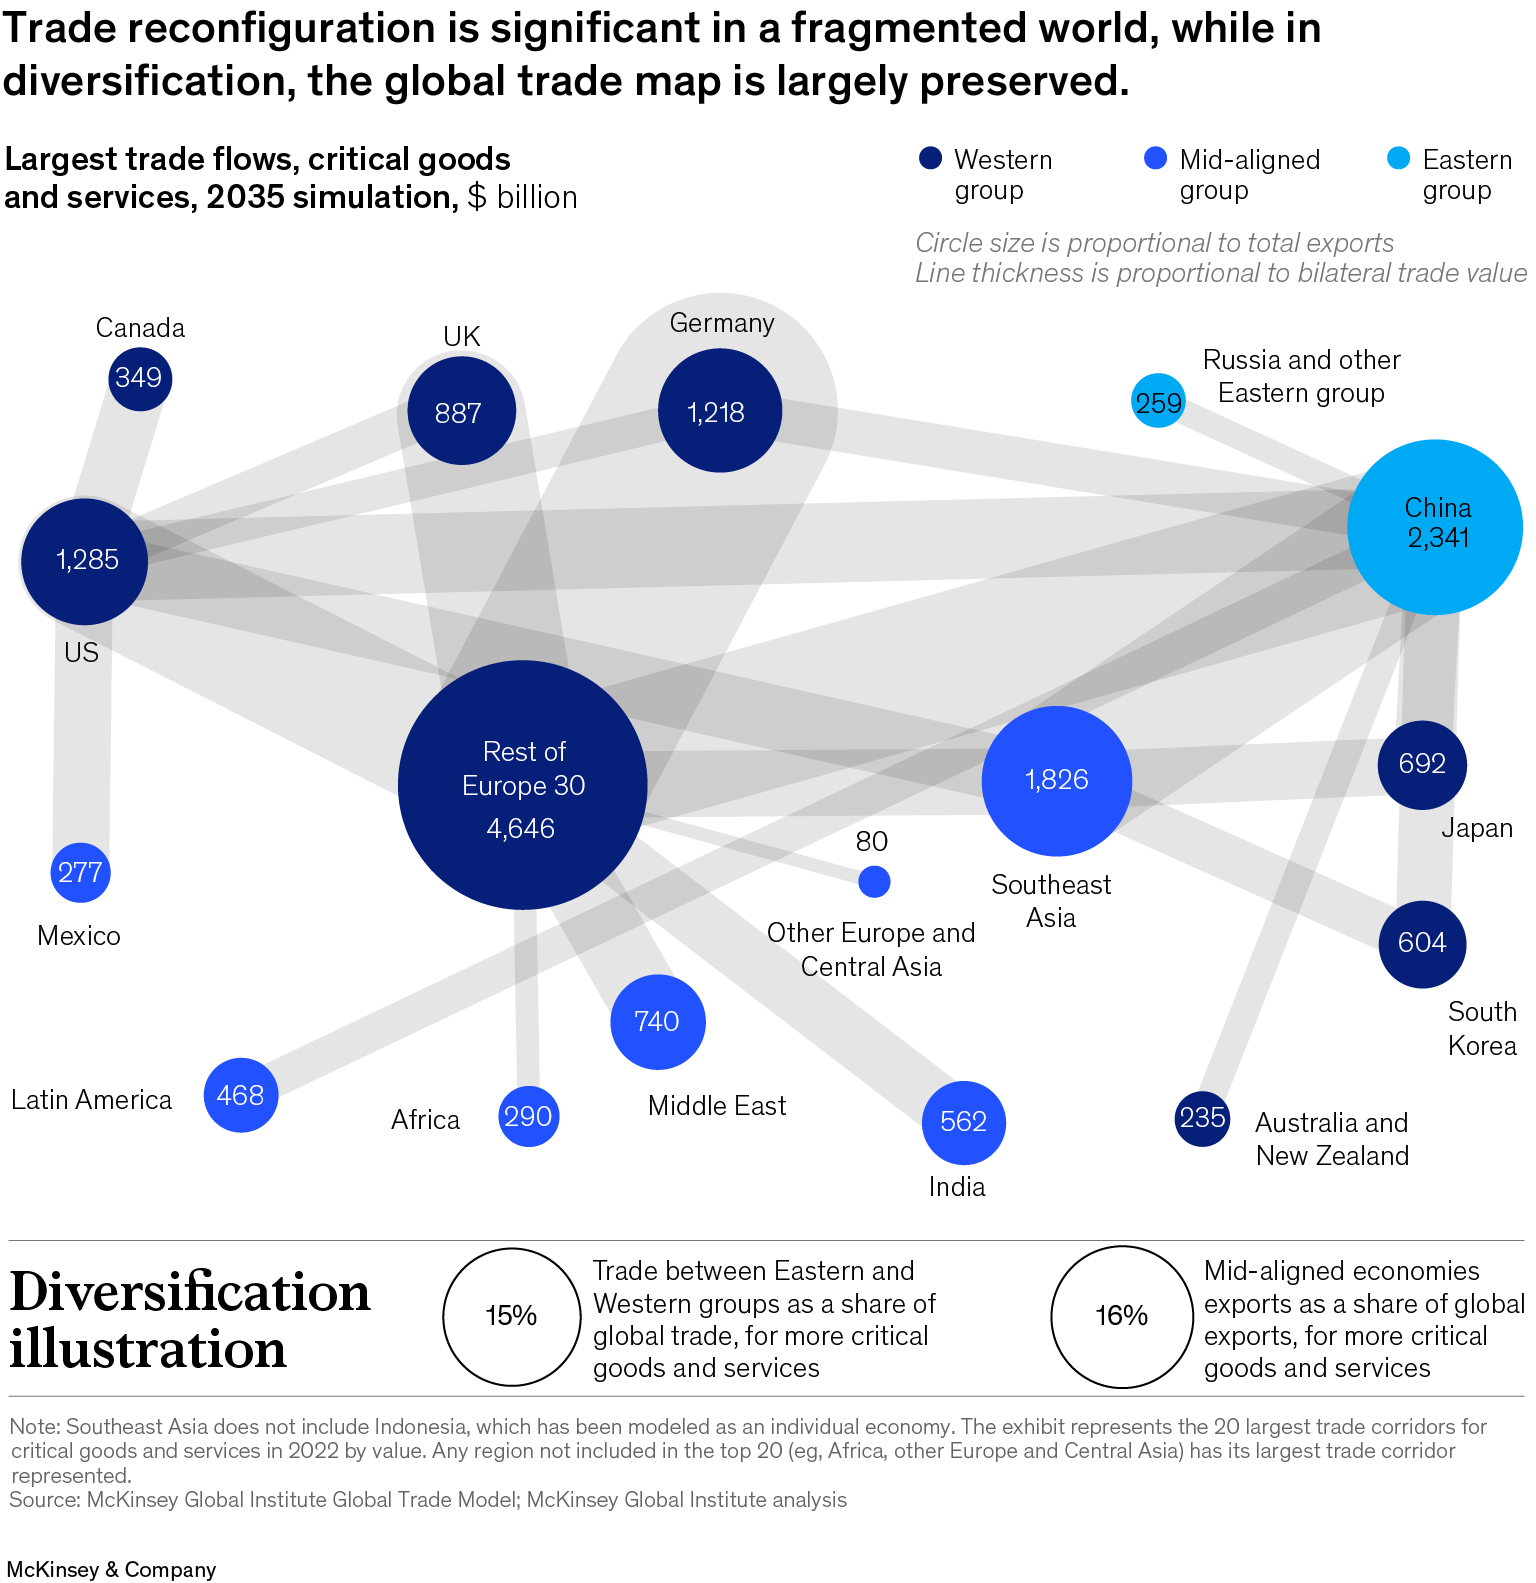
To explore a range of potential economic and trade outcomes, we examined two types of reconfiguration. The first involves a trade fragmentation driven by heightened trade frictions between geopolitically distant economies. The other focuses instead on diversification—that is, reducing import concentration—without a geopolitical lens (see sidebar “Modeling approach and limitations”). Overall trade connections between countries would look very different in a fragmented world but would remain quite similar to today under diversification, with shifts occurring across specific value chains (Exhibit 12).
Fragmentation: Intra-Western trade increases while China strengthens ties with mid-aligned economies
This pattern of change entails radical deepening of geopolitical divides, reflected in significant trade frictions between Eastern group and Western group economies. Both groups conduct nearly friction-free trade with other mid-aligned economies (with some tariffs on critical goods, reflecting spillover of trade frictions).
This leads to a significant drop in trade between the two groups and increased trade within economy groups. In the specific case we consider, the share of global trade that occurs between Eastern group and Western group economies falls by 70 percent to 2035. The value of trade within the Eastern group more than doubles, and within the Western group it increases 40 percent, relative to today.
The global economic impact could be profound, although we note that estimates are subject to substantial uncertainty. In our modeling, long-run global GDP is reduced by about 1.5 percent, with some economies’ GDP falling by 6 percent, without considering spillover effects. Other analyses have found a downside impact on global GDP running from close to zero to 7 percent, with some economies experiencing up to a 12 percent decline in GDP. To put this in context, the impact of the global pandemic on global GDP in 2020 was about 5 percent.
The wide range of estimates is driven by different assumptions and channels of impact considered. Across analyses, the assumed size and scope of trade frictions vary, as do the number and contours of economy groups. Some analyses also consider spillover effects such as reduced technological diffusion, investment, and competition as well as policy uncertainty. When considered, these effects amplify the downside.
Among the different groups, economies in the Western group tend to reorient their trade relations inward. Almost all of the share of trade lost with the Eastern group is picked up by other Western group economies. As a result, the share of Western group trade that is with mid-aligned economies remains similar to today, at about 20 percent. However, the shape of this reconfiguration varies by economy and value chain. For example, in the case we consider, the share of US electronics imports of each of Japan and South Korea doubles relative to today. These economies have comparative advantage in supplying products that China currently exports to the United States. For Europe, by contrast, most of the trade reduction with Eastern group economies is substituted by more intra-European trade.
The picture for the Eastern group is different. Today, almost half of Eastern group trade is with Western group economies. In the fragmentation case we consider, this share falls to about 15 percent. Although there is some trade diversion to within-group partners, the most notable shift is toward mid-aligned economies. These economies come to represent almost half of Eastern group trade, up from just over 30 percent today.
Mid-aligned economies reorient their trade toward the Eastern group. This reorientation is particularly marked in some sectors where Western group economies had been a major destination for Eastern group exports. For example, mid-aligned economies’ share of electrical equipment imports from the Eastern group rises from 34 percent today to nearly 50 percent. As a result, China remains a major global exporter across sectors and the largest trade partner for economies representing one-third of the world by value of trade in both Eastern and mid-aligned groups. Indeed, it remains the world’s largest exporter in 16 out of 43 sectors, as it is today.
Diversification: China loses share in concentrated products but gains in others
This second type of reconfiguration could occur through a widespread shift by companies, across sectors, to diversify their supply. The overall geometry of global trade might be broadly unchanged, but substantial shifts would occur within and among sectors.
The most material shifts occur in relation to China. China loses share of its trade partners’ imports in sectors where it is currently a concentrated supplier, particularly in electronics and textiles, but gains share with other partners and in other sectors. To give an example of the reorientation, the value of US imports of electronics from China (which are concentrated) does not increase in real terms relative to today’s levels, but China gains share in sectors including chemicals and services, leaving the overall US share of imports from China stable to 2035. A similar pattern plays out for other economies, which diversify away from China in some sectors and see increased trade with China in others. Overall, in the case that we consider, the value of flows from China that are diversified to new partners totals about $700 billion, or 12 percent of China’s total exports. This is more than half the value of all global trade that is diversified.
Our modeling suggests that the economic impact of this type of reconfiguration on China may be substantially lower than in fragmentation, with GDP falling by about 1 percent, compared with 6 percent. Global average GDP impact is closer to 0.5 percent, compared with 1.5 percent in fragmentation. While diversification reconfigurations have not been as extensively modeled as fragmentation, analyses by others suggest that derisking selected sectors has a significantly more muted economic impact than fragmentation.
In general, diversified sectors tend to shift to next-best suppliers, with patterns differing by geography. For example, in the transportation equipment sector, Japan diversifies its concentrated imports from the United States, shifting to imports from China and Southeast Asia. Germany diversifies in this sector, too, increasing its share of imports from a range of partners in Europe. In electronics, Southeast Asia gains global share.
In the reconfiguration illustration we consider, mid-aligned economies gain share when they have substantial existing supply relationships, offering an opportunity to scale in diversification. However, mid-aligned economies with less established global supply relationships, such as those in Africa or Latin America, do not experience substantial trade increases. To shift this calculus, which is grounded in existing production capabilities, more mid-aligned economies would need continued differential investment of the sort that our analysis of recent investment announcements suggests may have started.
Both reconfigurations involve trade-offs
Either type of reconfiguration entails trade-offs. Broadly, fragmentation may reduce interdependence between geopolitically distant partners but increase supply concentration and therefore potentially lower resilience to other types of risk, such as natural disasters. It also risks materially lower growth. Diversification may reduce acute points of interdependence for specific goods but will require continued linkages and cooperation among geopolitically distant economies. These broad findings vary substantially by economy groups and within economies. However, the fact of trade-offs holds generally (Exhibit 13).
China: Fragmentation lowers geopolitical distance of trade but also GDP growth; diversification substantially shifts the export mix
In reconfigurations toward either fragmentation or diversification, China remains a globally significant trading economy, but one with meaningfully different trade complexions.
In the fragmentation geometry, in which China reorients from the Western group toward developing economies, it could be less exposed to geopolitical shocks but more exposed to other supply shocks and economic downside. In the illustration we consider, the geopolitical distance of China’s trade falls by 40 percent relative to today. Trade ties with Russia, for example, strengthen—trade between the two economies more than doubles by 2035 relative to today. Ties with mid-aligned economies in Central Asia and the Middle East are strengthened, too, with trade increasing more than 50 percent relative to today. Of course, this assumes that geopolitical distances remain constant, which might not be the case.
As China shifts away from Western group imports, it comes to depend on a smaller set of import partners, significantly increasing import concentration. In this illustration, China’s import concentration would rise by 42 percent relative to today, and for other economies in the Eastern group, the increase would be even greater. At the same time, loss of access to Western group markets would drive substantial economic downside for China under fragmentation. The drop in its trade with Western group economies is not entirely compensated for by expansion into alternative markets, leading to oversupply and deflation. Its trade share of GDP falls 11 percentage points, from 39 percent today to 28 percent. Effects within the economy amplify economic downside in sectors like construction that are not widely traded but contribute materially to domestic economic activity. Indeed, in our modeling, China’s economy is more affected than other large economies in fragmentation, with GDP falling by about 6 percent.
In the diversification geometry, China can divert exports to other partners and gain export share in sectors where it was previously a less significant supplier. This shift often occurs toward mid-aligned economies, contributing to a 7 percent reduction in its geopolitical distance of trade relative to today. China’s import concentration falls by 6 percent. While these aggregated metrics do not change substantially, China’s large industrial capacity shifts from being a source of concentration to being a source of diversification. For example, while China loses global share in textiles exports, it gains in transportation equipment and automotive—sectors for which it was a less significant supplier. This sort of economic reconfiguration may not be straightforward, and there may be more significant short-term economic consequences as China adjusts.
Western group: Fragmentation reduces geopolitical distance of trade, but concentration remains; diversification broadly retains today’s geopolitical distances
In the fragmentation geometry, the average geopolitical distance of Western group trade falls 30 percent. However, import patterns tend to reconfigure rather than diversify. Germany provides an example. Its import concentration increases 6 percent overall as imports shift into an existing network of mainly European partners. While China’s share of Germany’s computer sector imports falls from 18 percent to less than 1 percent, the share of imports from a narrow set of Western group economies increases to about 90 percent. Here a trade-off appears between potentially reduced geopolitical trade exposure and higher supply chain concentration. But this trade-off varies across economies. For example, the United States develops more diversified trading relationships, with import concentration falling 7 percent, suggesting that its resulting network may be more resilient.
Moreover, fragmentation may act as a drag on growth. Reconfiguration leads to not only a loss of export markets but also higher import costs as a result of switching away from Eastern group economies to next-best suppliers. Indeed, recent work suggests that US prices have increased up to 9 percent in those sectors where it has moved away from China to alternative suppliers. However, the Western group has economic mass, representing about 60 percent of global GDP, which enables these economies to develop new suppliers and markets with Western group partners. The overall economic downside in our modeling is smaller for the Western group than the Eastern group. However, lack of exposure to the faster-growing developing economies in the mid-aligned and Eastern groups may narrow this gap over time. Moreover, Western group economies with large shares of trade with the Eastern group today, such as Australia, Japan, and South Korea, experience greater downside.
In the diversification geometry, imports diversify for most Western group economies while aggregate interdependence with China is preserved. However, specifics differ among Western group economies. For instance, concentration of US imports falls by 5 percent and geopolitical distance increases by 6 percent, driven by increased overall trade with China. For electrical equipment, concentration of US imports falls by more than 20 percent. In Germany, by contrast, import concentration changes little, because its trade relations are already relatively diversified. In sectors where it does diversify, trade tends to reorient to a narrower set of intraregional partners plus China. Hints of this can be seen already—between 2017 and 2023, China gained share in Germany’s electronics imports—the same sector where the United States diversified away from China the most. In this illustration, the geopolitical distance of Germany’s trade increases, without being associated with the potential benefits of lower concentration.
Most mid-aligned economies do not experience increased trade participation or accelerated growth in either case—without continued investment
In both illustrations, the average trade intensity of mid-aligned economies falls by four percentage points relative to today. While it is conceivable that mid-aligned economies may gain from their position as alternative trade partners, representing a new source of supply in both fragmentation and diversification, this outcome does not appear in our illustrations.
In the fragmentation geometry, mid-aligned economies reorient to source imports from low-cost Eastern group supplier economies. This drives an increase in import concentration, which rises 13 percent. This increase is particularly marked in sectors for which the Western group had previously been a destination for Eastern group exports, such as machinery and electrical equipment. For economies such as Brazil and India, the share of electrical equipment imports from China rises by 14 percentage points, driving an increase in import concentration of almost 30 percent. However, consumers and businesses in mid-aligned economies may benefit from lower import prices. As a result, the economic impact of fragmentation on mid-aligned economies in our modeling is lower than for the Eastern group and Western group—but fragmentation is not a driver of growth.
In the diversification geometry, mid-aligned economies reduce their import concentration by 18 percent, with potential benefits for resilience. However, the share of global exports from mid-aligned economies does not rise substantially; it remains stable at less than 30 percent. In other words, economies do not diversify toward mid-aligned economies. There are two main drivers of this. First, trade relations tend to be diversified to a range of existing major supplier economies, including Western group economies. Relatively smaller mid-aligned suppliers generally do not gain share. Second, China may be able to gain more export share than mid-aligned economies. As a result, the largely developing economies in the mid-aligned group do not on average see material uplift in trade participation.
A different future that delivers meaningful benefits to mid-aligned economies is surely possible. For example, our analysis of recent investment announcements suggests that India and economies in Africa, Central Asia, and the Middle East may increasingly participate in global production networks. Indeed, the diversification illustration suggests bright spots for mid-aligned economies gaining share in some sectors. However, our illustrative paths suggest that increased trade participation and economic upside are not guaranteed for mid-aligned developing economies in either a fragmented world or the type of diversification we have considered. Additional measures may be needed to achieve improved outcomes for these economies. The measures could include sustained foreign and domestic investment into productive industries, supportive trade policies, infrastructure development, and upskilling of human capital and capabilities as well as institutional enablers.
Given the findings in this paper, how should trade and its potential futures concern business decision makers, especially the leaders of multinational companies (MNCs) that are responsible for about two-thirds of global exports?
The collective decisions of MNCs have already played a significant part in the shifts in the geometry of global trade observed thus far, and they will influence the path ahead through the choices they make on supply chains, production, and markets. In a more fragmented world, companies may operate in, and source from, a narrower range of countries or organize their business in more modular ways, aligning both sourcing and production with end markets. A more diversified trading system is equally likely to reflect the heightened diversification observed in the supply chains of individual MNCs. These are just two of many ways that global trade may change. Business leaders need to prepare for an uncertain world, but they can also contribute to shaping the future geometry of global trade. We suggest five actions to consider.
Establish an insights edge
In the ever-evolving landscape of trade, business leaders need to elevate their baseline insight to gain a competitive edge, developing a granular view of their own company, of other companies, and of the global context in which they are doing business.
For insight into their supply chains, they need to understand connections in detail. Where is their company forging ties with new economies or tapping into previously overlooked sources? They may need to develop deeper insight into the lower tiers of the supply chain, where both geopolitical exposures and globally concentrated products can lurk. Only 2 percent of companies have visibility into their supply base beyond the second tier. Simultaneously, a global perspective on value chains and relevant products is paramount. How do global trade’s shifting dynamics compare with movements in their company’s changing footprint? For instance, some companies shift manufacturing to India and ASEAN, while others intensify operations in China.
Finally, leaders need to monitor the world for tremors that may signal shifts. What changes in key indicators are relevant? It seems clear that geopolitical tensions, trade controls, and regulatory shifts should be tracked, but so, too, should tightness in the labor market for specific skills, for instance, or changing macroeconomic conditions that could affect the attractiveness of production locations and their funding.
Anticipate and adapt with scenario planning
Moving beyond insight to establish a fact-based view, detailed scenarios unveil potential trade shifts and disruptions, emphasizing considerations crucial to the geometry of trade. Key questions arise. Does the scenario affect all or selected trade ties around a group of countries (as is the case in the fragmentation reconfiguration we have considered) or specific ties from a single country (as seen in shifts with Russia)? Is the disruption sudden (as in COVID-19) or gradual (for instance, tariff level increases)? Is it temporary (like the Suez Canal blockage) or indefinitely long? Does it completely halt trade or make it costlier, as import tariffs or rerouted shipping lanes do (like the Red Sea disruption in late 2023)?
Robust scenario planning considers competitors and the broader ecosystem. Should a company expand investments beyond final assembly in anticipation of growth of manufacturing capabilities as more upstream and downstream businesses relocate to a new area? Or should it curtail new capital investments in anticipation of increased export controls from a specific location and the departure of other companies? Leaders need to proactively assess how these shifts will influence competitive opportunities.
Develop a portfolio of strategic actions
A clear information baseline and a suite of scenarios provide the groundwork for action. A proactive set of actions can be pursued in anticipation of shifts, while others can be planned and set in motion by specific trigger points.
Many actions will be specific to a particular company, but some types are broadly applicable.
- Shift supply chains, production locations, or end markets. Such moves require commitment. Businesses can contemplate whether to stay in or exit existing markets to reduce exposure or expand opportunity. They can weigh whether and where to build additional capacity, in established markets or new, smaller ones. For example, a company might consider locating manufacturing or research facilities in a developing market that may become more strategic under some reconfiguration pathways, or it might pursue acquisitions to reshape its global footprint.
- Establish real options. Some actions require initial commitment but offer the opportunity to double down boldly if circumstances merit. They could include investing in new technologies or products that offer an alternative to concentrated, riskier inputs; exploring partnerships or joint ventures to localize in key markets; and developing alternative supply networks.
- Take “insurance” actions. Such actions require limited commitment and may prove to be unnecessary, but they might make a big difference in unlikely but profound scenarios. They could entail holding strategic inventories or executing contracts for backup supply.
Build muscle and bone for navigating geopolitics
Understanding of geopolitical realities is becoming a core capability for the MNC leaders and their teams whose firms face uncertainty in global trade. Executives should develop a grasp of context, nuance, and business implications well beyond what they can learn from news headlines. Approaches include direct recruiting of talent, investing in skills, and continuous engagement on related topics. Boards will want to draw on the latest research and frameworks as well as regular sessions with global experts. And they can learn from other MNCs that are wrestling with similar challenges.
All of this might be described as the “muscle” of executive and board capabilities. Companies also need the “bone” of processes and systems that support geopolitically informed decision making. For example, enhanced instrumentation such as digital early-warning systems and risk dashboards can support timely insights relevant to global trade. Strategic planning processes can formally incorporate geopolitical considerations into strategy and capital allocation.
Embrace cooperation
Even while acting within their own organizations, business leaders can actively seek to shape the future path of trade, identifying how best to navigate some of the potential trade-offs across different regions and sectors, potentially in concert with other stakeholders. They can shape the discourse on shifting trade geometry. A future with more diversified trade holds many potential benefits, not only in the form of resilience to certain forms of supply disruption but also as a way to promote a more inclusive trading system and economy. A broad and diversified web of trade connections will not be achievable without cooperation.
Perceptions of geopolitical and strategic risk and a reconfigured global trade system are clearly much on the minds of business leaders as well as policy makers. Any such reconfiguration takes time in a deeply interconnected world, but even now there is early evidence of change. More may well come. The mid-20th-century American baseball star Yogi Berra has been quoted as saying, “You’ve got to be very careful if you don’t know where you are going, because you might not get there.” In the current state of uncertainty, the imperative for business leaders is to be prepared for a range of potential shifts in the geometry of trade and to have a strategy in place to help shape a new architecture to match an evolving world.
This paper is the latest publication in MGI’s ongoing research on global interconnections. In November 2022, we published a broad study of global interconnectedness in Global flows: The ties that bind in an interconnected world. This was followed in December 2022 by an article focused on concentration in the supply of key products, “The complication of concentration in global trade.” In October 2023, MGI published its new interactive digital guide to world trade—the Global Trade Explorer—which is kept updated with the very latest insights.