As the US economy has evolved, it has shifted from predominantly manufacturing to services. While some of these services industries have made productivity improvements, many lag behind the overall economy. For example, healthcare remains a growth engine for the US workforce but is one of the slowest in terms of labor productivity growth.1 Government is also largely a services industry and offers one of the economy’s largest productivity improvement opportunities.2
For nearly all countries, government represents the largest portion of the economy and is the biggest employer (Exhibit 1). For example, in the United States, government at all levels accounted for about 47 percent of GDP and about 17 percent of total employment in 2020.3 Furthermore, government plays a critical role in society, ranging from building roads to educating youth. In many cases, when the government intervenes, it is necessary because there is no functioning competitive private counterpart.

Moreover, the imperative to capture the government productivity improvement opportunity has intensified. The COVID-19 pandemic put pressure on economies around the world, prompting governments to spend large amounts of money to distribute COVID-19 relief. As COVID-19 moves to an endemic phase, new macroeconomic issues have emerged, most notably a talent shortage, inflation, and high debt-servicing costs.4 For example, in 2022, the US federal government spent the largest amount ever on debt interest, reaching nearly 2 percent of GDP.5 Having to get by with both a smaller workforce and weaker government balance sheets suggest that the need for productivity improvements has increased.
Why has it been difficult to measure government productivity?
The term “productivity” is used in many contexts with different intentions. For example, leaders want to talk to each other about productivity but may use conflicting definitions when they do so, leading to disagreements. For this article, we employed a definition of productivity that economists commonly use to conduct industry-level analyses.1 This focuses on minimizing the inputs required to produce a set of outputs (exhibit).

To understand why it has been difficult to measure productivity in government, it is helpful to first look at how productivity is measured in the private sector. With respect to the equation in the exhibit, in industries such as manufacturing, input and output prices and volume produced are quantifiable. Inputs represent the cost of goods, sales, general administrative expenses, and other such operating costs for goods or services produced. Outputs are estimated by the price a consumer is willing to pay, which accounts for the quality of the good or service, multiplied by the volume. To measure productivity, it is critical to be able to separate price and volume.
When government is involved, inputs and outputs are much harder to measure. Researchers have tried to overcome this problem in a few ways. One approach has been to conduct international comparisons between governments; this offers insight into the productivity improvement opportunity at the national level.2 For example, healthcare spending could be compared across countries, such as the United States and Canada. But these comparisons may be misleading because they do not easily take into account differences in how government delivers these goods or services, and the resulting need for more or less spending. Continuing with the example, the largely public, single-payer healthcare system in Canada may not need as much money as the market-based models in the United States. This approach also tends to exclude state- or local-level comparisons.
Another approach has been to dive deeply into a set of government organizations and develop specific metrics. For example, to examine the efficiency of public-health initiatives, some efforts have tracked microlevel operational metrics, such as house visits by individual healthcare workers.3 These can be helpful to the extent that the metrics are operationally focused. The challenge with this approach is that it is hard to aggregate up to the total opportunity across the government.
In our view, these two approaches are directionally correct but are each incomplete. Neither provides a comprehensive road map for the government to measure productivity improvement opportunities across the full range of functions it provides.
Further, when estimating productivity for government, it is important to separate efficiency from effectiveness. Productivity as defined in this article is related to the creation of goods and services; this is efficiency of production. The government also sets policy, the assessment of which concerns questions of effectiveness. While efficiency is tied to specific, measurable units (that is, detailed outputs and inputs), questions of effectiveness focus on how outputs translate into desired policy outcomes, such as shifts in wealth among population groups. Effectiveness is outside the scope of this article.
In this article, we set out to estimate the size of the US government’s productivity improvement opportunity. We defined productivity as operational efficiency; other researchers have focused on policy effectiveness (see sidebar “Why has it been difficult to measure government productivity?”). We quantified the US government productivity improvement opportunity by level—federal as well as state and local—and category, such as healthcare or road transport.
Overall, we found a $725 billion to $765 billion productivity improvement opportunity—that is, roughly $750 billion annually that could be saved while keeping government services operating just as effectively. This would be equivalent to more than $2,000 per resident. About 60 percent of the total was at the state and local level. Across categories, about 40 percent of the opportunity was in healthcare; 9 percent was in primary and secondary education.
We also converted this opportunity into an operational framework that could aid government organizations in determining what actions to take. Based on our experience with hundreds of public- and private-sector organizations, the framework suggests that operational challenges lie in an organization’s ability and motivation to improve.
We recognize and acknowledge that a variety of civic compacts shape how governments set priorities, and thus governments have fundamentally different imperatives than those of the private and social sectors. Government organizations may make productivity trade-offs in service of those institutional imperatives. In this report, productivity is the focus, but it is just one way of evaluating government activity.
The US government productivity improvement opportunity
To estimate the US government productivity improvement opportunity, we used a previously published approach by the McKinsey Global Institute and adapted it to conduct a country-specific analysis.6 This approach accounts for both cost and quality and is applied to the federal level and the state and local level. We centered our analysis on five core government spending categories in which cost and quality data were readily available: healthcare, road transport, primary and secondary education, higher education, and public safety. We then used these estimates to scale across the remaining categories of government spending.
We based our analysis on 2020 government spending data. That year, after accounting for intergovernmental transfers, governments in the United States spent $9.9 trillion, of which approximately 58 percent was at the federal level and the remaining 42 percent was at the state and local level (Exhibit 2).7 Of this total, about 42 percent was either unspecified or could not be further optimized in terms of operations, such as paying interest on debt or Social Security payments. This type of spending was excluded because it is not related to efficiency of production but is more commonly related to policy effectiveness, which was not in the scope of this article. As a result, our analysis focused on $2.3 trillion of government spending at the federal level and $3.5 trillion at the state and local level.

How we measured the US government productivity improvement opportunity
Previous McKinsey research established an approach for estimating the government productivity improvement opportunity.1 This approach focuses on operational efficiency and quantifies the opportunity based on variation in quality and cost per unit.2 In this article, we adapted this approach for the United States, analyzing the opportunity at the federal level and at the state and local level.3 We broke down spending into six categories: healthcare, road transport, primary and secondary education, higher education, public safety, and “other.”4 In 2020, the five core categories (excluding “other”) represented 22 percent of federal spending and 62 percent of state and local spending.
We used two methods to estimate the productivity improvement opportunity related to operational efficiency for each core category. We began by estimating cost per unit, which was equal to spending divided by a given unit. For each state’s costs, we normalized for wage differences. To do this, we first estimated the ratio of the state’s average wage to the national average. Because the amount of labor for each category will differ (healthcare tends to use more labor, while transport likely uses less), we assumed labor was half of costs and therefore applied half of the wage difference. In addition, a different denominator unit was used for each core category, such as enrolled student body in higher education and total lane miles for road transport.5
For the second method, we added a quality metric to the output measure, such as six-year graduation rates for higher education or violent-crime rates for public safety.6 For state and local spending, data constraints limited us to only state-level metrics, but we applied them to local spending as well.
The following are the methods we used to arrive at the estimates reported in Exhibit 3:7
- Method one. States were ranked based on their cost per unit. States above the median cost per unit were brought down to the median. The rationale for this method was that regardless of quality of the output, the lower-performing states could become more cost efficient (Exhibit A).
- Method two. States were ranked based on quality of the output and then broken into quartiles. Within a given quality quartile, states above the quartile median cost per unit were brought down to the quartile’s median. The rationale for this method was that states with similar quality could more realistically achieve a similar cost per unit (Exhibit B).


The “other” category accounted for 38 percent of state and local spending and 78 percent of federal spending. We excluded unspecified areas or areas that could not be further optimized in terms of operations. This represented 47 percent and 78 percent of the “other” category, respectively. Examples of this spending included state and local insurance trust expenditures and interest on debt.
For the remaining portion of the “other” category, we associated each subcategory with one of the five core categories based on how closely they might be related. Examples of these subcategories included utilities and sewerage.8 The core category’s productivity improvement opportunity percentage was then applied to the subcategory’s spending.
To understand operational challenges the US government may be facing in capturing this opportunity, we used another published framework that addresses how to improve public-sector productivity across five operational focus areas: ability to experiment, ability to sunset outdated infrastructure, existence of feedback loops, existence of incentives for goods or services improvement, and existence of budget constraints for consumers.9 For each operational focus area, there are several improvement interventions that government leaders can pursue based on our experience with public-sector organizations. For each intervention, we estimated net savings based on observed organizational results. Interventions were then grouped against operational focus areas, and the total net potential savings were estimated. This provided a perspective on the relative importance of a given operational focus area, based on the previously deployed operational framework that we used (Exhibit 4).
The methods used to measure the productivity improvement opportunity related to operational efficiency have limitations. First, the approach quantifies the opportunity based on variation due to efficiency of production, not need. For example, if two states have different rates of obesity, the need for healthcare spending will inherently be different. As a result, it may not estimate what the “appropriate” amount of spending should be. In addition, this approach does not account for structural differences between states. The approach assumes each state can reach the cost per unit of another state. However, if, for example, it costs more per lane mile for a rural location than an urban location, a state like Alaska may never reach the same level of efficiency as a state like Rhode Island. We attempted to adjust for part of this discrepancy through the wage index normalization. In the next article of this series, we will dig deeper into ways to address these limitations as we focus on how to operationalize interventions against the productivity improvement opportunity.
We then estimated that the US government productivity improvement opportunity is $725 billion to $765 billion, adjusting for wage differences across states (see sidebar “How we measured the US government productivity improvement opportunity”). About 60 percent of the total was at the state and local level, with nearly a third of the opportunity in healthcare and about 15 percent in primary and secondary education. Of the remaining 40 percent at the federal level—$285 billion to $295 billion—about 50 percent of the opportunity was in healthcare (Exhibit 3).

From opportunity to action
We also sought to offer insight on how government leaders could capture the productivity improvement opportunity. To do so, we used a previously developed operational framework that lays out how the public sector could pursue productivity improvements (Exhibit 4).8

At its core, the framework seeks to identify challenges related to an organization’s ability to improve compared with its motivation to improve in the government setting. We found that more than 60 percent of the opportunity was tied to an organization’s ability to improve. There are two important operational focus areas. The first is an organization’s ability to experiment, which allows organizations to implement interventions such as improving processes and optimizing governance. The second is the ability to sunset outdated infrastructure, a tactic that is being employed across industries today with tools such as artificial intelligence. The inability to do this can, for example, prevent the better use of IT and automation.
A government organization’s motivation to improve accounts for the remaining 40 percent or so of the opportunity. The largest operational focus area, representing more than 60 percent of the motivation opportunity, is associated with feedback loops. This refers to organizations receiving feedback on their goods or services from consumers. Proven interventions include enhancing consumer experience, which is rapidly expanding in adoption across the public sector.9
Another operational focus area related to motivation is the existence of incentives for goods or services improvement by employees. In this case, example interventions include hiring the right talent or aligning leadership on organizational outcomes.
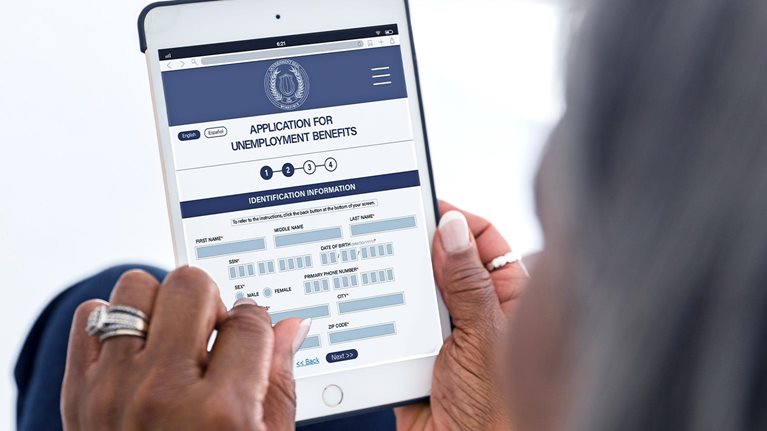
A third motivation-related operational focus area is how to overcome a lack of budget constraints for consumers. In many cases, consumers have no choice but to deal with a government organization, such as when obtaining or renewing a driver’s license. Unlike other purchasing choices, such as trading off between how much food or entertainment to purchase, these government products and services are necessities, creating no motivation to improve. Reframing the consumer’s budget from cash to another metric, such as time, can generate this motivation, such as providing faster self-service options for renewing a driver’s license.
For many years, policy makers, organizational leaders, and researchers have discussed—and often largely dismissed—capturing productivity improvements in government. Using a definition and approach focused on operational efficiency, we estimated a potential $725 billion to $765 billion opportunity. We found that more than 60 percent of the opportunity could be captured by providing organizations with a greater ability to improve; the remainder could be captured from motivation. In the remaining articles in this series, we will break down the roles that government plays to better identify approaches on how to improve productivity at the organizational level.
This article is the first in a series on the US government’s productivity improvement opportunity.