The AI revolution is entering a new phase, as the focus shifts from what technology can do to how it can create real value. By 2030, an estimated $7 trillion in capital will have been invested into AI infrastructure; to justify that investment, the technology needs to generate roughly $760 billion in annual profit pools. New AI businesses, products, and services will contribute significantly, but much of that value will have to come from how enterprises use AI to fundamentally redesign work and improve productivity.
Many organizations, however, are still measuring AI adoption instead of value. They track users, copilots deployed, and tokens consumed. These show how much AI is being utilized and whether it’s technically capable of taking on certain tasks or activities. What they don’t show is if AI is creating economic value in the process. At a time when more and more enterprises are grappling with the suddenly rising costs of using AI, they face a pressing question: whether and where AI can perform or support certain tasks at an acceptable quality and sustainable cost, and in the process allow people to focus more on higher-value work.1
The AI value curve helps answer that question. Our proprietary analytical tool examines the economics of applying AI-driven automation or augmentation to existing work, rather than the full range of enterprise value the technology can create. Building on McKinsey Global Institute (MGI) research into the automation potential of generative AI, the value curve provides an economic lens to assess where that potential can be deployed cost-effectively. By combining that research with labor costs and the full cost of AI-enabled work, the tool identifies where AI can be deployed economically across industries, occupations, and regions. It can also be adapted to examine the opportunity within individual companies. While there is inherent uncertainty in our current estimates given the broad range of possible outcomes associated with some of the underlying assumptions, a clear direction of travel is emerging (see sidebar “About the research”).
Since every job in any sector is at its core composed of many different tasks, our analysis focuses on the mix of tasks, not entire occupations, against which AI can currently be deployed cost-efficiently. The curve compares the cost of completing a task today with the full cost of completing it using AI. This includes model and token costs as well as any human review, validation, and rework required. A related way to frame these economics comes from David Tepper, CEO of Ascerta (formerly Pay-i), who argues that an agent creates value when its probability of success exceeds the ratio of the time required to verify its work to the time required for a human to do the work directly.2 The value curve applies the same underlying logic at scale: identifying where the cost of AI, including the human effort required to review and rework its outputs, compares favorably with the cost of performing the work today.
The AI-enabled workflow may still involve human judgment, review, validation, correction, or escalation, but AI transforms the mix and amount of human work required. Where that transformed workflow delivers an acceptable-quality outcome at a lower effective cost, the resulting productivity value is captured in the curve. One of the clearest findings is that some of the strongest AI economics come from augmenting high-skilled, higher-wage work—not simply from applying AI across the largest volumes of lower-wage work.
As a result, it shows that certain sectors, occupations, and regions hold more potential AI value than others at this moment; in some, applying AI to that work is currently more expensive than the status quo at today’s wages, though as AI capabilities improve over time, a broader range of activities will be addressable by it. By identifying the tasks where it makes the most economic sense to deploy AI, we estimate the annual global economic opportunity in transforming work through AI automation or augmentation to be worth $2.52 trillion.
The distribution of AI value, however, matters as much as its total size. Significant opportunities often lie in two different areas: where AI can improve and help support large volumes of routine work, and where it can help highly skilled professionals across sectors spend more time applying expertise and judgment. That is part of the reason healthcare, education, and government can hold similar value creation potential as financial services and technology. The key is the combination of scale—where large volumes of work can be automated or augmented—and high-value professional roles, where the economic return from freeing people’s time is greatest.
The AI value curve also shows that AI economics are local, not global. Because labor costs differ from country to country, the same AI use case can have very different economics across markets. A use case that is economically attractive in one market may offer a smaller or even negative cost advantage in another. Companies therefore need to account for local economics when assessing where AI can create value.
Those that don’t pay close attention to AI’s fluctuating cost could also be at a loss. Today’s AI economics are far from fixed. It takes only a modest move in the cost of AI to swing the value pool sharply. A 30 percent shift in AI costs, relatively small given the range of recent price movements, changes the US value pool by roughly $320 billion. More-affordable AI brings more work into range; costlier AI takes it back out. Every AI investment should therefore be tested under both lower- and higher-cost scenarios before it is scaled.
For leaders, certain implications of our research are clear: identify and map where AI creates value, size the opportunity, stress-test how sensitive it is to changes in AI costs, and focus first on the strongest business cases. An underappreciated critical issue to consider and plan for, though, is how the mix of tasks within each job changes, what new roles emerge, and what organizations do with the the people whose work AI reshapes.
For companies as a whole, these findings are best read as a directional map of where agentic AI economics may be most attractive, rather than as a company-specific forecast. The economics of the same role can vary materially across organizations depending on factors such as local wages, task mix, token consumption, adoption effectiveness, and non-token costs, including human review, rework, and governance. Some occupations will therefore be inherently more amenable to agentic automation than others, while the realized value will depend on how effectively the technology is deployed. Companies can use these results to identify where to investigate first, before recalibrating the analysis using their own workforce and cost data.

The new economics of AI
What the value curve reveals by industry
The industry value curve shows the sectors where current AI economics indicate greater potential for economically viable deployment (Exhibit 1). That distinction is important; the potential value only includes tasks within occupations for which the use of AI is estimated to be economically positive, not entire occupations or sectors. The height of each bar represents the average cost advantage of AI over human labor. This AI-enabled value advantage (dollar amount per hour) is the fully loaded hourly cost of human labor less the hourly cost of AI performing the same work; it is positive wherever AI is more economical than the current way the work is performed, after taking into account the human work required to verify and check AI outputs. The width represents the volume of economically automatable work within occupations. Together, the area of each bar shows the total economic value at stake.
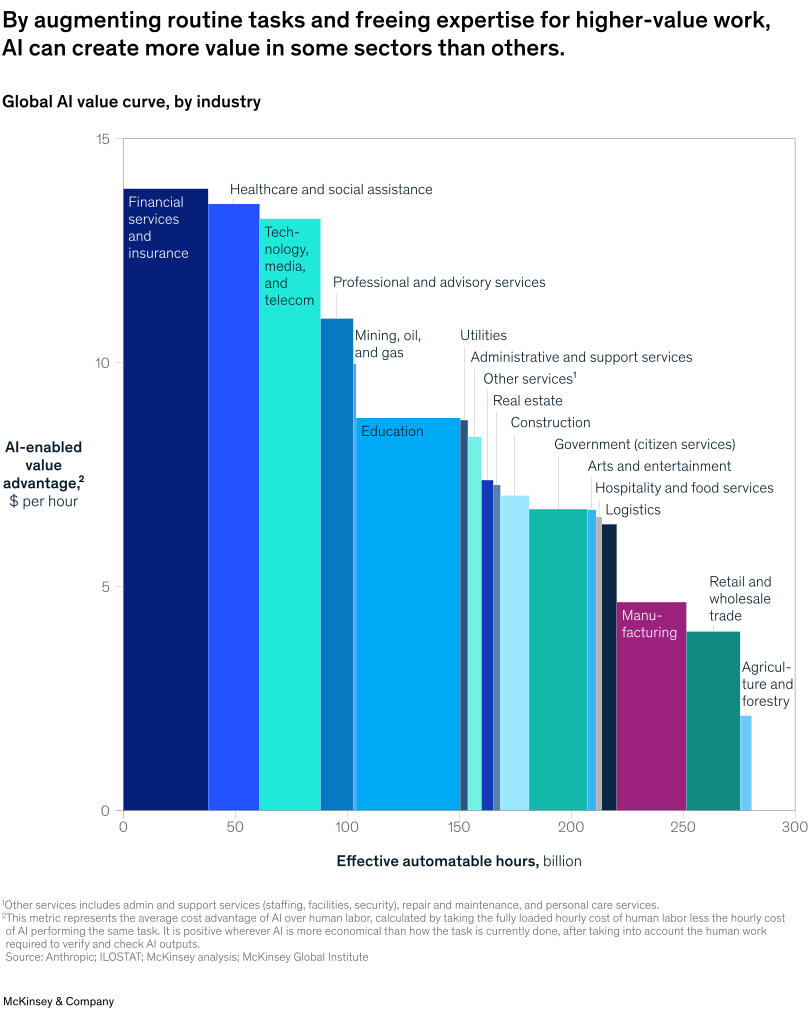
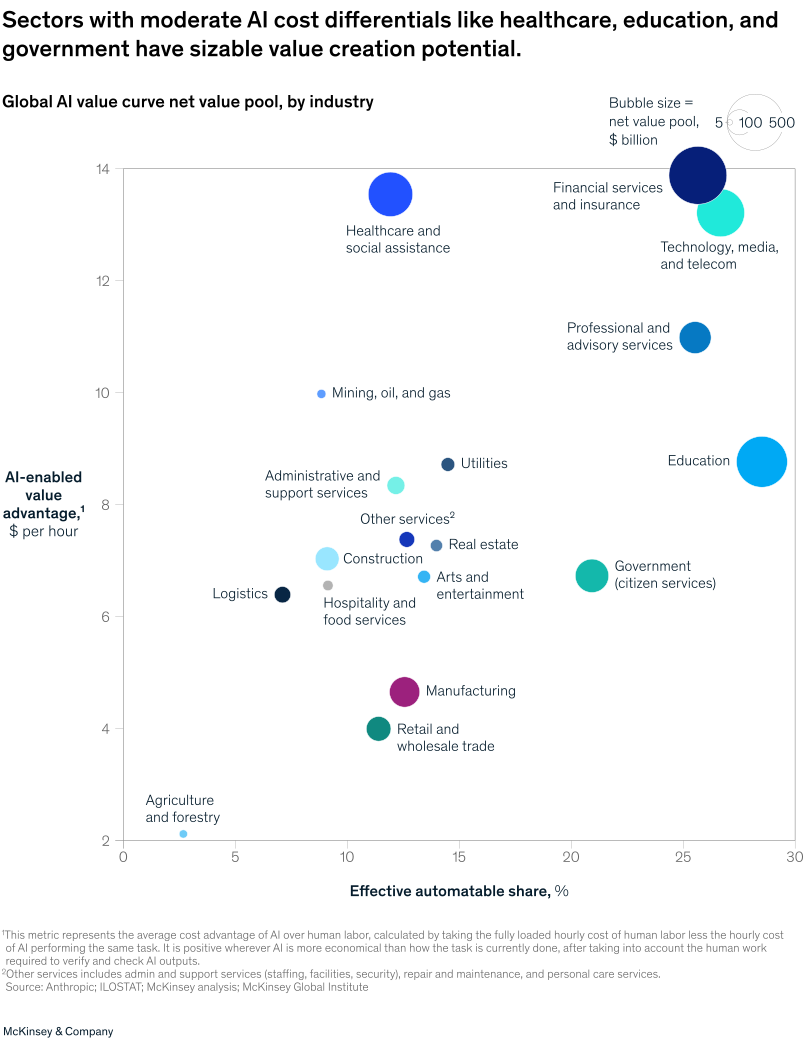
The distribution is striking. Financial services ($530 billion) and technology, media, and telecom ($360 billion) exhibit the largest AI cost advantage, which is a result of both the number of roles where AI is relevant and the value AI can provide to people in those roles. But the value curve also shows that sectors with more-moderate individual cost advantages also have substantial opportunities for AI-driven value creation. For example, education ($410 billion) and healthcare ($310 billion) account for sizable portions of the value pool not because AI delivers the greatest per-task savings, but because even modest productivity improvements can translate into meaningful gains across large, service-intensive workforces. Those gains could come from reducing administrative burden, expanding people’s scope, or enabling professionals to devote more time to higher-value activities (Exhibit 2).
What the value curve reveals by occupation archetype
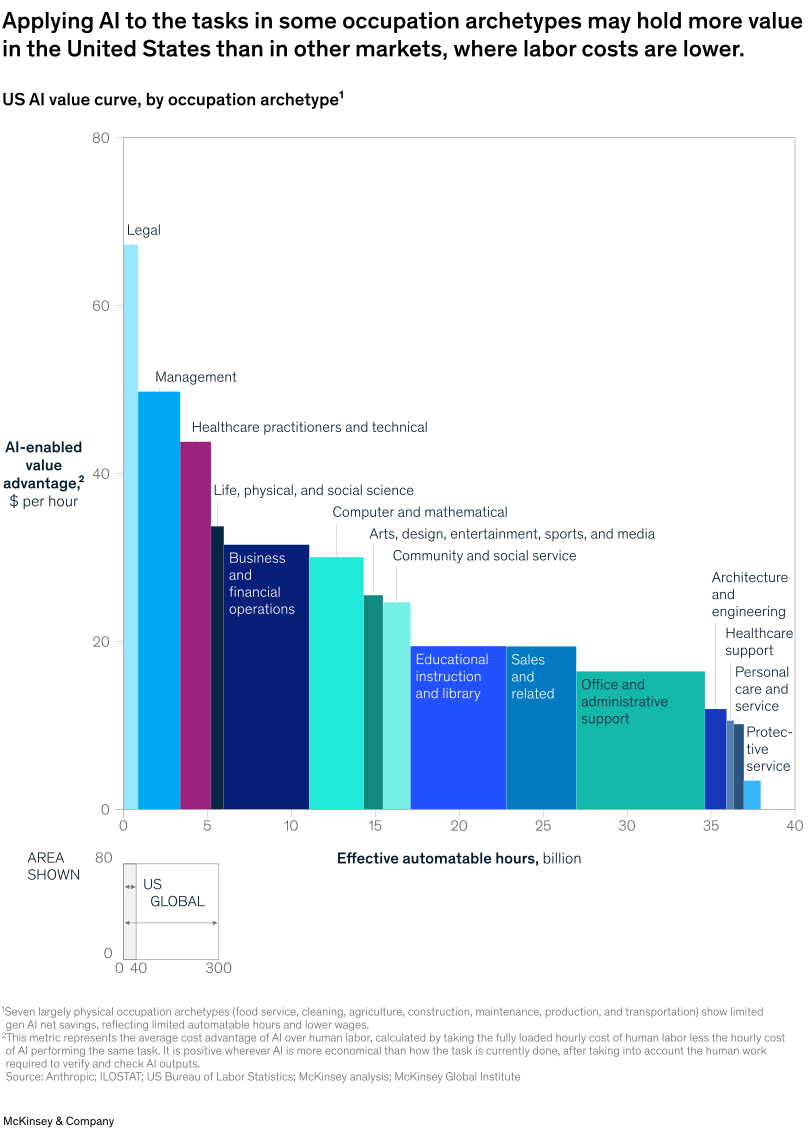
The industry view shows where AI creates the most value. The occupation archetype view shows which job archetypes stand to gain the most from AI (Exhibit 3), based on the distinct combination of tasks that make up each job. Importantly, economically automatable tasks should not be interpreted as automatable occupations.
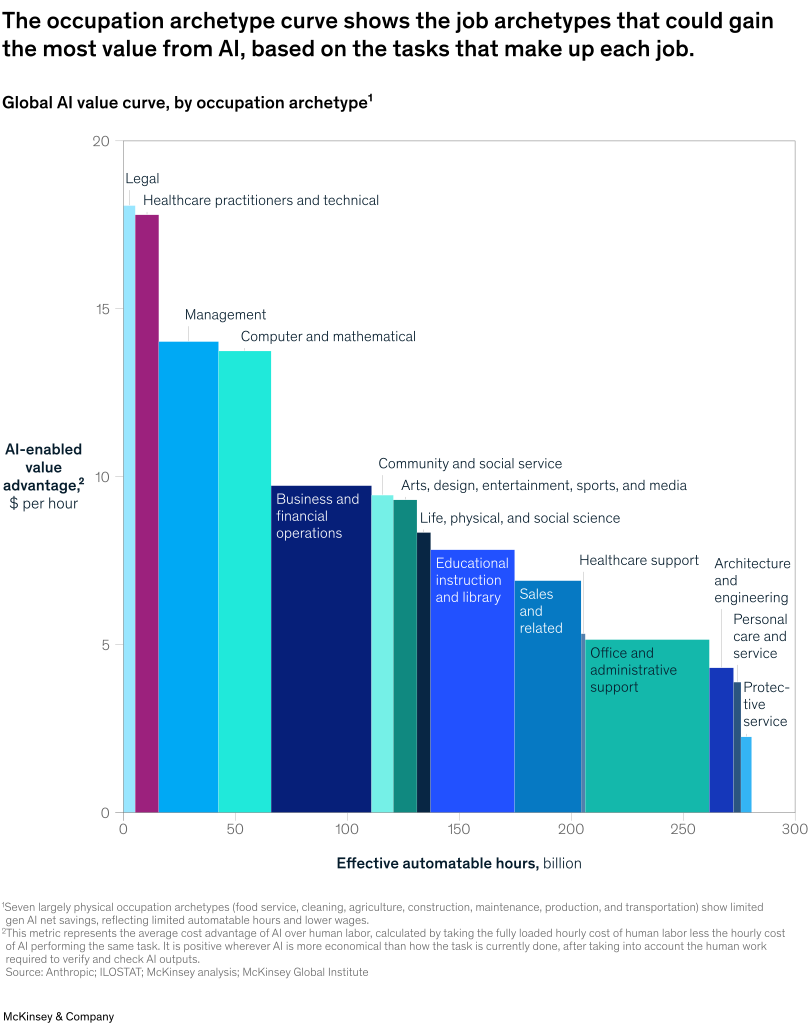
One of the clearest findings is that AI can often create as much or more value by augmenting high-skilled, relatively high-wage professionals as it does lower-wage workers. Legal, healthcare practitioners, and technical, management, and computer and mathematical occupations sit toward the high end of the curve, with some of the largest per-hour AI-enabled value advantages. Those for business and financial operations professionals may be slightly lower, but more of the routine tasks that make up their jobs may be supported by AI. Relatively small reductions in their lower-value work frees up rare expertise for more-valuable activities. Administrative support, protective services, and personal care, by contrast, show a more limited AI-enabled value advantage at current wages; they remain strong candidates for targeted augmentation, and more of their tasks are expected to become economically viable as AI costs fall.
Because this view isolates the work that generative AI makes automatable, the value concentrates in high-skilled cognitive roles—management, legal, healthcare practitioners, computer and mathematical, and business and finance—where AI can take on routine preparation and analysis and free up scarce expertise for higher-value work. The pattern reinforces the central finding: The largest gains come from augmenting expensive expertise, not from applying AI to the largest volumes of lower-wage work.
Freeing up higher-value human expertise: The executive example
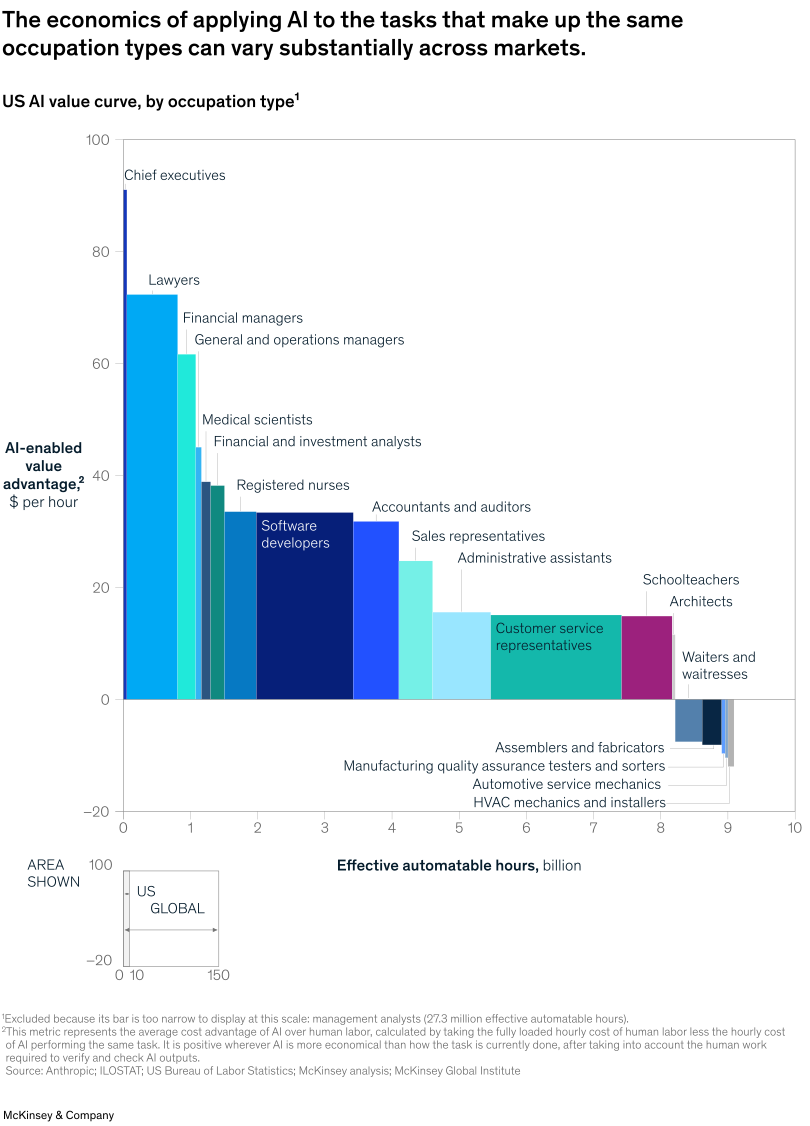
As the occupation archetype value curve shows, the AI differential tends to be greatest among the most senior executives and professionals. This is even more evident in the occupation type value curve, which highlights the potential value in a subset of specific roles (Exhibit 4).
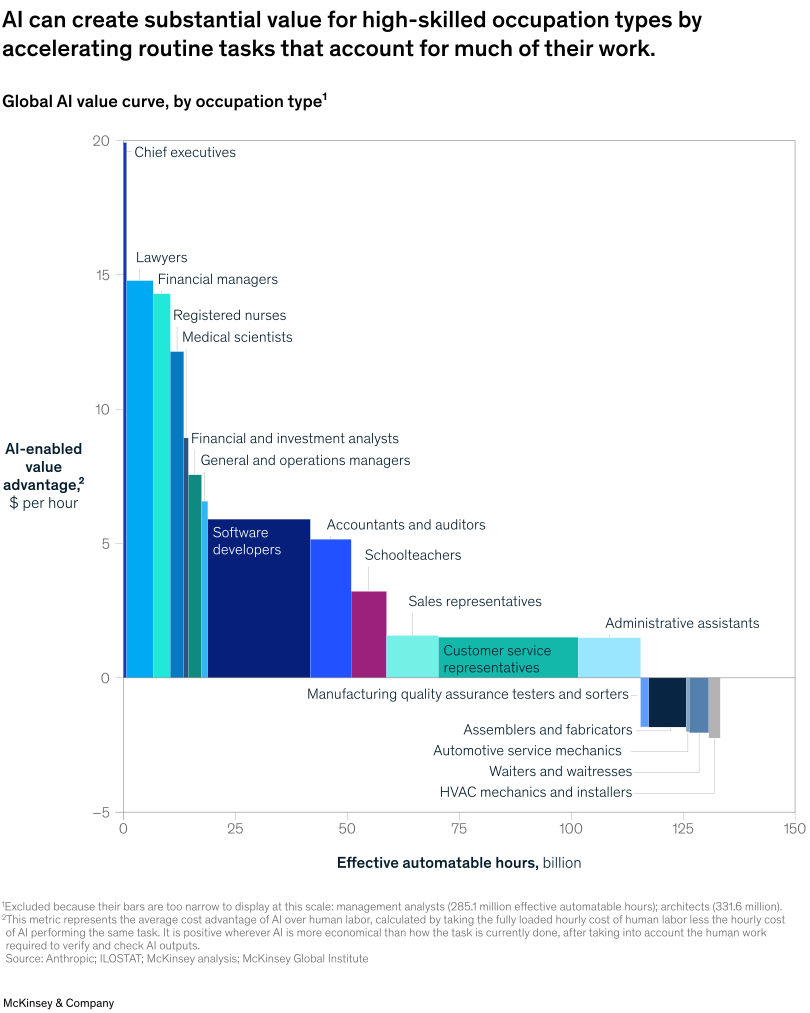
Knowledge-intensive, cognitive roles—chief executives, lawyers, financial managers, registered nurses, and software developers—sit toward the left, where AI’s per-hour value advantage is greatest and routine preparation, analysis, and drafting can be augmented most cost-effectively. More-physical, hands-on roles—waiters, assemblers, inspectors and sorters, and HVAC mechanics—fall toward the right, where today’s economics are tighter and fewer activities are directly addressable by AI without robotics.
Despite their place at the top of the curve, highly paid knowledge-intensive roles aren’t likely to be replaced by AI. Instead, it can create substantial value by augmenting and accelerating many of the routine tasks that have traditionally accounted for much of their work: preparing for meetings, managing email, synthesizing briefing documents, reviewing board materials, scanning the competitive landscape. The benefit comes from how those hours are used, for example, making strategic decisions and judgment calls or establishing and maintaining relationships, all of which cannot easily be delegated or automated.
Likewise, there are several job types on the curve, including pharmacy technicians and entertainment attendants, where applying AI to their tasks is more expensive than the status quo at prevailing wages, so the near-term economic return is negative. This reflects today’s economics, not a ceiling on the role. The position is expected to improve as AI costs fall and more of the work becomes viable to augment.
How the value curve changes across countries and regions
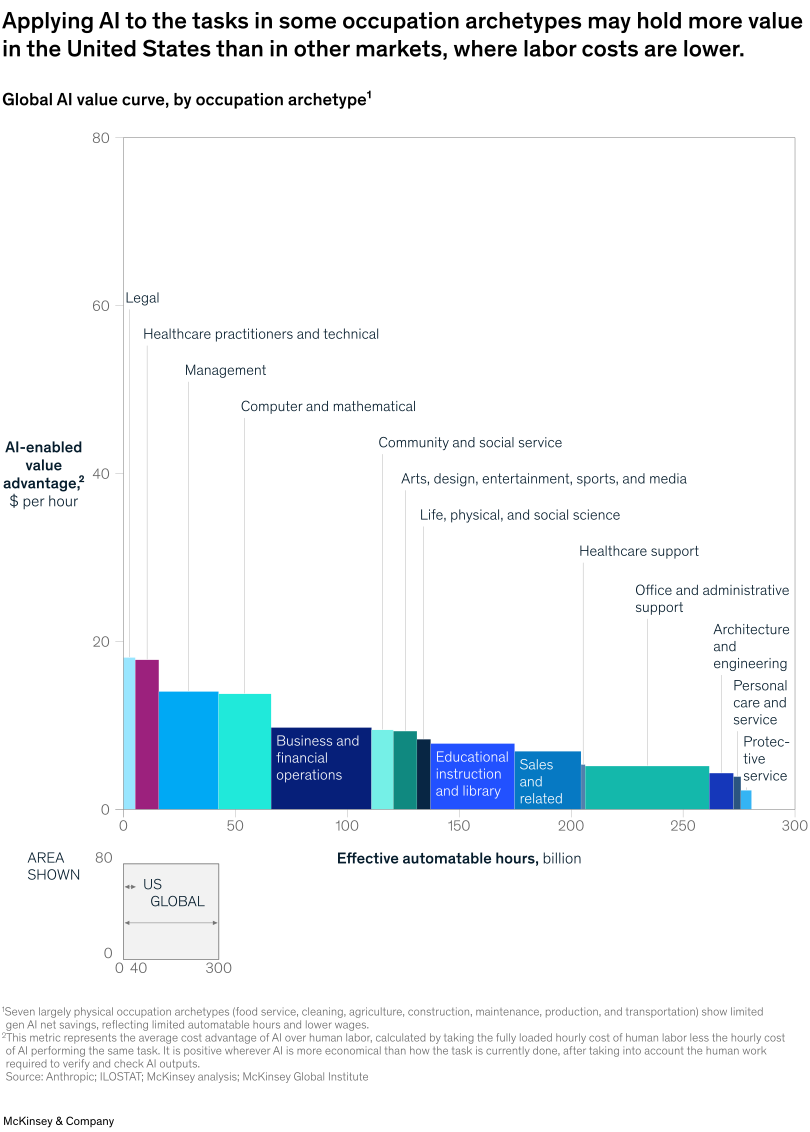
The economics of AI value creation are local. While AI costs are broadly similar across markets, labor costs diverge significantly by country.
As a result, the potential AI value of different sectors and occupations fluctuates significantly across markets and occupations. This means the economics of AI deployment cannot be assumed to be uniform across markets; organizations should account for local conditions and economics when evaluating individual use cases.
Higher US labor costs result in larger cost differentials between human labor and AI-enabled workflows. As a result, the same sector can show materially different economics in the US and global views (Exhibit 5). Direct comparisons between the charts should therefore account for the underlying labor cost base, rather than relying on relative position alone.
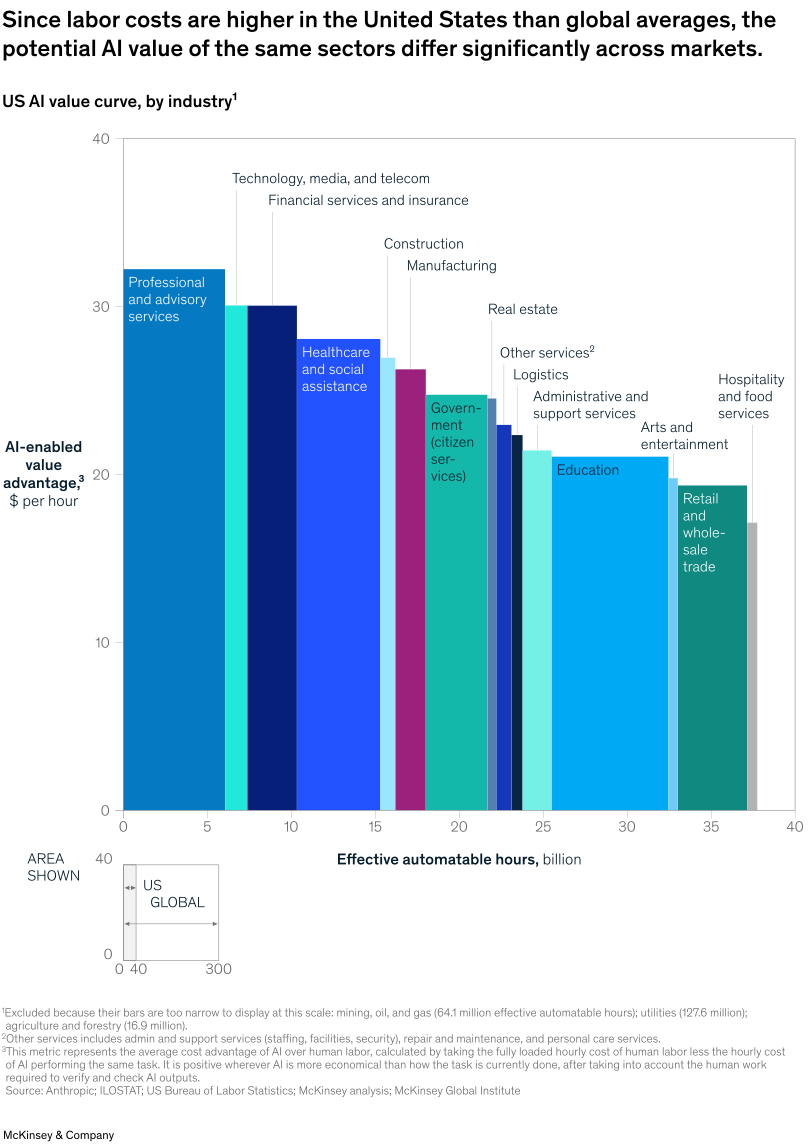
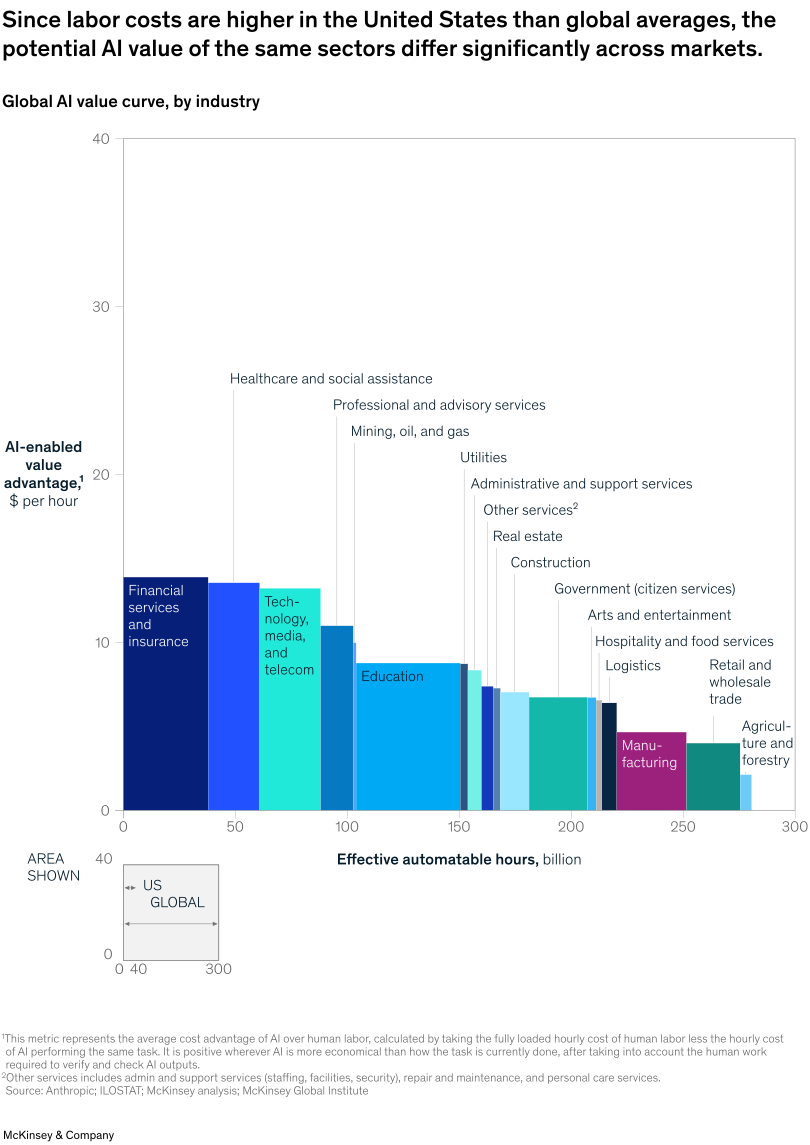
The global view also masks considerable variation across markets. Importantly, these curves measure the economics of applying AI to tasks, not future demand for an occupation; significant AI economic potential can coexist with growing demand for workers.
At the occupation type level, software developers illustrate this effect: They remain an attractive AI use case globally, but per-hour value creation is an order of magnitude higher in the United States given the more expensive labor base (Exhibit 6).
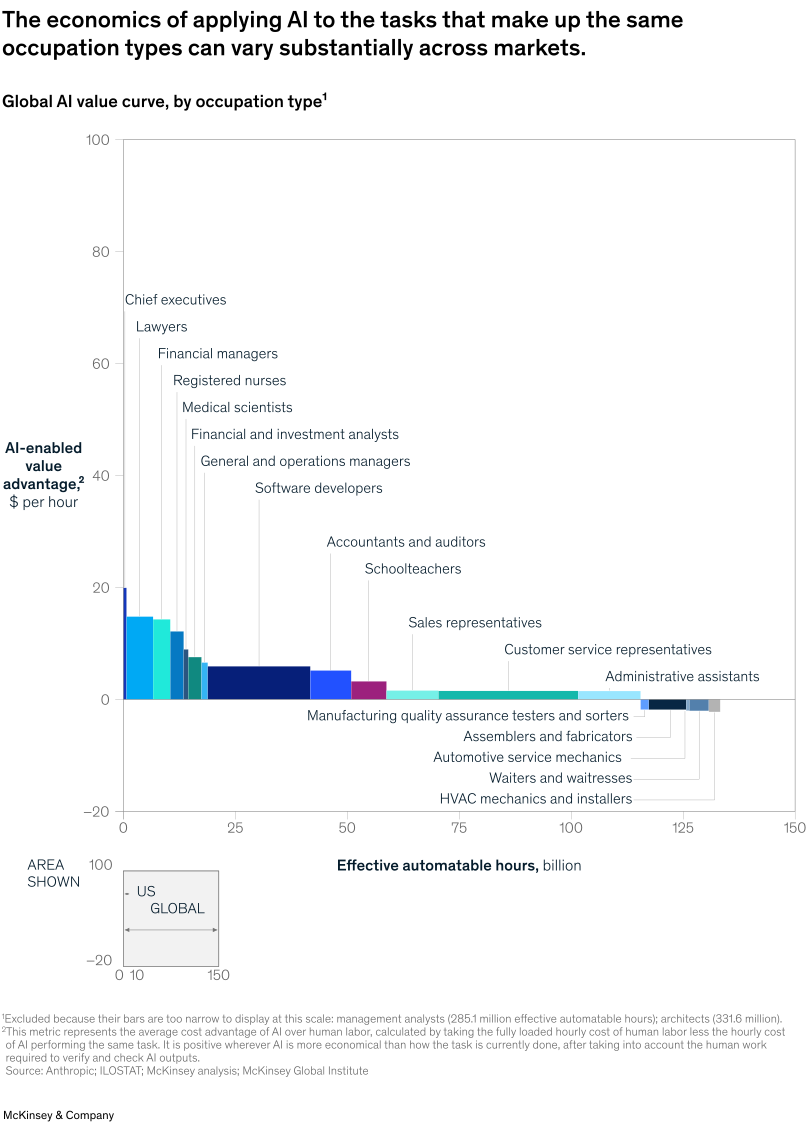
The same use case can therefore cross the economic threshold in one market but not another. For example, applying AI to economically automatable tasks in sales and office and administrative support occupation archetypes is value accretive under US cost assumptions, but may not yet be in markets where labor costs fall below the effective cost of AI (Exhibit 7). The geographic comparison is therefore a lens for assessing individual AI use cases under local market conditions, rather than prescribing a workforce strategy by region.
Importantly, economic potential does not necessarily translate into realizable value. The analysis does not model organizational, regulatory, or workforce constraints such as employment law and collective bargaining arrangements that may affect an organization’s ability to capture the opportunity.

The state of AI in 2026: On the road to ROI
How cost-sensitive is the value curve?
The value curve also varies over time. That evolution is driven not only by changes in cost but also by rapid improvements in AI capability. A task that is marginal or not economically attractive today may move into positive-value territory over a relatively short period as models become more capable and reliable, require fewer iterations, and reduce the human review and rework needed to deliver an acceptable-quality outcome.
Our analysis is based on an average cost of having AI take on specific tasks, but the cost of AI is far from fixed. Recent advances in high-performing open-source models, together with growing competition among frontier model providers, have sharply driven down token and inference costs. Yet what matters to organizations is the effective cost of AI usage they pay to get work done with the models, not the headline price of an individual token. The human component is not fixed either: As organizations learn how to use AI effectively while preserving human judgment, the level and nature of human involvement required, and therefore the effective cost of deployment, may also change. When that effective cost falls, more tasks cross the AI economic threshold and the value pool expands. When it rises, the pool contracts just as fast.
Higher costs are not just theoretical. For many enterprises, effective costs are already climbing, as usage growth outpaces the decline in unit prices. Consumption-based pricing also means that every new use case adds to the total bill. By one estimate, enterprise large language model spending tripled over a 12-month period by the end of 2025.3
Beyond usage growth, several forces could under certain conditions push the underlying cost of AI higher still: Demand for compute may be outrunning the supply of specialized chips; data center power is getting more expensive and could be more challenging to secure as capacity tightens; more-capable models consume more compute per task; and trade restrictions could squeeze hardware supply further. Together, these forces could reverse the falling-price trend most AI business cases assume (see sidebar “Hedging against AI cost reversal”).
In Exhibit 8, we model how a 30 percent AI cost increase would affect the US value curve. The figure is an illustration, not a forecast, but it represents a plausible, moderate trajectory, smaller than the swings AI pricing has already seen, yet large enough to show how quickly the economics can shift.
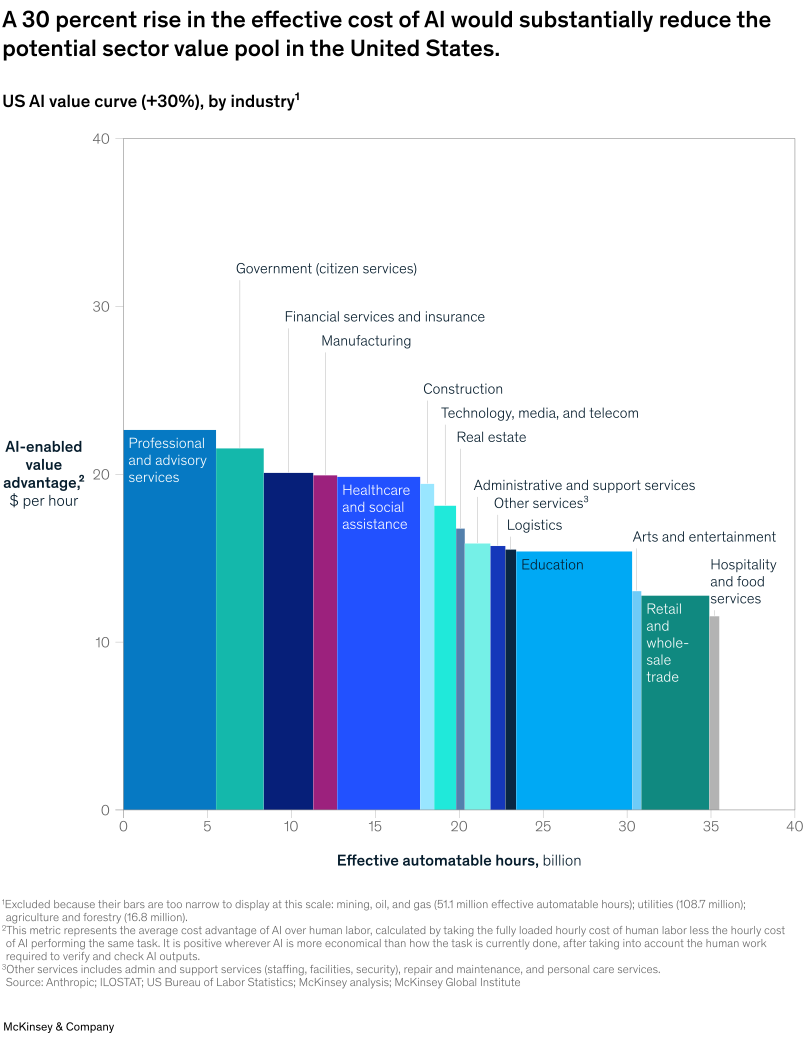
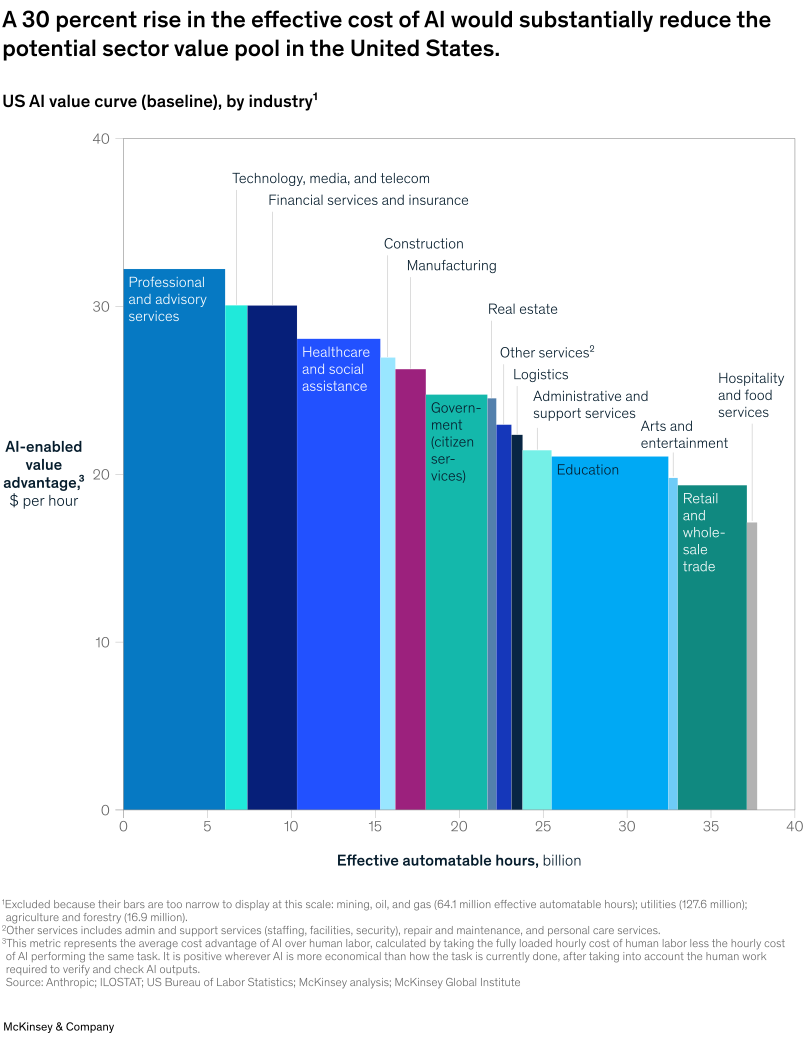
The effect is stark. Of the $960 billion US baseline, a 30 percent cost rise pulls $320 billion off the table. The AI-enabled value advantage falls across all 18 US industries, narrowing the cost differential; clear automation cases look more marginal, and some move into negative economic territory, with AI costing more than the current way of performing the same tasks. Globally the effect is slightly smaller but still substantial: The pool falls from $2.52 trillion to $1.67 trillion, a 34 percent drop.
As stated earlier, the value curve only considers the AI usage cost of each task, including not just model and token costs but any human review, validation, and rework that is still required. Factoring in the one-time transformation and enablement investment (compute, cloud, platforms, training, change management) needed to capture the value would pull the net pool even lower.
What leaders can do with the value curve
The AI value curve findings suggest that many leaders may need to pursue a different agenda from the one their organizations are currently pushing. As part of that shift, they can consider the following actions:
- Map the opportunity within your business at the task level. Leaders need to know which tasks absorb time, which are digitally addressable, which require human judgment, and where AI changes cost or quality. Consider a task-level audit of your top five cost centers to identify where you sit on the curve.
- Size and prioritize the highest-value use cases before scaling. A technically impressive demo can be a small business opportunity. A less glamorous process can be a large one if it has volume and a positive cost differential. Rank your AI investments by area under the curve, not by how inspiring a pilot may seem at first glance.
- Manage AI costs alongside adoption so value grows faster than spend. As AI spend becomes material, treat it like any other factor cost: manage model routing, context length, token governance, and cost per useful outcome. The AI FinOps discipline is becoming a requirement, not an option.
- Stress-test business cases and hedge against cost reversal. The 30 percent cost inflation scenario demonstrates that AI economics are not unidirectional. Build sensitivity analyses into every AI investment case: What happens if token costs rise 30 percent? What happens if they fall 30 percent? Size the asymmetry.
- Plan redeployment before deployment. If AI frees up some of people’s current workloads, leaders need a view of where and how those people can be (re)deployed. Otherwise, productivity can disappear into lower utilization and unmeasured slack. Set explicit redeployment targets for every AI initiative, identify the higher-value work that people with more bandwidth can support, and determine what reskilling or capability building employees will need to take it on.
The first wave of generative AI has demonstrated what the technology could do. The next phase is about deploying it across sectors, jobs, and regions where its capabilities can create new value.
The estimated $2.52 trillion annual global value pool from deploying AI to augment and transform the tasks that make up roles is significant, but not guaranteed. Capturing it depends on enterprises integrating AI at scale and redesigning work rather than merely adding new tools to existing processes. And as the AI value curve reveals, it is also about being agile enough to adjust their strategies as AI costs fluctuate.
The companies that benefit most will not necessarily be those that deploy AI most widely. They will be the companies that understand the tasks that make up jobs where the economics already favor AI and invest where the evidence is strongest.