After more than 10,000 years of relative stability—the full span of human civilization—the Earth’s climate is changing. As average temperatures rise, climate science finds that acute hazards such as heat waves and floods grow in frequency and severity, and chronic hazards, such as drought and rising sea levels, intensify (Exhibit 1). In this report, we focus on understanding the nature and extent of physical risk from a changing climate over the next one to three decades, exploring physical risk as it is the basis of both transition and liability risks.

We estimate inherent physical risk, absent adaptation and mitigation, to assess the magnitude of the challenge and highlight the case for action. Climate science makes extensive use of scenarios ranging from lower (Representative Concentration Pathway 2.6) to higher (RCP 8.5) CO2 concentrations. We have chosen to focus on RCP 8.5, because the higher-emission scenario it portrays enables us to assess physical risk in the absence of further decarbonization. (For more details click on “Our research methodology”). In this report, we link climate models with economic projections to examine nine cases that illustrate exposure to climate change extremes and proximity to physical thresholds. A separate geospatial assessment examines six indicators to assess potential socioeconomic impact in 105 countries. We also provide decision makers with a new framework and methodology to estimate risks in their own specific context.

Move from plans to progress.
Sustainability matters. Together we’ll make it real.
TABLE OF CONTENTS
- Seven characteristics of physical climate risk stand out
- Climate change is already having substantial physical impacts in regions across the world
- Socioeconomic impacts will likely be nonlinear and have knock-on effects
- Global socioeconomic impacts could be substantial
- Countries with lower GDP per capita levels are generally more exposed
- What can decision makers do?
Seven characteristics of physical climate risk stand out
We find that physical risk from a changing climate is already present and growing. Seven characteristics stand out. Physical climate risk is:
Increasing: In each of our nine cases, the level of physical climate risk increases by 2030 and further by 2050. Across our cases, we find increases in socioeconomic impact of between roughly two and 20 times by 2050 versus today’s levels. We also find physical climate risks are increasing across our global country analysis even as some countries find some benefits (such as expected increase in agricultural yields in countries such as Canada).
Spatial: Climate hazards manifest locally. The direct impacts of physical climate risk thus need to be understood in the context of a geographically defined area. There are variations between countries and within countries.
Non-stationary: As the Earth continues to warm, physical climate risk is ever-changing or non-stationary. Further warming is “locked in” for the next decade because of physical inertia in the geophysical system. Climate science tells us that further warming and risk increase can only be stopped by achieving zero net greenhouse gas emissions. Furthermore, given the thermal inertia of the earth system, some amount of warming will also likely occur after net-zero emissions are reached.
Nonlinear: Socioeconomic impacts are likely to propagate in a nonlinear way as hazards reach thresholds beyond which the affected physiological, human-made, or ecological systems work less well or break down and stop working altogether. This is because such systems have evolved or been optimized over time for historical climates (Exhibit 2).

Systemic: While the direct impact from climate change is local, it can have knock-on effects across regions and sectors, through interconnected socioeconomic and financial systems.
Regressive: The poorest communities and populations within each of our cases typically are the most vulnerable. Climate risk creates spatial inequality, as it may simultaneously benefit some regions while hurting others.
Under-prepared: While companies and communities have been adapting to reduce climate risk, the pace and scale of adaptation are likely to need to significantly increase to manage rising levels of physical climate risk. Adaptation is likely to entail rising costs and tough choices that may include whether to invest in hardening or relocate people and assets.
Climate change is already having substantial physical impacts in regions across the world
The planet’s temperature has risen by about 1.1 degrees Celsius on average since the 1880s. This has been confirmed by both satellite measurements and by the analysis of hundreds of thousands of independent weather station observations from across the globe. Scientists find that the rapid decline in the planet’s surface ice cover provides further evidence. This rate of warming is at least an order of magnitude faster than any found in the past 65 million years of paleoclimate records.
The average conceals more dramatic changes at the extremes. In statistical terms, distributions of temperature are shifting to the right (towards warmer temperatures) and broadening. That means the average day in many locations is now hotter (“shifting means”), and extremely hot days are becoming more likely (“fattening tails”). For example, the evolution of the distribution of observed average summer temperatures for each 100-by-100-kilometer square in the Northern Hemisphere shows that the mean summer temperature has increased over time (Exhibit 3). The share of the Northern Hemisphere (in square kilometers) that experiences an extremely hot summer—three-standard-deviation hotter average temperature in a given summer—has increased from zero to half a percent.

Averages also conceal wide spatial disparities. Over the same period that the Earth globally has warmed by 1.1 degrees, in southern parts of Africa and in the Arctic, average temperatures have risen by 0.2 and 0.5 degrees Celsius and by 4 to 4.3 degrees Celsius, respectively. In general, the land surface has warmed faster than the 1.1-degree global average, and the oceans, which have a higher heat capacity, have warmed less.
The affected regions will grow in number and size
Looking forward, climate science tells us that further warming is unavoidable over the next decade at least, and in all likelihood beyond. With increases in global average temperatures, climate models indicate a rise in climate hazards globally. These models find that further warming will continue to increase the frequency and/or severity of acute climate hazards and further intensify chronic hazards (Exhibit 4).

Socioeconomic impacts will likely be nonlinear and have knock-on effects
Climate change affects human life as well as the factors of production on which our economic activity is based. We measure the impact of climate change by the extent to which it could disrupt or destroy human life, as well as physical and natural capital.
Climate change is already having a measurable socioeconomic impact and we group these impacts in a five-systems framework. This impact framework is our best effort to capture the range of socioeconomic impacts from physical climate hazards and includes:
- Livability and workability. Hazards like heat stress could affect the ability of human beings to work outdoors or, in extreme cases, could put human lives at risk. Increased temperatures could also shift disease vectors and thus affect human health.
- Food systems. Food production could be disrupted as drought conditions, extreme temperatures, or floods affect land and crops, though a changing climate could improve food system performance in some regions.
- Physical assets. Physical assets like buildings could be damaged or destroyed by extreme precipitation, tidal flooding, forest fires, and other hazards.
- Infrastructure services. Infrastructure assets are a particular type of physical asset that could be destroyed or disrupted in their functioning, leading to a decline in the services they provide or a rise in the cost of these services. This in turn can have knock-on effects on other sectors that rely on these infrastructure assets.
- Natural capital. Climate change is shifting ecosystems and destroying forms of natural capital such as glaciers, forests, and ocean ecosystems, which provide important services to human communities. This in turn imperils the human habitat and economic activity.
Would you like to learn more about our Sustainability Practice?
The nine distinct cases of physical climate risk in various geographies and sectors that we examine, including direct impact and knock-on effects, as well as adaptation costs and strategies, help illustrate the specific socioeconomic impact of the different physical climate hazards on the examined human, physical, or natural system (Exhibit 5). Our cases cover each of the five systems across geographies and include multiple climate hazards, sometimes occurring at the same location. Overall, our cases highlight a wide range of vulnerabilities to the changing climate.

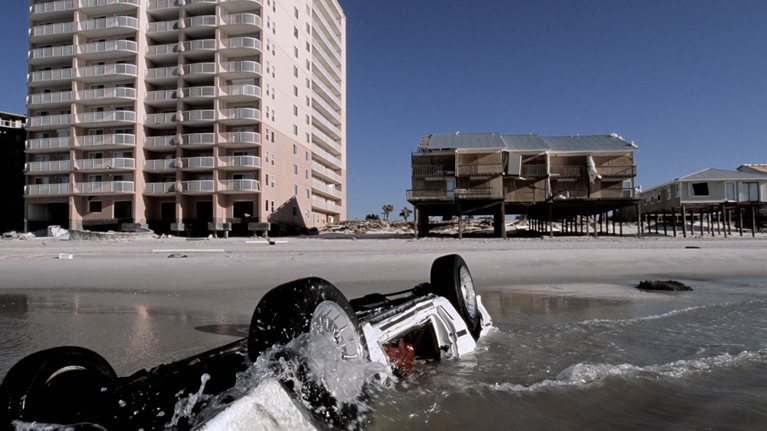
Specifically, we looked at the impact of climate change on livability and workability in India and the Mediterranean; disruption of food systems through looking at global breadbaskets and African agriculture; physical asset destruction in residential real estate in Florida and in supply chains for semiconductors and heavy rare earth metals; disruption of five types of infrastructure services and, in particular, the threat of flooding to urban areas; and destruction of natural capital through impacts on glaciers, oceans, and forests.
Our case studies indicate that physical climate risk is growing, often in nonlinear ways. Physical climate impacts are spreading across regions, even as the hazards and their impacts grow more intense within regions. Most of the increase in direct impact from climate hazards to date has come from greater exposure to hazards rather than from increases in the mean and tail intensity of hazards. In the future, hazard intensification will likely assume a greater role. Key findings from our cases include:
- Societies and systems most at risk are ones already close to physical and biological thresholds. For example, as heat and humidity increase in India, by 2030 under an RCP 8.5 scenario, between 160 million and 200 million people could live in regions with a 5 percent average annual probability of experiencing a heat wave that exceeds the survivability threshold for a healthy human being, absent an adaptation response. (The technical threshold we employed is a three-day heatwave with wet-bulb temperatures of 34 degrees Celsius. At that point, the urban heat island effect could increase the wet-bulb temperature to 35 degrees Celsius. All our lethal heatwave projections are subject to uncertainty related to the future behavior of atmospheric aerosols and urban heat island or cooling island effects). Outdoor labor productivity is also expected to be impacted, reducing the effective number of hours that can be worked outdoors. By 2030, the average number of lost daylight working hours in India could increase to the point where between 2.5 and 4.5 percent of GDP could be at risk annually, according to our estimates.
- Economic and financial systems have been designed and optimized for a certain level of risk and increasing hazards may mean that such systems are vulnerable when they reach systemic thresholds. For example, supply chains are often designed for efficiency over resiliency, by concentrating production in certain locations and maintaining low inventory levels. Food production is also heavily concentrated; just five regional “breadbasket” areas account for about 60 percent of global grain production. Rising climate hazards might therefore cause such systems to fail, for example if key production hubs are affected.
- Financial markets could bring forward risk recognition in affected regions, with consequences for capital allocation and insurance cost and availability. Risk recognition could trigger capital reallocation and asset repricing and indicates the presence of systemic risk. In Florida, for example, estimates based on past trends suggest that losses from flooding could devalue exposed homes by $30 to $80 billion, or 15 to 35 percent, by 2050, all else being equal. Rough estimates suggest that this in turn could impact property tax revenue in some of the most affected counties by 15 to 30 percent (though impacts across the state could be less, up to 2 to 5 percent).
- Large knock-on impacts can occur when thresholds are breached. These systemic risks come about in particular when the people and assets affected are central to local economies and those local economies are tied into other economic and financial systems. In Ho Chi Minh City, direct infrastructure asset damage from a 100-year flood could rise from about $200—$300 million today to $500 million to $1 billion in 2050, while knock-on costs to the economy could rise from $100—$400 million to between $1.5 billion and $8.5 billion. In another case, ocean warming could reduce fish catches, for example, affecting the livelihoods of 650 million to 800 million people who rely on fishing revenue.
- Climate change could create inequality—simultaneously benefiting some regions while hurting others. For example, rising temperatures may boost tourism in areas of northern Europe while reducing the economic vitality of southern European resorts. Within regions, the poorest communities and populations within each of our cases typically are the most vulnerable to climate events. They often lack financial means as well as support from public or private agencies. For example, climate events could trigger harvest failure in multiple breadbasket locations—that is, significantly lower-than-average yields in two or more key production regions for rice, wheat, corn, and soy. This could lead to rising food prices, particularly hurting the poorest communities, including the 750 million people living below the international poverty line.
Global socioeconomic impacts could be substantial
While our case studies illustrate the localized impacts of a changing climate, rising temperatures are a global trend and we assess how physical climate hazards could evolve in 105 countries.
In our assessment of inherent risk, we find that all 105 countries are expected to experience an increase in at least one major type of impact on their stock of human, physical, and natural capital by 2030. Intensifying climate hazards could put millions of lives at risk, as well as trillions of dollars of economic activity and physical capital, and the world’s stock of natural capital. The intensification of climate hazards across regions will bring areas hitherto unexposed to impacts into new risk territory. In particular:
- By 2050, under an RCP 8.5 scenario, the number of people living in areas with a nonzero chance of lethal heat waves would rise from zero today to between 700 million and 1.2 billion (not factoring in air conditioner penetration). Urban areas in India and Pakistan may be the first places in the world to experience such lethal heatwaves (Exhibit 6). For the people living in these regions, the average annual likelihood of experiencing such a heat wave is projected to rise to 14 percent by 2050. The average share of effective annual outdoor working hours lost due to extreme heat in exposed regions globally could increase from 10 percent today to 10 to 15 percent by 2030 and 15 to 20 percent by 2050.

- Food systems are projected to see an increase in global agricultural yield volatility that skews toward worse outcomes. For example, by 2050, the annual probability of a 10 percent or more reduction in yields for wheat, corn, soy, and rice in a given year is projected to increase from 6 percent to 20 percent. The annual probability of a 10 percent or more increase in yield in a given year is expected to rise from 1 percent to 6 percent.
- Assets can be destroyed or services from infrastructure assets disrupted from a variety of hazards, including flooding, forest fires, hurricanes, and heat. Statistically expected damage to capital stock from riverine flooding could double by 2030 from today’s levels and quadruple by 2050.
- In parts of the world, the biome, the naturally occurring community of flora and fauna inhabiting a particular region, is expected to shift. Today, about 25 percent of the Earth’s land area has already experienced a shift in climate classification compared with the 1901–25 period. By 2050, that number is projected to increase to about 45 percent. Almost every country will see some risk of biome shift by 2050, affecting ecosystem services, local livelihoods, and species’ habitat (Exhibit 7).

Download Climate risk and response: Physical hazards and socioeconomic impacts, the full report on which this article is based (PDF–3.7MB).
Countries with lower GDP per capita levels are generally more exposed
While all countries are affected by climate change, we find that the poorest countries could be more exposed, as they often have climates closer to dangerous physical thresholds. They also rely more on outdoor work and natural capital and have less financial means to adapt quickly. The risk associated with the impact on workability from rising heat and humidity is one example of how poorer countries could be more vulnerable to climate hazards. When looking at the workability indicator (that is, the share of effective annual outdoor working hours lost to extreme heat and humidity), the top quartile of countries (based on GDP per capita) have an average increase in risk by 2050 of approximately 1 to 3 percentage points, whereas the bottom quartile faces an average increase in risk of about 5 to 10 percentage points. Lethal heat waves show less of a correlation with per capita GDP, but it is important to note that several of the most affected countries—Bangladesh, India, and Pakistan, to name a few—have relatively low per capita GDP levels.

What can decision makers do?
In the face of these challenges, policy makers and business leaders will need to put in place the right tools, analytics, processes, and governance to properly assess climate risk, adapt to risk that is locked in, and decarbonize to reduce the further buildup of risk.
Much as thinking about information systems and cyber-risks has become integrated into corporate and public-sector decision making, climate change will also need to feature as a major factor in decisions. For companies, this will mean taking climate considerations into account when looking at capital allocation, development of products or services, and supply chain management, among others. For cities, a climate focus will become essential for urban planning decisions. Financial institutions could consider the risk in their portfolios. Developing a robust quantitative understanding is complex and will also require the use of new tools, metrics, and analytics. At the same time, opportunities from a changing climate will emerge and require consideration. These could arise from a change in the physical environment, such as new places for agricultural production, or for sectors like tourism, as well as through the use of new technologies and approaches to manage risk in a changing climate. One of the biggest challenges could stem from using the wrong models to quantify risk. These range from financial models used to make capital allocation decisions to engineering models used to design structures. For example, current models may not sufficiently take into account geospatial dimensions or assumptions could be based on historical precedent that no longer applies.
Societies have been adapting to the changing climate, but the pace and scale of adaptation will likely need to increase significantly. Key adaptation measures include protecting people and assets, building resilience, reducing exposure, and ensuring that appropriate financing and insurance are in place. Implementing adaptation measures could be challenging for many reasons. The economics of adaptation could worsen in some geographies over time, for example, those exposed to rising sea levels. Adaptation may face technical or other limits. In other instances, there could be hard trade-offs that need to be assessed, including who and what to protect and who and what to relocate.
While adaptation is now urgent and there are many adaptation opportunities, climate science shows us that the risk from further warming can only be stopped by achieving zero net greenhouse gas emissions. Decarbonization is not the focus of this research, however, decarbonization investments will need to be considered in parallel with adaptation investments, particularly in the transition to renewable energy. Stakeholders should consider assessing their decarbonization potential and opportunities from decarbonization.
Related Articles
Will mortgages and markets stay afloat in Florida?

Can coastal cities turn the tide on rising flood risk?