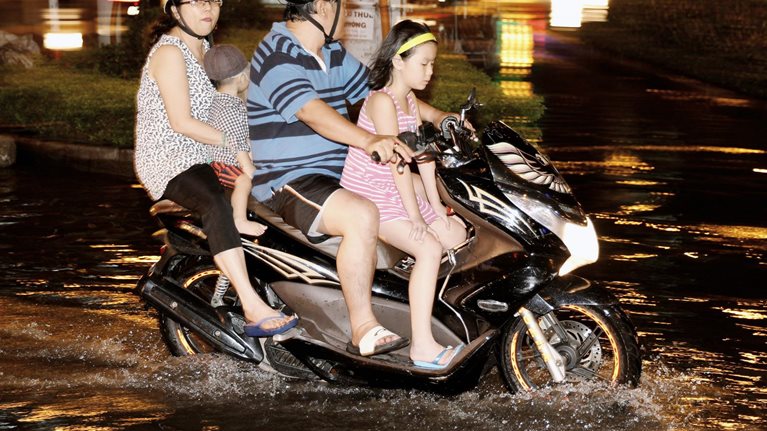
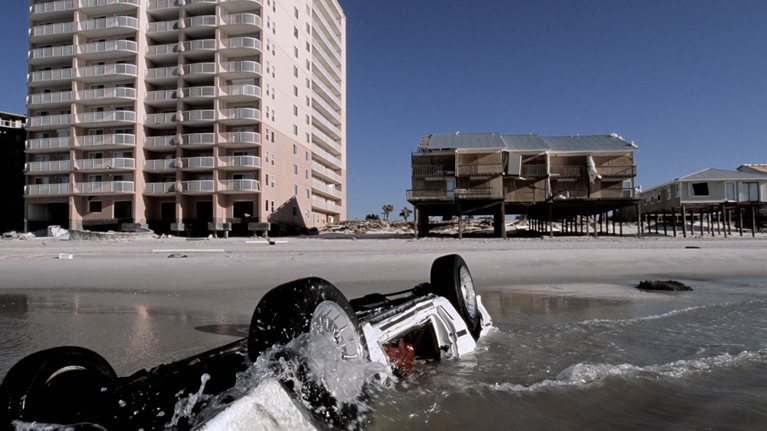
When Hurricane Sandy struck the eastern seaboard of the United States in October 2012, subways, airports, and roads were flooded, causing transportation to grind to a halt. Millions lost power, some for days or weeks, shutting down businesses and creating public safety issues. In addition to winds knocking out one-fourth of cell phone towers in the Northeast, the loss of electricity forced many towers offline after depleting their emergency batteries. Eleven billion gallons of sewage flowed into rivers, bays, and coastal waters because severe inundation overwhelmed municipal wastewater systems. In total, the storm caused about $70 billion in damages. But despite being one of the costliest and most destructive storms on record, this event was not an aberration. Nine of the costliest mainland US hurricanes on record have occurred in the past 15 years. Going forward, climate change is expected to further intensify these risks.1
Infrastructure usually involves large investments in assets that are designed to operate over the long term. Coal-fired plants are designed for 40 to 50 years, for example, and hydropower dams and large geotechnical structures for up to 100 years. To date, the design of these facilities typically has assumed a future climate that is much the same as today’s. However, a changing climate and the resulting more extreme weather events mean those climate bands are becoming outdated, leaving infrastructure operating outside of its tolerance levels. This can present direct threats to the assets as well as significant knock-on effects for those relying on the services those assets deliver.
In this case study, we examine four critical infrastructure systems—the electric power grid; water storage, treatment, and purification; transportation; and telecommunications—to determine how vulnerable global infrastructure is to a changing climate (see sidebar, “An overview of the case study analysis”). In the four major infrastructure classes, we identify a total of 17 types of assets to evaluate against seven climate hazards: tidal flooding amplified by sea-level rise; riverine and pluvial flooding; hurricanes/typhoons and storms; tornadoes and other wind events; drought; heat (temperature increases in both air and water); and wildfires. Each type of infrastructure system has specific elements vulnerable to specific climate hazards; we map those hazard infrastructure intersections where risks will most be exacerbated by climate change.
The climate risk for infrastructure is both pervasive and diverse
Overall, we find that climate change could increasingly disrupt critical systems, increase operating costs, exacerbate the infrastructure funding gap, and create substantial spillover effects on societies and economies. We find that there is a range of unique vulnerabilities of different types of infrastructure assets to different categories of climate hazards. Few assets will be left completely untouched. In certain countries, heat-related power outages could increase in severity and may push the grid to cascading failure; aircraft could also be grounded more frequently as both planes and airports cross heat-related thresholds. Understanding these differences is crucial for successful planning. To that end, we have produced a heat map that explores the risk of potential future interruptions from typical exposure to climate hazards by 2030 (Exhibit 1).

Our analysis reveals two different sets of risks involving infrastructure: direct (for example, a power plant goes offline because it floods) and indirect (for example, a power plant cannot transmit power because the power transmission lines have gone down). A typical asset’s direct risk is estimated in our heat map analysis. But direct vulnerabilities are only half the story. Risk is further exacerbated by the vulnerabilities of a specific infrastructure asset to failures in the infrastructure systems within which that asset is embedded. These dependencies can spread risk. We find that each system (for example, energy, water) has at least one severely vulnerable element. Because of the interdependency of these infrastructure systems, the high-risk assets may represent critical points of failure for the entire system, causing operational losses for all other assets in the chain and knock-on effects for a broader set of institutions and individuals.
The power grid: The power grid is highly vulnerable to climate risk from both acute and chronic impacts, amplified by fragile components and relatively low redundancy. The effects of climate-related hazards on the power grid are already apparent. Higher temperatures lower generation efficiency, increase losses in transmission and distribution, decrease the lifetime of key equipment including power transformers, boost peak demand, and force certain thermoelectric plants offline. Day to day, these pressures cause rising operating costs and reduced asset life. In rare cases, these stressors can overwhelm the grid and lead to load shedding and blackouts. Instances and associated costs of disruptions to the power grid are likely to rise as temperatures increase. As average heat levels increase, so does the frequency of extreme heat events and the duration of less severe periods of higher than average heat that cause efficiency losses. Hot periods will be hotter than systems are used to, increasing the degree of failure and thus the associated recovery times, lost revenues, and repair costs. For example, California’s Fourth Climate Change Assessment states that by 2060, 5 percent a year probability heat waves in Los Angeles County may reduce overall grid capacity by 2 to 20 percent.
Transportation: Transportation infrastructure is widely distributed, interconnected, and can be affected by relatively minimal climate hazards, resulting in significant societal impacts. For example, extreme heat is already disrupting global air travel. In July 2017, approximately 50 flights were grounded for physical and regulatory reasons when temperatures in Phoenix, Arizona, skyrocketed to 48 degrees Celsius. We analyzed the effect of extreme heat on global air travel. Assuming regional aircraft are largely similar to today’s and keeping the number of regional flights constant to isolate climate impact, if no adaptation measures are taken (for example, lengthening runways, improving aircraft technology), this translates into about 200 to 900 flights grounded per year by 2030 and about 500 to 2,200 flights by 2050 (Exhibit 2). This could directly affect about 16,000 to 75,000 passengers per year in 2030 and about 40,000 to 185,000 passengers per year in 2050, up from an estimated 4,000 to 8,000 today (these events are not systematically recorded today) from extreme heat. More or fewer passengers may be affected depending on whether heat waves strike on heavier travel days (when flights are fuller) and how long the heat conditions persist. Air transportation delays cost the US economy $4 billion in 2007, with most direct costs falling on passengers.

Water supply and wastewater systems: Water supply systems can also experience long-lasting outages from acute shocks like hurricanes and flooding. Two weeks after Hurricane Katrina in 2005, 70 percent of affected drinking water facilities were still offline. Flooding can also result in long recovery periods. Effects are more dramatic in the developing world, where contamination of drinking water is common, and cholera and E. coli frequently cause widespread diarrhea outbreaks in the aftermath of floods. Water treatment systems, however, such as desalination plants, could be increasingly used to limit the impacts of drought. Wastewater systems also suffer as a result of climate shocks. During drought, sewers can have inadequate flow, resulting in blockages and the inability to process human waste. Blockages lead to the possibility of sewage systems bursting in the middle of urban areas. But the biggest threat to wastewater systems is flooding, particularly during hurricanes. Similar but more gradual wastewater overflows are also happening because of chronic stresses. In 2018, rainfall in the city of Richmond, Virginia, was more than 50 percent above average, and as a result 15,500 cubic meters of untreated sewage spilled into the James River.

Climate risk and response
Telecommunications: A fast-growing sector, telecommunications infrastructure has more agility and redundancy, yet as the world’s dependence on the communications network increases, climate risks will also grow. High winds or trees can fell cell phone towers and telephone poles, blow down telephone lines and base stations, and knock microwave receivers out of alignment. Above-ground cabling is at more risk than buried lines of support and pole failures, damage from debris and falling objects (such as trees), and breakage from tension caused by extreme wind speeds. Flooding and hurricanes are the biggest threats. In 2015–16, floods in the United Kingdom inundated a number of key telecom assets, cutting off thousands of homes, businesses and critical public services such as the police. Hurricanes Irma and Maria caused devastation to telecom infrastructure in the Caribbean, with over 90 percent of mobile sites destroyed in Puerto Rico, St. Martin, Dominica, and Antigua and Barbuda. These threats interfere with the system just when it is needed most for disaster recovery.
What can be done to lessen the impact of climate change on global infrastructure?
Infrastructure is expected to bear the brunt of anticipated climate change adaptation costs, typically estimated to be between 60 and 80 percent of total climate change adaptation spending globally, which could average $150 billion to $450 billion per year on infrastructure in 2050. However, most estimates of the cost of adaptation relative to current assets are small compared with the scale of infrastructure investments. Estimates vary significantly, but consensus puts adaptation spending for new assets at about 1 to 2 percent of total infrastructure spending a year.
Adaptation should be tailored to the specific hazard and infrastructure risks. However, opportunities exist for adaptation that are relevant for all infrastructure sectors. Examples of ways to adapt current and future infrastructure to climate risks can be considered including by:
- reducing exposure through transparency
- accelerating investment in resilience
- mobilizing capital to fund adaptation
For additional details, download the case study, Will infrastructure bend or break under climate stress? (PDF–800KB).
How global infrastructure evolves over the next 50 years may be a major determinant of the impact of climate change on civilization. More money will need to be spent both on and in support of infrastructure, and in new ways. Building slightly higher walls, metaphorically or literally, may not be the best solution. And the risks extend beyond infrastructure. A failure to adapt by not taking climate change into account in the design, construction, and maintenance of infrastructure assets will not only cause costs to owners and operators but will leave entire communities exposed and vulnerable. Adaptation can deliver a strong return both by reducing costs from climate-related damage to infrastructure itself and by avoiding significant knock-on effects in wider society.
About this case study:
In January 2020, the McKinsey Global Institute published Climate risk and response: Physical hazards and socioeconomic impacts. In that report, we measured the impact of climate change by the extent to which it could affect human beings, human-made physical assets, and the natural world over the next three decades. In order to link physical climate risk to socioeconomic impact, we investigated nine specific cases that illustrated exposure to climate change extremes and proximity to physical thresholds.
Related Articles
Can coastal cities turn the tide on rising flood risk?
Will mortgages and markets stay afloat in Florida?