

This article was developed as part of McKinsey’s partnership with the Financial Times’ Energy Source Forum. Read the companion piece on FT.com.
These are unprecedented times for the global energy system. The closing of the Strait of Hormuz in early 2026 and Russia’s full-scale invasion of Ukraine before it has pushed energy security and affordability front of mind for decision-makers. Ensuring sufficient energy at reasonable cost is now an urgent global priority, in many cases superseding decarbonization.
While “gray swan” events such as conflict are reshaping the global energy system, so too are more mundane, yet critical, questions about how to ensure stable, reliable electricity supply as more renewable energy sources are added to national grids.
McKinsey’s Global Energy Perspective 2026 captures an increasingly uncertain picture across energy demand growth, AI-driven power load, geopolitics, infrastructure delivery, and technology cost declines. These considerations—and the intensity of today’s disruptions—are reflected in four new plausible scenarios for how the energy system could evolve through to 2050: Hydrocarbon Resilience, All of the Above Energy, Fragmented Energy Order, and Decarbonization Delivers (Continued Momentum remains the baseline scenario, as per previous editions of McKinsey’s Global Energy Perspective).
Why is the energy transition now best characterized as an “energy expansion”?
In 2025, low-carbon investment exceeded fossil fuel investment for the second consecutive year, and renewable capacity grew faster than at any other point in history. But oil demand also hit its highest level since 2019, coal consumption set another record, and natural gas demand grew in every major region.
With energy demand expected to continue to climb for the next 25 years in line with GDP and population growth, what we are experiencing is an energy transition in name, not yet in reality. According to McKinsey analysis, renewables are adding to hydrocarbon energy sources rather than replacing them, a nuance that is sometimes lost in the data illustrating the success of renewables—for example, accelerating solar buildout and investment.
The grid is considered the “ultimate speed bump” to the energy transition. Why is that?
The answer is part economics, part speed. In many regions, grid upgrades and expansion are simply not keeping up with renewables buildout—and renewable energy that cannot be connected, cannot be delivered to end users. We have already seen multiple examples of transmission system operators and independent system operators rethinking the interconnection process or contending with an increasing number of negative price hours in places such as Europe.1
The scale of grid investment required globally is significant. Annual investments in transmission and distribution are expected to more than double by 2050, from $443 billion in 2025 to $970 billion a year (Exhibit 1).
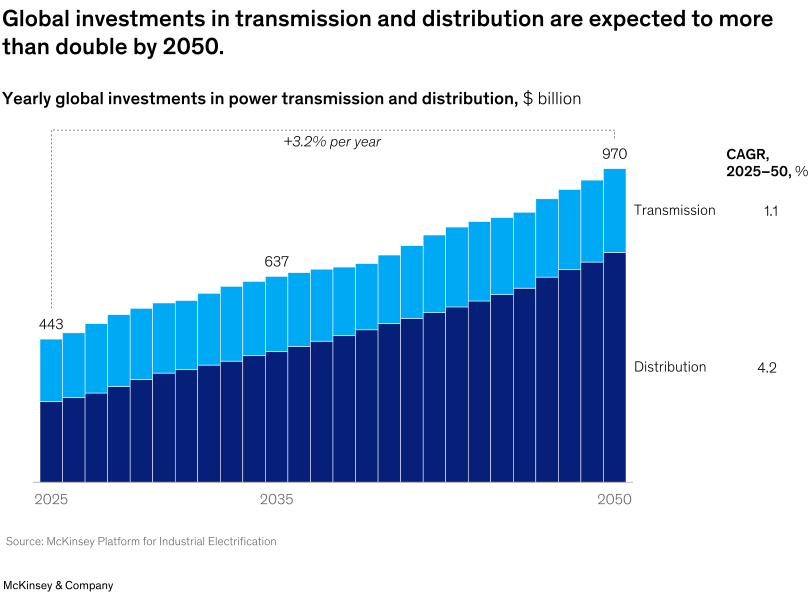
While renewables are increasingly cost-competitive or even the cheapest form of energy in many places in terms of the levelized cost of electricity, rising network costs and the cost to firm intermittent renewables erode some of those generation-related “savings.” Transmission, storage, firm capacity, permitting, and interconnection determine how quickly—and affordably—low-cost generation becomes reliable, usable energy.
How do data centers impact the energy demand outlook?
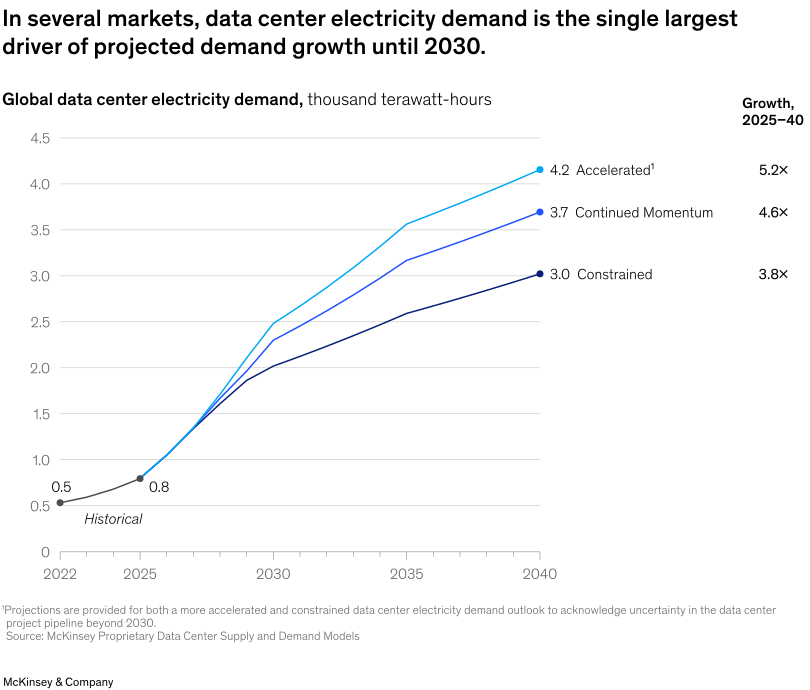
Data centers are already the fastest-growing single load segment in OECD markets. In the Continued Momentum baseline scenario, which extends current trends into the future without assuming any breakthrough conditions, electricity demand from data centers is projected to grow at 24 percent CAGR to 2030.
Beyond 2030, however, the picture is highly uncertain. Technological breakthroughs could materially change AI’s energy-efficiency profile while further acceleration in AI adoption could drastically change the demand load profile. Even a more constrained growth outlook puts data center-driven electricity demand exponentially higher than today’s levels (Exhibit 2).
What has the closing of the Strait of Hormuz revealed about the global energy system today?
The disruption experienced in the Strait of Hormuz since February 2026 is a reminder that the energy system is increasingly vulnerable to geopolitics.
At its peak, the closing of the Strait of Hormuz rendered close to 25 percent of seaborne oil trade and 19 percent of liquefied natural gas (LNG) supply unavailable to the market, even after part of the supply was rerouted through regional pipelines. In fact, over the past seven decades, the most severe supply disruptions have all had geopolitical origins, with their effects persisting for years beyond the initial shock.
While the current crisis was largely managed by “buffers” in the system, primarily strategic petroleum reserves, as well as demand destruction and supply chain shifts, the margin for error in future shocks is thin and the economic costs are potentially significant.
For individual countries, Hormuz and the war in Ukraine have contributed to a reframing of energy security around the two structural dimensions of self-sufficiency (the domestic share of primary energy supply) and diversification (how consumption is spread across energy sources).
Only one of the new scenarios paints a positive picture for decarbonization. Is all hope lost for the energy transition?
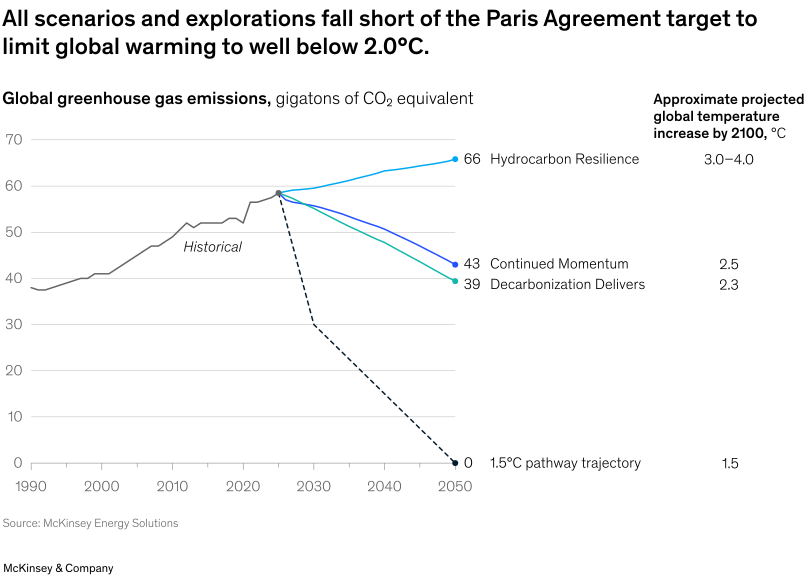
The latest Global Energy Perspective makes for sober reading from a climate change point of view. All the scenarios miss the Paris Agreement target to limit warming to 1.5˚C above preindustrial levels and keep warming well below 2.0˚C. Even Decarbonization Delivers, our most climate-optimistic scenario, has a projected temperature increase of 2.3˚C by 2100 (Exhibit 3).
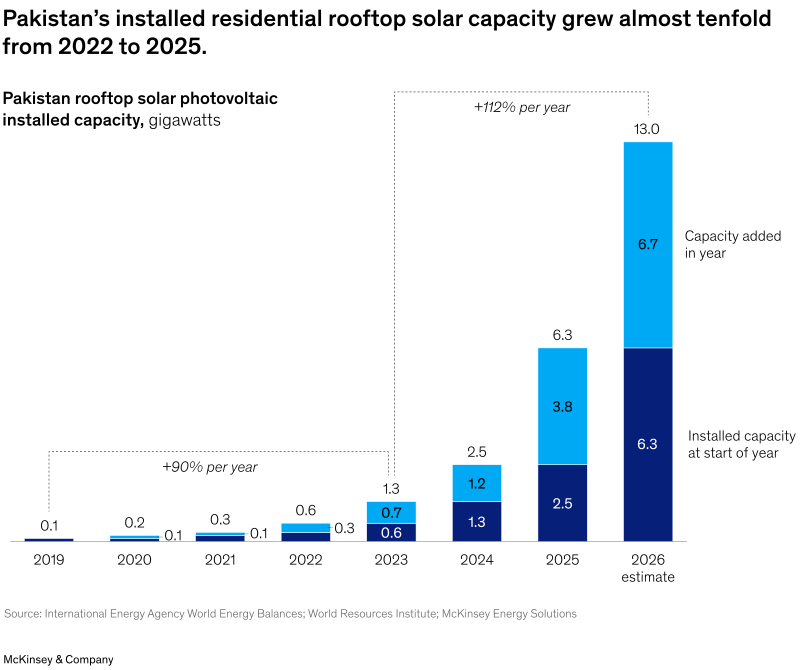
But there is some positive momentum for decarbonization. China, a major global consumer of energy and source of emissions, met its targets for wind and solar six years ahead of its target. In Pakistan, a combination of cheap solar panels and an expensive, unreliable grid spurred rapid growth in rooftop solar installations (Exhibit 4).
August 2026 tied with July 2023 as the hottest month on record.2 Accelerating global warming, with a worsening toll on human life and economies, could push decarbonization back to the top of energy-system priorities. And we could yet see breakthroughs in nuclear technology, specifically small modular reactors, while AI itself could bring about improvements in energy efficiency and demand reduction.
It is important to note that we do not assign probability to any of the scenarios in the report; having fewer decarbonization-positive scenarios does not mean a lower probability of one unfolding, nor does it rule out others not captured in the report.
What are the implications of this year’s findings for decision-makers?
Decision-makers everywhere face a tough challenge in balancing security, affordability, and decarbonization. These decisions are likely to be increasingly localized, with countries choosing the pathway for their energy system based on their own energy needs, natural endowments, access to resources and supply chains, and fiscal positions.
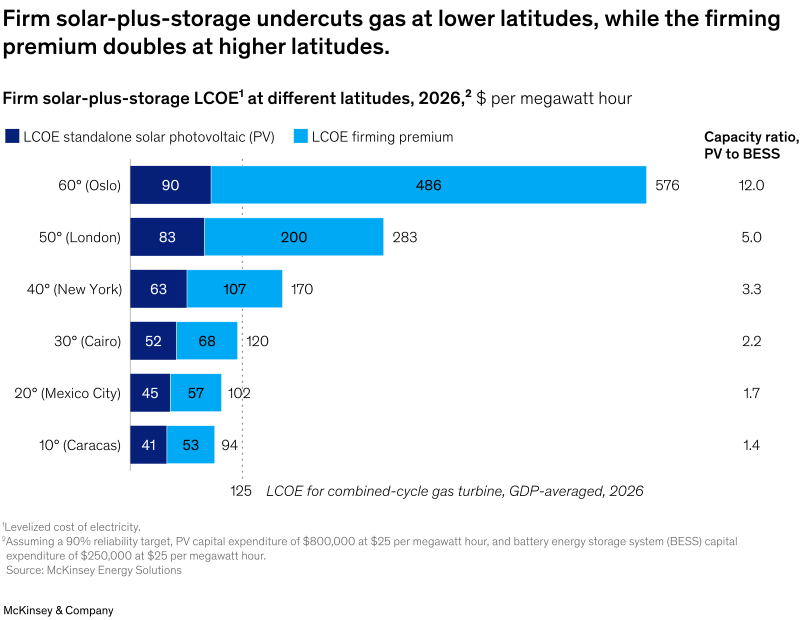
The cost of solar at different degrees of latitude, for example, helps to explain why. At solar-abundant latitudes, in places such as Mexico, solar-plus-storage is already cheaper than gas. But at Norway’s latitude, a winter-scarce solar profile makes the technology three times more expensive than gas because it requires substantial storage overbuild to deliver flat, reliable output (Exhibit 5).
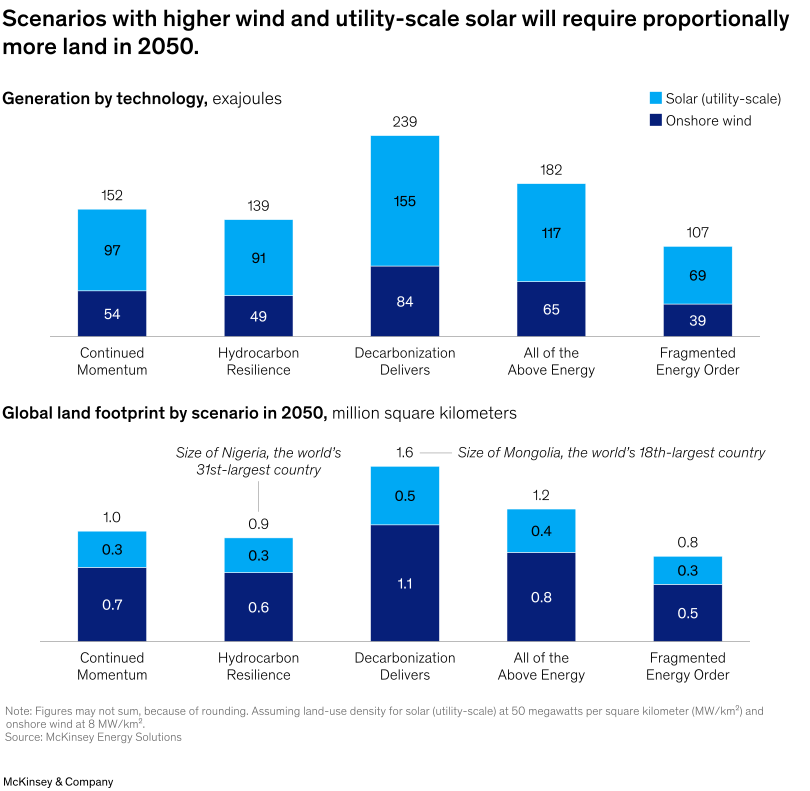
For countries with abundant solar or wind resources, investing in renewables could increasingly become a question of land use and availability. In a Decarbonization Delivers scenario, the global land footprint of utility-scale solar and wind could reach 1.6 million square kilometers, about the size of Mongolia, the 18th-largest country in the world (Exhibit 6).
In other words, there is no single or best pathway for securing the affordable, abundant low-carbon energy the world needs. Understanding the interplay and trade-offs between these considerations is paramount for any energy strategy, and a key reason why business leaders need to consider a broader range of scenarios in today’s operating context. This is one of the underpinning messages of this year’s Global Energy Perspective.
1 Pablo Gandullo Romero, “Negative electricity prices in Europe: What drives different market outcomes?” Haya Energy Solutions, July 21, 2026.
2 “Copernicus: August was the world’s joint hottest month on record, pushing global temperatures back above 1.5°C above pre-industrial levels,” Copernicus Climate Change Service, September 10, 2026.