






Welcome to McKinsey’s Agriculture Industry Review, our regular blog examining the latest developments across agriculture. In each edition, we share data-backed insights drawn from public and proprietary sources, expert perspectives, and the latest McKinsey research.
What we are seeing in November 2026
Agricultural markets continue to face shifting economic conditions, profitability pressures, and uneven performance across the value chain. Three developments are particularly worth noting:
- US farm income holds flat as government support grows and farmer confidence weakens. Higher government payments are offsetting a sharp decline in operating income, while farmer sentiment and investment appetite have weakened.
- Brazilian growers cite concerns about weather and input price risks. Extreme weather has become growers’ most frequently cited concern, and fertilizer exchange ratios have reached multiyear highs in Mato Grosso.
- Recovery remains uneven across the value chain. Second-quarter results improved for agrichemicals, fertilizer, and grain traders, while agricultural equipment and animal protein companies remain under pressure.
These trends are shaping grower economics and company performance across the agricultural value chain in Brazil and the United States.
US farmer outlook
Farm income holds flat, with greater reliance on government payments. The United States Department of Agriculture’s (USDA’s) September forecast projects US net cash farm income to remain broadly flat at approximately $176 billion in 2026, as higher government payments offset declining operating income.1 Direct government payments are expected to increase from about $28 billion in 2025 to roughly $47 billion in 2026, accounting for 27 percent of net cash farm income compared with 16 percent in 2025. Excluding government support, operating cash income is projected to decline by approximately 13 percent year on year, or nearly $20 billion. Overall nominal net cash farm income is expected to remain about 60 percent above the $109 billion historical average, though 16 percent below the 2022 peak.
The outlook varies across commodities. Cattle receipts are projected to increase 5 percent to about $141 billion, while poultry and egg receipts are expected to decline 25 percent and dairy receipts by 4 percent as prices normalize from 2025 levels. Financial pressure is also evident in farm bankruptcy filings, which reached 177 in the first half of 2026, up 7 percent year on year, including 95 filings in the second quarter, the highest quarterly level in five years.2
Farmer sentiment and investment appetite continue to decline. According to the Purdue University/CME Group Ag Economy Barometer, 52 percent of US farmers surveyed in both September and October 2026 believed the country was headed in the wrong direction, indicating a negative farmer sentiment driven by high input costs and policy concerns. This is the first time a majority has expressed this view since the question was introduced in July 2025.3 These September sentiment figures predate the USDA’s October 9 upward revision for corn yield estimates, which introduces a potential headwind for corn prices and grower confidence.4
Farmers have also become more cautious about capital expenditures. The Farm Capital Investment Index declined to 39 in September, down 14 points year on year to its lowest level since mid-2024.5 Sentiment about both current conditions and future expectations remains above the lows recorded in 2023 and 2024, but both measures have declined during 2026. Rising input costs continue to be a leading concern among farmers surveyed.
Grain prices remain above historical trends despite continued pressure on grower profitability. The USDA’s upward revision of corn yield estimates (more than 2.7 bushels per acre) adds supply-side pressure to corn prices. Nevertheless, strong ethanol use and exports are expected to absorb much of the near-record US corn crop, while stocks-to-use is projected to decline to approximately 11 percent in 2026/27 from 13 percent in 2025/26. As a result, corn prices will likely remain modestly above historical trends, alongside soybean and wheat prices.
Soybean prices are supported by growing biofuel demand and tighter global vegetable oil supply, while wheat prices are expected to remain above trend despite relatively high stocks-to-use, reflecting lower US production and Black Sea supply disruptions.
Soybean demand continues to shift toward domestic processing. As we noted in August, the US Environmental Protection Agency’s Set 2 rule under the Renewable Fuel Standard is strengthening demand for soybean oil used in biofuels. Domestic soybean processing has now overtaken exports as the largest outlet for US soybeans.6 Since the 2021/22 marketing year, crush volumes have increased by roughly 26 percent, while exports have declined by 21 percent amid increased competition from Brazil and slower growth in Chinese import demand.7 For the 2026/27 marketing year, crushing is projected to account for approximately 57 percent of total soybean use, compared with 35 percent for exports. That represents a shift of 5 percentage points in each category over the past two years.8 The growing importance of domestic processing is changing the composition of soybean demand and helping offset lower export volumes (exhibit).
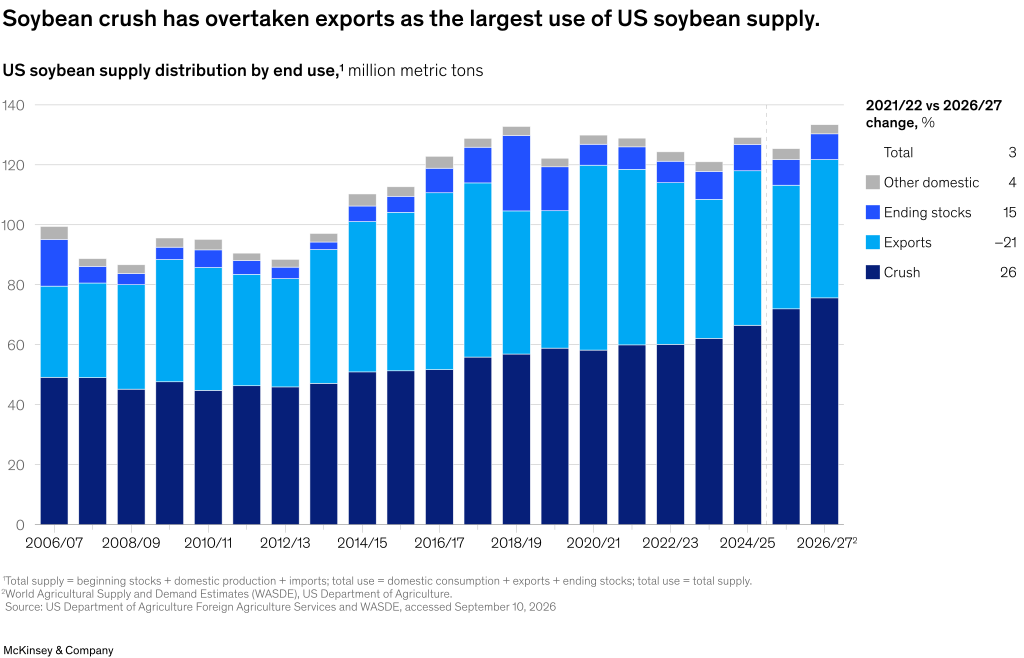
US soybean total supply has expanded approximately 34 percent over the past 20 years. Higher yields account for approximately 60 percent of production growth and expanded acreage contributes the remaining 40 percent.
Brazil farmer outlook
Weather and input price risks. Brazilian growers cite extreme weather and input prices as their principal risks to profitability over the next two years. According to McKinsey’s Global Farmer Insights 2026, a global survey of 5,500 farmers, 68 percent of Brazilian respondents cited extreme weather or climate events among their top three risks, making it the most frequently mentioned concern. Increased input prices ranked second, cited by 47 percent of growers, followed by commodity-price volatility at 28 percent and increased financing costs at 26 percent.9
Input costs outpace crop prices. Fertilizer exchange ratios in Mato Grosso have reached multiyear highs. This means that growers need more crop output to buy the same quantity of fertilizer, despite higher soybean prices.10 Based on January to August averages, the exchange ratio for monoammonium phosphate (MAP) increased from roughly 43 bags of soybeans per ton in 2025/26 to 50 bags in 2026/27, while the ratio for urea increased from 75 to 89 bags of corn per ton.11
Despite these less favorable ratios, Brazil’s planted area and production are projected to expand in 2026/27.12 Soybean area is expected to increase by 1 percent to 49.3 million hectares, with production approaching 182 million tons. Corn area is projected to rise 5 percent to 23.7 million hectares, with production reaching approximately 148 million tons.
Value chain performance
Recovery across the agricultural value chain remains uneven. Second-quarter 2026 results highlight clear differences in performance across industries.
- Agrichemical margins improve despite continued pricing pressure. Revenue remained broadly flat year on year as volumes declined 1 percent and price/mix fell 3 percent, reflecting continued generic competition and cautious grower purchasing.13 EBITDA margins, however, improved by about 4 percentage points to 18 percent, supported by cost and productivity initiatives.14
- Fertilizer earnings strengthen amid tighter supply. Fertilizer producers benefited from tighter nitrogen supply during peak spring application as well as higher potash volumes. Elevated sulfur costs continued to weigh on phosphate margins.15
- Grain trader earnings improve. Grain traders reported higher revenue, EBITDA, and margins as stronger crush economics and increased farmer selling supported processing activity.
- Agricultural equipment remains under pressure. Revenue edged higher year on year, but earnings declined as demand for large agricultural machinery remained near the cycle trough. Manufacturers continue to prioritize dealer inventory management and margin protection. John Deere expects Canadian and US large agricultural equipment demand to decline 15 to 20 percent in fiscal 2026.16
- Animal protein profitability weakens. Revenue increased year on year, but EBITDA margins fell to about 6.6 percent, their lowest level in ten quarters, as volumes weakened and price/mix gains faded. Tight cattle supply continued to weigh on beef processing margins, and chicken profitability moderated from recent highs.
- Companies are simplifying portfolios and adjusting operating footprints. Strategic activity across the agricultural value chain continues to focus on portfolio simplification and separations. Several crop input companies are separating their seed and crop protection businesses through spin-offs or planned IPOs.17 Others are selling minority stakes to reduce debt.18 Some food and protein companies are consolidating processing capacity and divesting international operations. At the same time, acquisitions of branded and value-added products show continued investment in higher-margin categories.19
The information in this blog reflects agricultural market conditions as of October 2026 and is intended as a point-in-time snapshot. Given the dynamic nature of these markets, some details may have changed since publication.
The authors wish to thank Emmy Moore, Felipe Boaretto, Julia Kalanik, Megan Higgins, and Yifan Wang for their contributions to this blog.
1 “Farm sector income and finances—farm sector income forecast,” Economic Research Service, US Department of Agriculture, September 3, 2026.
2 “Data on economic and bankruptcy trends (debt): Agricultural filings in Chapter 11 and Chapter 12,” The National Agricultural Law Center, accessed October 2026.
3 Ag economy barometer, Purdue University and CME Group, October 6, 2026. Question: “Would you say things in the US today are generally heading in the right direction or on the wrong track?”
4 “Crop protection,” US Department of Agriculture, October 9, 2026.
5 “Farmer sentiment drops as concerns about input costs increase,” Ag economy barometer, Purdue University and CME Group, October 6, 2026.
6 “World agricultural supply and demand estimates,” Economics, Statistics, and Market Information System, US Department of Agriculture, October 9, 2026.
7 “World agricultural supply and demand estimates,” Economics, Statistics, and Market Information System, US Department of Agriculture, October 9, 2026.
8 “World agricultural supply and demand estimates,” Economics, Statistics, and Market Information System, US Department of Agriculture, October 9, 2026.
9 Global Farmer Insights 2026, McKinsey, September 8, 2026.
10 “CEPEA/ESALQ soybean indicator—Paranaguá,” CEPEA, accessed October 21, 2026.
11 “Soy,” Dashboards, Mato Grosso Institute of Agricultural Economics (IMEA), accessed October 21, 2026.
12 “1st survey—2026/27 crop year, grain crop bulletin,” Ministry of Agrarian Development and Family Farming, accessed October 21, 2026.
13 Global Farmer Insights 2026, McKinsey, September 8, 2026.
14 Form 10-Q, quarterly report pursuant to section 13 or 15(d) of the securities exchange act of 1934, for the quarterly period ended June 30, 2026, Corteva, accessed October 2026; “Bayer operationally on track, decisive progress on strategic priorities,” Bayer, August 4, 2026.
15 Form 10-Q, quarterly report pursuant to section 13 or 15(d) of the securities exchange act of 1934, for the quarterly period ended June 30, 2026, The Mosaic Company, accessed October 2026.
16 “Deere reports third quarter net income of $1.379 billion,” John Deere, August 20, 2026.
17 Form 8-K, current report pursuant to Section 13 or 15(d) of the Securities Exchange of 1934, Corteva, accessed October 16, 2026; “BASF mandates investment banks for planned IPO of Agricultural Solutions,” BASF, September 14, 2026; “Investor Presentation for Q1 FY2027, BSE filing,” UPL Limited, August 2026.
18 “FMC Corporation and Tessenderlo Group complete minority equity investment,” FMC Corporation and Tessenderlo Group, September 23, 2026; “Hormel Foods completes sale of CERATTI® Business in Brazil,” Hormel Foods Corporation, July 31, 2026.
19 “Cal-Maine Foods and Sara Lee Frozen Bakery announce Cal-Maine Foods’ acquisition of Van’s Foods brand advancing Cal-Maine Foods’ diversification strategy and expanding consumer-facing retail presence,” Cal-Maine Foods, May 12, 2026.