M&A activity was more resilient in 2009 than commonly believed, and conditions are improving for 2010. Many reviews during the past year focused on the significant decline in volumes from 2007 and 2008. Indeed, with 5,800 deals totaling $2.3 trillion announced in 2009, M&A volumes were at their lowest level since 2004. Most of the reduction during the past two years, however, came about because of a 29 percent decline in market capitalization,1 leading to smaller absolute deal sizes, as well as a sharp decline in private-equity activity as a result of weak credit markets. When adjusted for market capitalization, the level of deals by corporations in 2009 was on par with that of 2008, only slightly lower than that of 2007, and significantly higher than it was after the dot-com crisis at the beginning of the decade.
The pattern of M&A changed in other ways during the past year. The long-term trend of an increasing number of cross-border deals ended, though in one respect the M&A marketplace turned increasingly global as Asian companies increased their share of international M&A. On a sector-by-sector basis, M&A activity was busier in strong sectors, such as energy, utilities, health care, and pharma, than in more troubled ones, like financial services, real estate, construction, and basic materials.
Overall, conditions improved in the fourth quarter, and companies increasingly found attractive deals and the means to complete them. That increase in activity appears set to continue in 2010, if current trends continue. But companies should take note: with the S&P 500 up 65 percent since last March, the era of highly undervalued assets is probably over, so acquirers must redouble their attention to fundamental drivers of value.2 We expect that large corporate buyers will be particularly well positioned to take advantage of any new wave of M&A, but we also see private-equity firms returning to the market.
Stable . . .
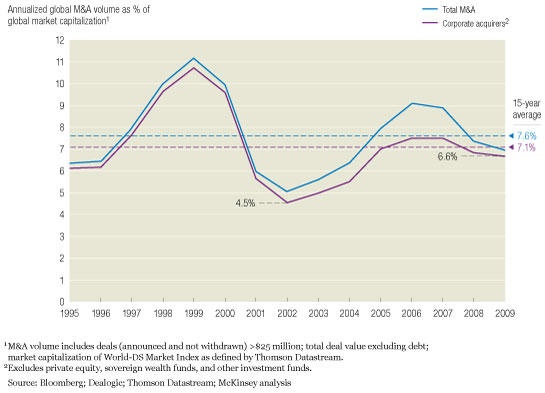
Compared with the M&A downturn at the beginning of the decade, deal activity as a share of global market capitalization appears to be holding at a much higher level two years after the peak (Exhibit 1). This year’s activity had several defining features.
Stable activity levels among corporate acquirers. The heights of M&A activity during 2006 and 2007 were driven largely by private-equity players and access to cheap financing, much to the frustration of competing corporate bidders at the time. In 2009, corporate acquirers remained busy, with an activity level in line with that of 2008 and only slightly below that of 2007, even as private-equity activity fell to levels not seen since 2000. Private-equity firms accounted for just below $100 billion, or 4 percent, of global M&A—down from more than $600 billion (or almost 20 percent of global activity) in both 2006 and 2007. The decline in M&A value from its peak was therefore not so much a “new normal” as a return to long-term trends, much as occurred in the late 1980s and early 1990s, when the disappearance of cheap credit led to a similar decline in leveraged buyouts. Observers may be heartened by a glimmer of light among the clouds: private-equity M&A activity hovered at around $15 billion a quarter since the end of 2008 but tripled in the fourth quarter of 2009, to $45 billion.
A shallow correction
Retrenchment in cross-border activity. Before the economic crisis reached its depths in 2008, companies around the world had increasingly sought to raise their foreign presence through cross-border M&A. That trend halted abruptly in 2009 as the number of cross-border deals dropped significantly and cross-border activity as a share of total M&A value fell by ten percentage points, from pre-crisis levels of above 40 percent. Notably, M&A activity was more evenly spread around the globe as Asian companies continued to increase their presence. Companies in the Asia-Pacific region accounted for 26 percent of global M&A in 2009, up significantly from 20 percent in 2007 and 2008, not to mention 10 percent in 2000 and 2001.
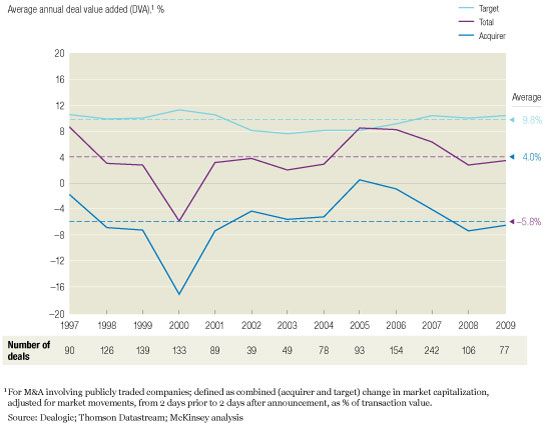
More value created—but more given away to targets. The value created by M&A, measured as the capital market’s reaction to deal announcements, reversed a three-year declining trend, with the total deal value added (DVA)3 increasing to levels slightly below the long-term average. Still, that was only a bit more than half of the value created by the more disciplined deal making of 2005 to 2007 (Exhibit 2).
Giving it away
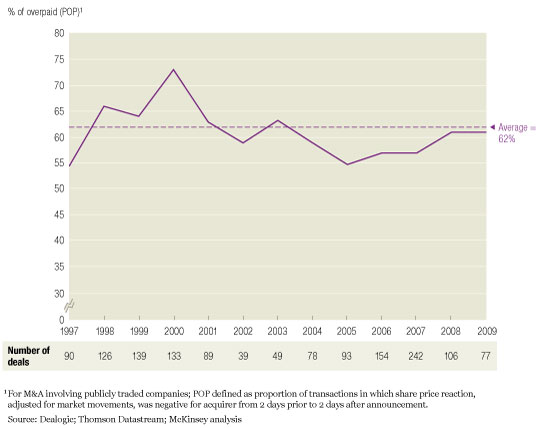
The reduction in DVA since then has resulted from a continuing decline in the average value created for acquirers. This decline is reflected in the increasing number of deals in which the market reaction has been negative for the acquirers, suggesting that they may have overpaid.4 Indeed, the proportion of overpaid (POP) stayed at 61 percent in 2009, the same as for 2008 (Exhibit 3). Although market skittishness in early 2009 may have skewed the index toward the high side, we believe it is still generally correct as an indicator. In some cases we observed, share prices fell following a merger’s announcement—even when the value of the cost synergies alone more than covered the premium paid and even when analysts deemed those estimates of synergies too conservative. Yet short-term market reactions, historically, have been a good indicator of long-term value creation through M&A.
Acquirers are losing discipline
. . . and growing?
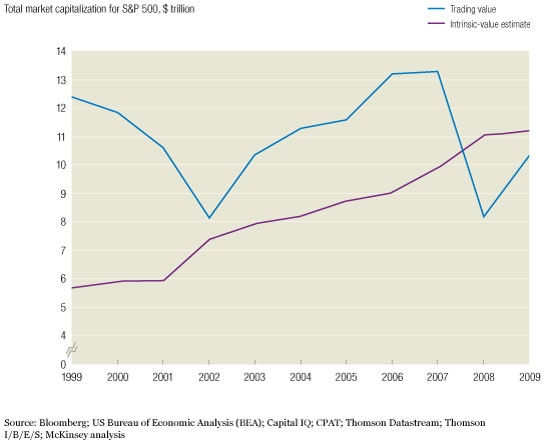
If the trends that produced the significant increase in fourth-quarter 2009 deal activity—up more than 40 percent from the average for the first three quarters—continue to operate, conditions appear right for the market’s further acceleration in 2010. For one thing, uncertainty in both the economy and the stock market has fallen dramatically over the past year, with volatility5 hovering between 20 and 25 percent at the end of 2009, down from its peak of around 80 percent in late 2008. Also, both the credit and the equity markets are again financing M&A deals; credit spreads are back to reasonable (though not pre-crisis) levels; and the IPO market, virtually closed in the first half of the year, is now trending toward a 40 percent increase over 2008. Finally, even if stock markets have recovered very strongly, market valuations are still favorable compared with historical levels. Indeed, the market value of the S&P 500 as of December 2009 remained below its intrinsic value,6 though it closed most of the gap seen in 2008 (Exhibit 4). If a wave of M&A does materialize, as many expect, large public companies should be particularly well positioned to benefit.
Strong fundamentals
In addition, during the past two years the balance sheets of large public companies have accumulated record levels of cash, which can now be put to work. Their share prices have significantly outperformed those of their smaller counterparts over the past three years, creating a strong M&A currency. Moreover, they have historically outperformed their smaller industry counterparts operationally (measured by EBITA7 margin) across many sectors, but especially in pharma, biotech, high tech, telecommunications, the media, and consumer and retailing. In several sectors, this performance gap is increasing, and large companies can create even more value by acquiring smaller, inefficient ones and improving their operations and margins.
Private-equity players are also poised for a return to M&A, as hinted by the fourth-quarter volumes. They still have considerable access to capital—with “dry powder” estimated earlier this year at around $500 billion. True, they may be at a disadvantage, compared with their standing before the crisis, given their expected debt/EBITDA8 ratios of three to four, compared with boom-year levels of between five and seven. That said, all signs indicate that they will regain their presence in the global M&A market, accounting for as much as 10 percent or more of it over the short to medium term.
Related Articles