In 1854, Daniel McCallum took charge of the operations of the New York and Erie Railroad. With nearly 500 miles of track, it was one of the world’s longest systems, but not one of the most efficient. In fact, McCallum found that far from rendering operations more efficient, the scale of the railroad exponentially increased its complexity.1
The problem was not a lack of information: the growing use of the telegraph gave the company an unprecedented supply of nearly real-time data, including reports of accidents and train delays.2 Rather, the difficulty was putting that data to use, and it led McCallum to develop one of the era’s great low-tech management innovations: the organization chart. This article presents that long-lost chart (see sidebar, “Tracking a missing org chart”) and shows how aligning data with operations and strategy—the quintessential modern management challenge—is a problem that spans the ages.
‘Big data,’ then and now
Just as information now floods into companies by the tera-, peta-, and exabyte, during the mid-19th century, governments, businesses, and universities produced and grappled with what one historian has called an “avalanche of numbers.”3 To be sure, McCallum’s rail lines may not have generated even a megabyte of information. But this was indeed big data for him and his senior deputies, who were managing a system of unprecedented proportions. Although the telegraph’s speed made more information available, organizing and acting on it became increasingly difficult. One delayed train, for example, could disrupt the progress of many others. And the stakes were high: with engines pulling cars in both directions along a single set of rails, schedule changes risked the deadly crashes that plagued 19th-century railroads.
As McCallum reflected, “A superintendent of a road 50 miles [long] . . . may be almost constantly upon the line engaged in the direction of its details.” But on railroads like his, which stretched for hundreds of miles, no individual manager could be responsible for all of the necessary schedule changes. (See exhibit, “The first modern organization chart,” for McCallum’s solution.)
The first modern organization chart
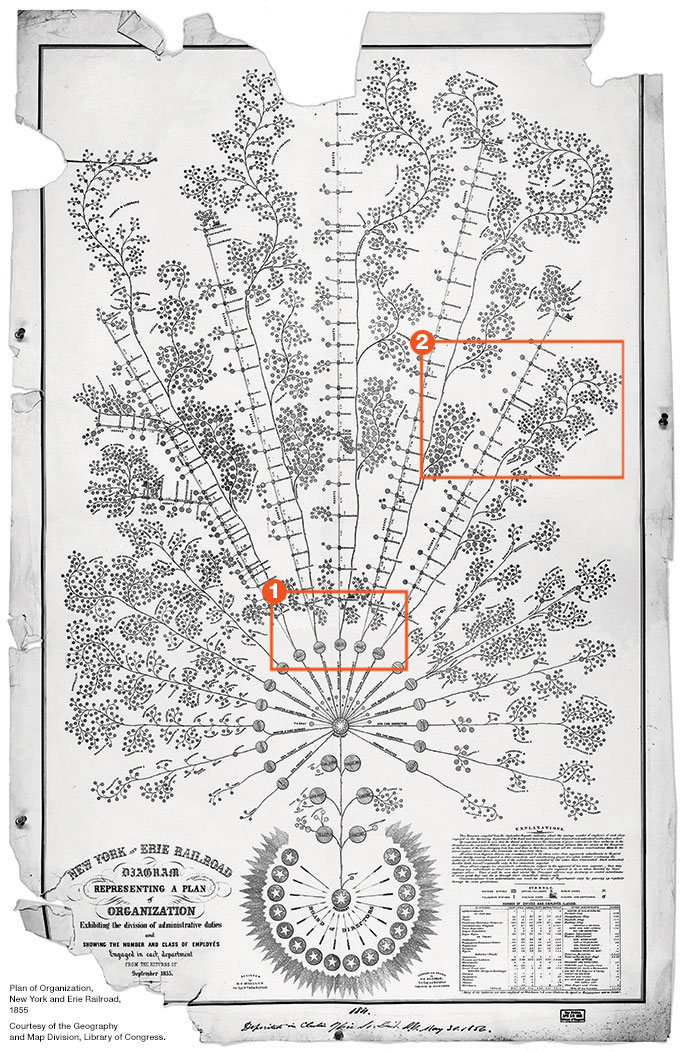
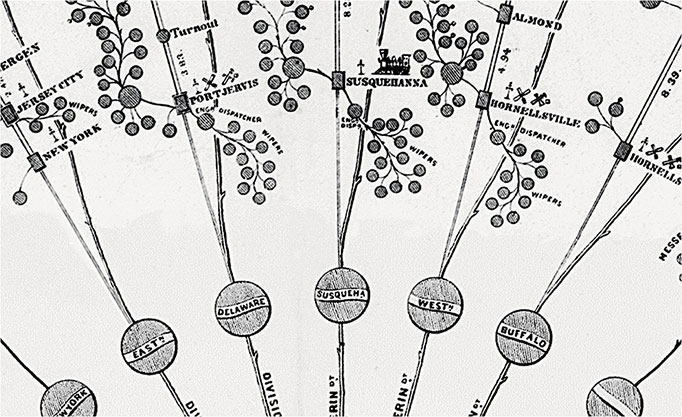
Inset 1
Daniel McCallum created the first organization chart in response to the information problem hobbling one of the longest railroads in the world. In surprising contrast to today’s top-down organization pyramids, in McCallum’s chart the hierarchy was reversed: authority over day-to-day scheduling and operations went to the divisional superintendents down the line, who oversaw the five branch lines of the railroad. The reasoning: they possessed the best operating data, were closer to the action, and thus were best placed to manage the line’s persistent inefficiencies.
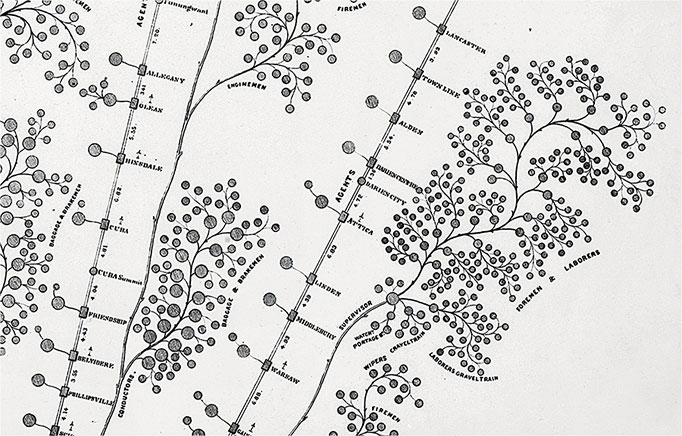
Inset 2
Each superintendent was responsible for the physical geography of the tracks and stations and for the men who moved along the rails: conductors, brakemen, and laborers. Coordinating activities between these two branches, the superintendents managed both the fixed depots and the rolling stock that moved between them.
Reversing the information hierarchy
In crafting the organizational plan, McCallum sought to improve the way the railroad used information. Through 21st-century eyes, the chart looks both antiquarian and surprisingly modern. Far from the static, hierarchical pyramids that we today associate with such charts, his was modeled after a tree. McCallum drew the board of directors as the roots, himself and his chief officers as the tree’s trunk, and the railroad’s divisions and departments as the branches.
Critically, McCallum gained control by giving up control, delegating authority to managers who could use information in real time. He put what we would call the organization’s C-level at the ground level, supporting the railroad, not directing its operations. Following one of McCallum’s key precepts—“a proper division of responsibilities”—authority over day-to-day scheduling went to the divisional superintendents down the line.
Most of the chart spans the domains of these superintendents: the railroad’s five branch lines. Each superintendent was responsible for two subbranches of the tree. The first was a straight branch representing the physical assets of tracks and stations, the second a winding branch consisting of the men who moved along the rails, from the conductors and brakemen on the trains to the laborers who maintained the tracks. The divisional superintendents were responsible for coordinating these two branches—the depots and the rolling stock, and the employees who moved between them.
Even as McCallum decentralized decision making along the railroad, he also insisted that targeted metrics had to be reported back to its board of directors. That data flowed down from the branches of the tree to its roots, where McCallum and the board could use the information for oversight and long-term decision making. Here, McCallum’s goal was prioritization: assuring that the board, with its finite capacity, received relevant and actionable data. As “interesting as this information is,” he reflected, it is only in its “practical application . . . that its real value consists.” McCallum therefore designed a system of hourly, daily, and monthly reports that enabled him to calculate practical metrics, such as cost per ton-mile and average load per car. By comparing the profitability and efficiency of different routes, the board could identify opportunities for improvement.
A message for today’s leaders?
Modern managers, of course, have more sophisticated tools than McCallum did. Top executives can now access detailed data, often in real time. Today’s powerful battlefield-management systems, for instance, give generals the ability to direct combat missions at the microlevel, which was invisible to the board of the New York and Erie.
But while cheaper storage space and bandwidth will make such granular management options increasingly tempting, will they be optimal? Executive attention spans are already stressed, and many leaders report that they are overwhelmed by copious data flows.4 A more fruitful approach might begin with McCallum’s low-tech reflections on organizational structures and priorities. Within today’s organizations, emerging social networks—often married to sources of big data—have a certain kinship with McCallum’s logic. These networks too provide opportunities for greater information sharing and collaboration at relatively low levels in the organization, and they too can improve operations, customer service, and innovation. Curiously, digital mappings of these social interactions bear a resemblance to the nodes and branches of McCallum’s chart.
Drowning in the details of operations, Daniel McCallum stepped back and redesigned the railroad’s organization. His insights on how to meld local authority with information gave his managers better operating tools—which are just as relevant in the age of the Internet as they were in the age of the telegraph.
Related Articles

The global company’s challenge

Are you ready for the era of ‘big data’?