By almost every headline number, the asset management industry is having one of its best years in a decade. But by almost every measure that matters to an individual firm, it has rarely been harder to win.
Global assets under management (AUM) reached a record high in 2025. Net flows remained resilient despite geopolitical uncertainty and changing interest rate expectations. ETFs reached new milestones, active ETFs moved further into the mainstream, and private markets continued to attract incremental capital even as the traditional fundraising cycle remained constrained.
Yet the defining feature of 2026 is the increasingly selective distribution of that success. In 2024, the opportunity was to look beyond traditional balance sheets, and in 2025, the defining theme was convergence. Those forces remain in motion, but they are now interacting with another structural shift: the narrowing of the lanes for capturing growth.
Where growth will come from is clear. The more consequential question is why an increasing share of that growth is accruing to a relatively small group of firms.
This year’s report examines that question in four parts. First, we look at an industry that has record assets and resilient demand but increasingly concentrated flows. Second, we examine why stronger revenue has still not restored operating leverage. Third, we explore the structural forces behind growing concentration and ask where “plenty for the few” is—and is not—becoming the dominant competitive model. Finally, we set out an agenda for managers seeking to build investment, access, distribution, and operating alpha in this environment.
A golden age, unevenly distributed
The long-term growth story of asset management remains intact. Global third-party managed assets reached $151 trillion at year-end 2025, the highest level on record (Exhibit 1), and the first half of 2026 points toward another record.
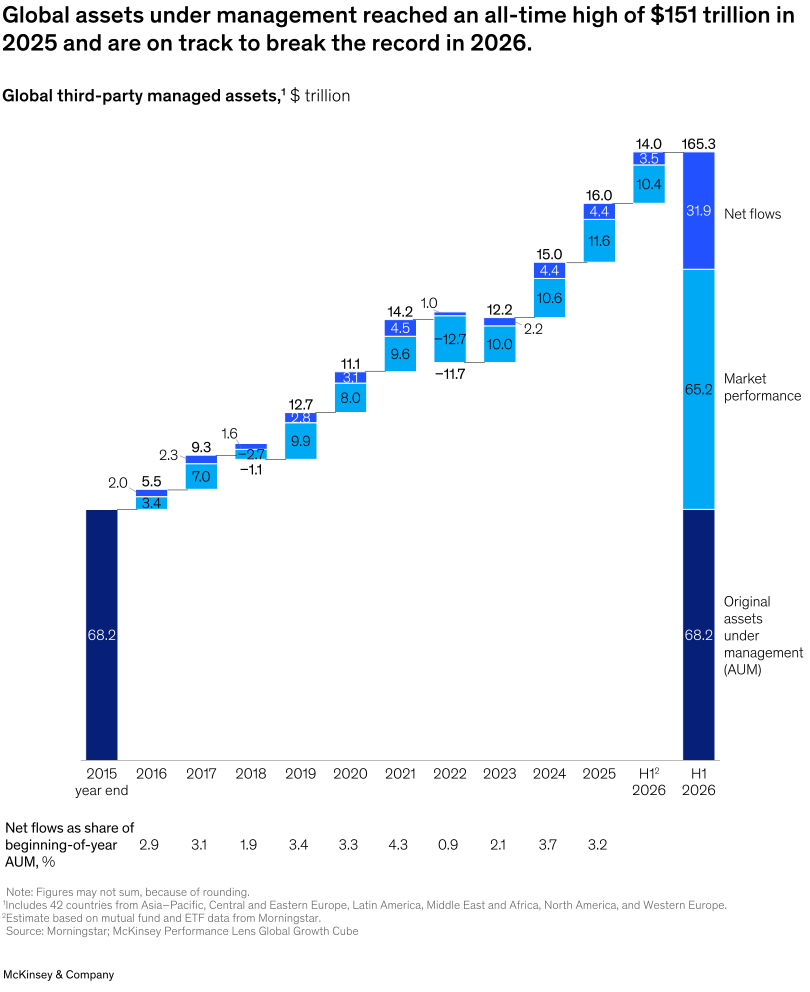
Organic growth remains healthy. Net flows were equivalent to 3.2 percent of beginning-of-year AUM in 2025, within the industry’s long-run range. Annualizing the first half of 2026 would put the industry closer to 5 percent, potentially the strongest organic growth rate of the past decade.1
Markets rise, but leadership narrows
But the strength of the headline numbers masks an important change in the composition of returns. Market leadership has become unusually concentrated, particularly in the United States. Dispersion in forward valuations across the S&P 500 has widened, while AI-related sectors have generated outsize returns relative to the broader index.
The AI trade is driving an enormous build-out of physical infrastructure as hyperscalers move from asset-light balance sheets to data centers and power that must be financed, and as investors rotate from public credit to private to fund the build-out at higher yields. The same theme that concentrates public-market returns is quietly concentrating private-market origination, where deals of this scale can be sourced and financed by only a handful of platforms.
Money keeps moving
Investor behavior tells the same story as the markets: broadly positive but increasingly selective about where money goes. In the Americas, flows into asset management have remained steady, with retail investors accounting for roughly 85 percent of net flows. Continued wealth creation has supported demand even amid periods of macroeconomic uncertainty.
Europe has been the surprise performer. First-half 2026 flows rivaled what the region gathered in all of 2025, and growth broadened beyond the region’s three largest markets. Asia’s longer-term growth engine also remains intact, supported by household wealth accumulation, a gradual shift from deposits to investment products, and the continued deepening of domestic capital markets. China’s asset-management industry remains central to that story: Total AUM across licenses exceeded $26 trillion in 2025, up 13 percent from 2024.
A new investment barbell takes shape
The asset-class picture makes investor selectivity even clearer. Many investors are buying the cheapest beta they can find and the most sophisticated alpha they can justify. Passive equity remains one of the industry’s largest flow engines, while active fixed income is enjoying an exceptionally strong period of demand.
Some of the strength in active fixed income reflects the attractive opportunity set for managers navigating duration and credit risk, but an important portion is also mechanical. Strong equity-market appreciation pushed portfolio weights above their targets, prompting investors to rebalance back toward fixed income. Passive fixed income is also growing, making bonds one of the few areas in which active and passive strategies could expand together. Active equity remains the outlier, with persistent outflows from traditional mutual fund vehicles.
ETFs become the dominant expression of demand
The wrapper through which investors access investment strategies is changing just as quickly. Global ETF assets have reached approximately $22 trillion.2 In the United States, ETFs represent an increasing share of fund assets, and active ETFs have moved decisively from niche to mainstream. Traditional passive ETFs still dominate flows, but active ETFs are now a meaningful source of both product innovation and asset gathering.
The growth of US ETFs is creating an increasingly bifurcated economic model. At one end are scaled manufacturers competing on cost, with enormous asset bases compensating for razor-thin fees. At the other end are specialists offering differentiated exposures that command substantially higher fees but operate with smaller asset bases and higher costs per dollar managed. The resulting revenue pools look very different from the distribution of assets. In the United States, products priced at ten basis points or less account for nearly 60 percent of ETF assets but only about 17 percent of revenue, while products charging more than 50 basis points represent only about 7 percent of assets but more than 30 percent of revenue.
This bifurcation makes ETFs a useful microcosm of the asset management industry itself. Growth is plentiful, but there is no single winning economic model. Advantage increasingly sits at both ends of the spectrum, with firms possessing either the scale to manufacture extraordinarily cheaply or the differentiation to sustain a premium. The middle is becoming a harder place in which to compete.
If the ETF was the defining wrapper of the previous decade, the token may be the defining experiment of the next. A handful of asset managers are beginning to tokenize funds so they can be funded directly from digital wallets, reaching investors who may never open a conventional brokerage account. Today, the capabilities required to build tokenized products—namely regulatory standing, technology, and scaled cash infrastructure—sit with a few large and specialized players. Tokenization is thus more likely to deepen concentration than to disperse it.
Private markets have abundance without liquidity
Private markets demonstrate a different version of the same paradox. The asset class has not lost its secular appeal, but the old fundraising rhythm remains jammed, and global closed-end fundraising is still roughly half a trillion dollars below its peak. Assets acquired during the high-valuation years remain on fund books, transaction volumes have been insufficient to clear the backlog, and limited partners receiving fewer distributions have less capital available for new commitments.
Recently, software has represented a meaningful share of both buyout and private-credit activity, and uncertainty about AI’s impact on software business models has pushed parts of that market into a deeper freeze. Transactions are delayed because buyers and sellers disagree on price, and because there is greater uncertainty about the underlying earnings and terminal value of some assets.
The slowdown is far from uniform. Private equity is most affected by weak transaction volumes. Real estate has begun to normalize, while infrastructure continues to benefit from durable demand. Private credit has encountered a more complicated environment, but institutional demand remains relatively strong in some areas. Looking beyond traditional closed-end commingled funds also reveals a healthier picture: Open-ended vehicles and transactions funded directly on balance sheets continue to expand. At the same time, new channels are broadening access to private markets.
Growth without operating leverage
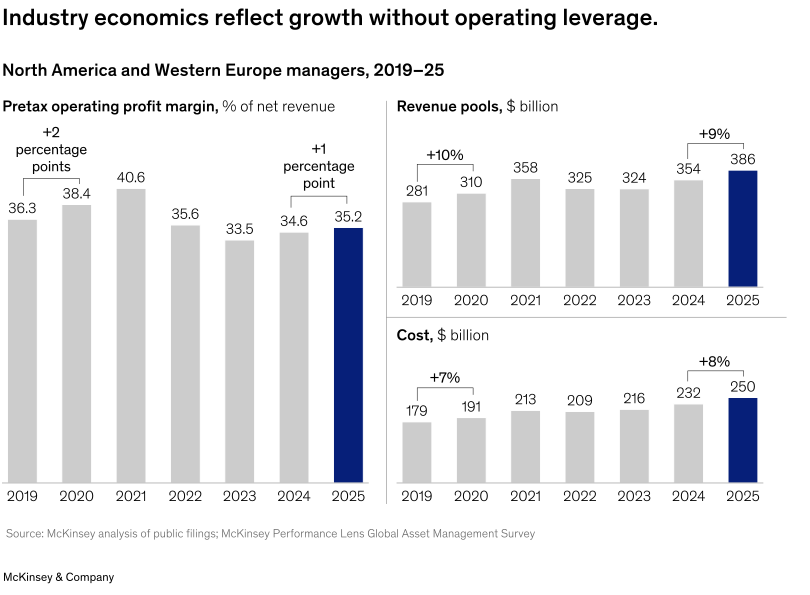
The industry’s surge lifted revenue: North American revenue pools increased by roughly 11 percent in 2025, with revenue up about 9 percent globally and about 4 percent in Europe. But costs rose almost as quickly, increasing about 10 percent in North America and 3 percent in Europe. Pretax operating margins improved only modestly. Once again, a powerful top-line environment failed to produce the degree of operating leverage that has historically accompanied comparable market growth (Exhibit 2).
Complexity consumes the upside
The industry’s cost base reached about $250 billion in 2025. Some of the increase is cyclical: Variable compensation rose alongside markets and revenue—investment-management spending increased about 8 percent, distribution 5 percent, and management and administration 11 percent. But the deeper issue is structural. Technology grew faster than any other functional center at 13 percent to reach $41 billion, with much of the recent increase coming from noncompensation spending.
The cost of growth itself is rising. It took about 19 cents to earn a new dollar of revenue in 2023; by 2025 it took 52 cents. Managers are paying more to support broader product ranges, additional wrappers, private-market capabilities, more-fragmented distribution, regulatory requirements, and technology modernization. At the same time, many are reducing head count in legacy areas while hiring talent in strategic ones. The result is an operating model caught between simplification and expansion.
This is the latest manifestation of a problem that has been building for several years. Product proliferation, bespoke processes, fragmented data, and layered technology architectures have accumulated into operational debt. Growth adds revenue, but it also increases complexity. Scale does not automatically create operating leverage when the underlying platform has not been designed to scale.
Before AI becomes a productivity dividend, it is another platform tax
Asset managers are investing in AI capabilities, yet scaled deployment remains limited relative to technology companies and several other industries.
According to our July 2026 AI in Asset Management Survey, the tangible value that asset managers are realizing in 2026 is focused within their technology functions. Early examples from industry leaders suggest meaningful potential in core functions of investment research, distribution, and operations. But for many firms, the investment is arriving before the savings. AI may yet bend the cost curve, but for now, it is still adding to the platform tax.
Strong markets have restored the industry’s growth engine without restoring its historical operating leverage. Rising compensation, technology investment, and operating complexity continue to absorb much of the benefit of higher revenue. Yet the industry averages obscure an important distinction: Not every manager is experiencing these economics in the same way.
Plenty for the few?
The widening gap between managers is one of the clearest features of the current cycle. An analysis of roughly 80 large traditional and alternative-asset managers shows that only a relatively small group simultaneously generated above-industry organic growth and expanded margins between 2023 and 2025. These firms benefited from the same market beta as everyone else, but they also translated growth into gains in economic share.
The significance of that cohort becomes clearer when looking at industry value creation. The consistent winners increased their share of incremental industry revenue between 2023 and 2025, and their share of incremental profit rose even faster.
Concentration extends across the industry
Concentration is accelerating in many of the markets that have been among the industry’s most important sources of growth (Exhibit 3).
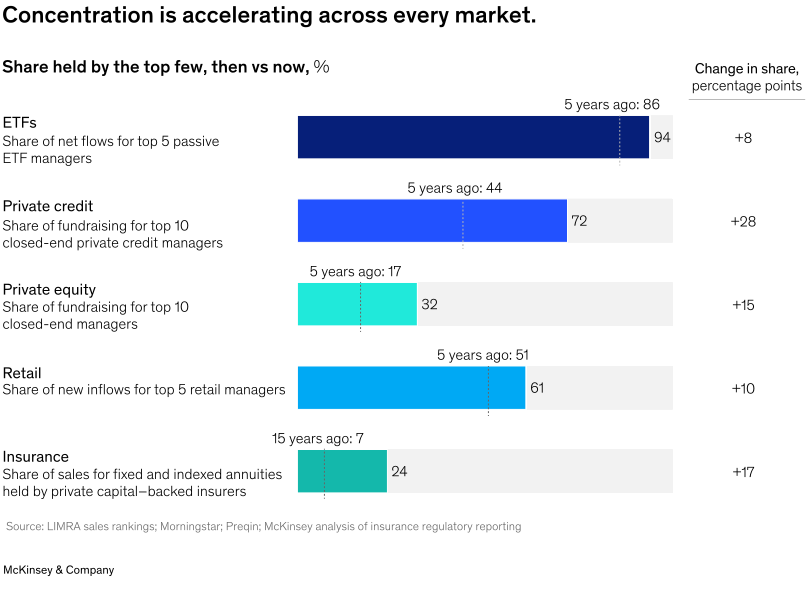
Passive ETFs were already highly concentrated, yet the share of US net flows captured by the five largest managers increased by another eight percentage points over the past five years, to 94 percent. Europe’s top five managers account for about 75 percent of passive ETF flows. Private credit has concentrated even more dramatically. The top ten closed-end managers now capture 72 percent of fundraising, up from 44 percent five years ago.
The same pattern is visible in retail and insurance, two of the most important sources of incremental flows. In the United States, the five largest managers now capture 61 percent of new retail inflows, compared with 51 percent five years ago. Europe’s top five managers secure 58 percent of retail flows. In insurance, private-capital-backed carriers have increased their share of fixed and indexed annuity sales from 7 percent 15 years ago to 24 percent today. What makes these shifts consequential is likely not concentration alone. Concentration is increasing precisely in many of the markets the industry has been relying on for its next generation of growth. In market after market, the pie is growing and the number of hands getting a hefty slice of it is shrinking.
These markets differ in product, client base, and economics, which suggests that concentration is not the result of one cyclical phenomenon. Five structural forces appear to be pushing value toward a smaller number of advantaged positions:
Clients are consolidating relationships. For intermediaries, this could reduce the operational complexity created by enormous product shelves and create opportunities for more-integrated economics and service. For large institutions, deeper relationships could provide anchor pricing, co-investment rights, customized access, and more-strategic engagement.
Portfolio construction is simplifying even as the underlying opportunity set expands. This shift could advantage managers that can address a broader portion of the portfolio and participate in the portfolio-construction decision itself.
Decision-making power is concentrating at control points. Model portfolios, turnkey asset-management platforms, RIA consolidators, outsourced chief investment officers, and insurance platforms increasingly influence where capital lands, and are beginning to test their pricing power. The largest managers can absorb such tolls because the platforms cannot afford to exclude them; smaller managers cannot, and pay the difference in margin.
Access itself is becoming a form of alpha. In private markets, proprietary origination, scarce capacity, and capital-markets relationships determine the opportunity set before security selection begins. The same logic applies to pre-IPO investing, where more economic value accrues before companies reach public markets. Google went public in 2004 at about $23 billion; SpaceX went public this year at roughly $1.77 trillion. The best returns of a generation are increasingly earned before most investors are allowed in.
Technology is simultaneously democratizing capabilities and reinforcing platform advantage. Generative and agentic AI could make research, coding, content creation, and client personalization more accessible to smaller firms, but the ability to bring public and private data onto a single analytical platform is becoming a scarce capability.
How traditional active management is unbundling
Together, these forces are reshaping where economic value sits in the asset-management ecosystem, with newer business models positioning themselves to capture an increasing share of that value. No single competitor is dismantling the traditional active core. Each takes only the piece it is structurally best placed to own. Whole-portfolio and multi-asset providers use client relationships and those same control points to claim portfolio construction itself.
Newer entrants are hungrier still. Scaled-venture investors capture the returns that increasingly accrue before a fast-growing company ever reaches the public market, where the traditional active core creates portfolios. Multistrategy hedge funds sell the one thing a concentrated market makes scarce—diversified alpha—and fund it partly out of the same budget that once flowed to long-only active management. Each rival is, in effect, cheaper, more convenient, or more scaled at the specific job it has chosen. Each leaves many in the traditional core of the industry with the least defensible ground: undifferentiated active return priced as though it were alpha (Exhibit 4).
The traditional active core is being disassembled, one profitable piece at a time. One strategic question could become more demanding: What scarce economic value does a manager provide that another part of the ecosystem cannot replicate more cheaply, more conveniently, or at greater scale?
Concentration isn’t destiny
Concentration varies materially by market. Some revenue pools increasingly resemble winner-take-most markets; others can support multiple differentiated competitors. Thinking about markets along two dimensions—growth and concentration—reveals four distinct competitive arenas (Exhibit 5).
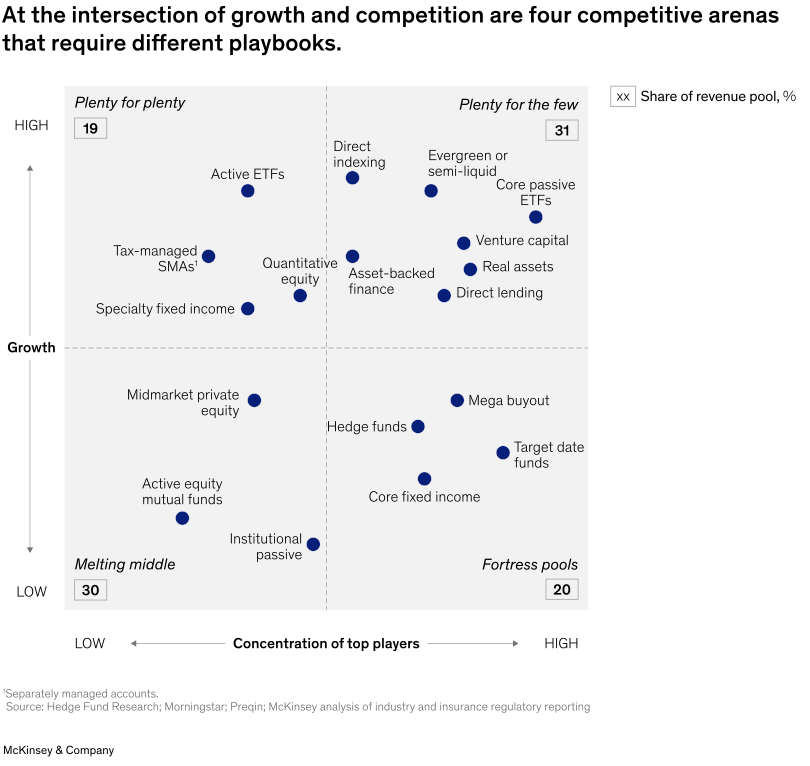
- “Plenty for the few” markets combine high growth with high or rising concentration. Success requires scale, access, distribution, or investment edge.
- “Plenty for plenty” markets combine attractive growth with room for multiple winners. The question is whether the firm has distinctive edge and consistent execution.
- “Fortress pools” are more concentrated but slower growing. Incumbents can enjoy durable economics, but new entry is difficult without inorganic path or clear differentiation.
- The “melting middle” contains slower-growth markets with fragmented competition. Economics are less forgiving; the strategic question is where to compete and where to stop.
Scale, while important, is not the only source of advantage. The task for management teams is to understand the evolving competitive structure of each revenue pool and determine whether the firm possesses—or could realistically build—the capabilities required to win.
Winning in an era of concentrated prosperity
Investment performance remains foundational, but it is no longer sufficient on its own. Managers seeking durable growth need advantages that extend across the firm and become stronger as the industry becomes more complex. Our experience points to four forms of alpha:
Investment alpha: Ride the theme, diversify the risk, rebuild the engine
The first priority is to strengthen the investment proposition for a market in which concentration, thematic rotations, and AI are reshaping opportunity sets. Managers could take a deliberate view on exposure to AI-related investments across the value chain. Investment organizations will also likely need to determine where AI can create a fit-for-purpose research edge.
Access alpha: Own what clients cannot easily buy themselves
As more economic value accrues outside public markets, proprietary access to investment opportunities becomes increasingly important. Origination networks, capital-markets relationships, scarce capacity, local partnerships, and differentiated sourcing could create investment opportunities that clients cannot reproduce independently. Building this access organically will be unrealistic for many managers; partnerships and selective M&A could therefore become part of the investment strategy itself.
Distribution alpha: Massively scale client reach
AI-enabled prospecting, personalization, content generation, and sales support could increase wholesaler productivity and make previously uneconomic client segments addressable. But managers need the wrappers clients increasingly prefer, such as active ETFs, model portfolios, separately managed accounts, and appropriate evergreen structures. They also need proximity to the control points that determine shelf placement and portfolio inclusion.
Operating alpha: Turn the platform tax into a scale advantage
Finally, managers could convert the cost of modernization into an operating advantage. Leading firms could take a zero-based view of products, workflows, data, and technology; redesign domains front to back; simplify product and application footprints; and decommission legacy complexity. Data should become a compounding asset rather than another fragmented cost center.
Plenty—for whom?
This is an era in which scale matters more than ever—in distribution, in technology, in the ability to originate what others cannot. Some markets will reward a few scaled or differentiated leaders, while others will support a wider field. Still other markets offer too little growth to justify the entry fee and will keep consolidating.
Asset managers could ask themselves several hard questions: Where do we have the right to win? Where could we build and deepen that right? And—the question almost no one asks—what should we stop doing? During the previous decade, the industry rewarded addition: more products, more strategies, more shelves. The next decade will reward subtraction.
Plenty will be for the few who know which games they can win and have the scale and skills to win them. A golden age awaits those who are clear-eyed enough to claim it.

