The period since the start of 2025 has been one to remember for the metals and mining industry. Conflicts have disrupted trade routes and highlighted supply-chain vulnerabilities; trade restrictions that once centered on a handful of critical minerals now extend to scrap; and governments and companies have been prompted to allocate ever larger sums to regionalization of supply chains.
All of this has played out against a macroeconomic backdrop marked by persistent uncertainty that has sent central banks and investors alike into gold, and rising expectations that AI will deliver a step change in industry performance while adding new sources of demand. But while the productivity toolbox has grown ever larger, and the industry sits on record profitability and cash, overall productivity did not improve.
What will define the next era of materials growth? Webinar
Wednesday, October 14, 2026 10:00 a.m. CET | 4:00 p.m. SGT OR 11:00 a.m. ET | 5:00 p.m. CET Over the past year, the materials industry has entered a more complex environment. Commodity markets remain resilient, but many of the assumptions that shaped the sector over the past two decades are being challenged. These shifts are expanding the range of strategic choices facing industry leaders. Join us for the launch of our 2026 Global Materials Perspective, where McKinsey experts will discuss what these developments could mean for competitiveness, investment, and growth across the materials value chain. We are hosting two sessions on Wednesday, October 14th to cover all time zones:
As in previous years, our aim in this Perspective is to distill the main points of interest from our research and industry discussions. In summary, the materials industry has seen five significant shifts since last year’s report, in the state of the industry, supply concentration and trade, availability and growth, productivity and affordability, and sustainability.
- State of the industry: Metals and mining delivered record returns in 2025, yet with a shift in value pools toward gold and copper and diverging shareholder returns depending on commodity exposure.
- Supply concentration and trade: Governments increasingly see materials as central to their strategic priorities and are now observed extending trade measures and export restrictions to scrap; yet these measures have so far not significantly changed the supply concentration for most materials.
- Availability and growth: Capital and talent may need to be boosted and reshuffled as demand shifts across regions and broadens into new sources such as data centers.
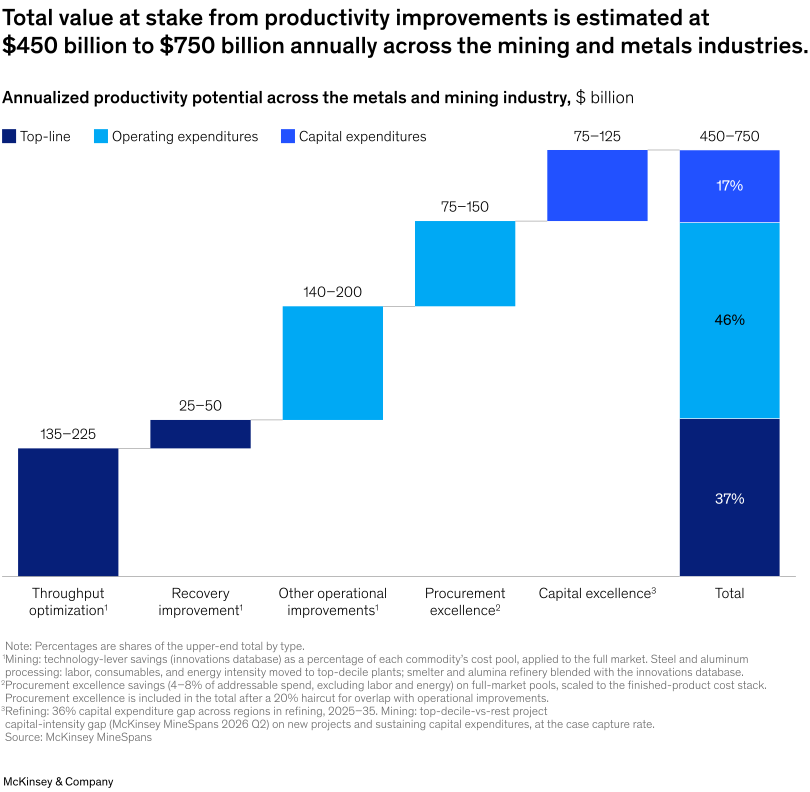
- Productivity and affordability: Temporary stagnation of productivity could give rise to potential productivity improvements, estimated at $450 billion to $750 billion annually, representing roughly 15 to 25 percent of industry revenues if captured at scale.
- Sustainability: The push for recycling and resilience may mean more regulation and rising costs in scrap markets, with both Europe and the United States moving to restrict exports.
MineSpans market intelligence services
Offer a comprehensive outlook of the metals and mining industries. Built by McKinsey’s commodities experts, and covering more than 14,000 global assets across more than 15 commodity value chains, our detailed bottom-up supply and demand forecasts, granular cost models, and ESG data empower decision makers.
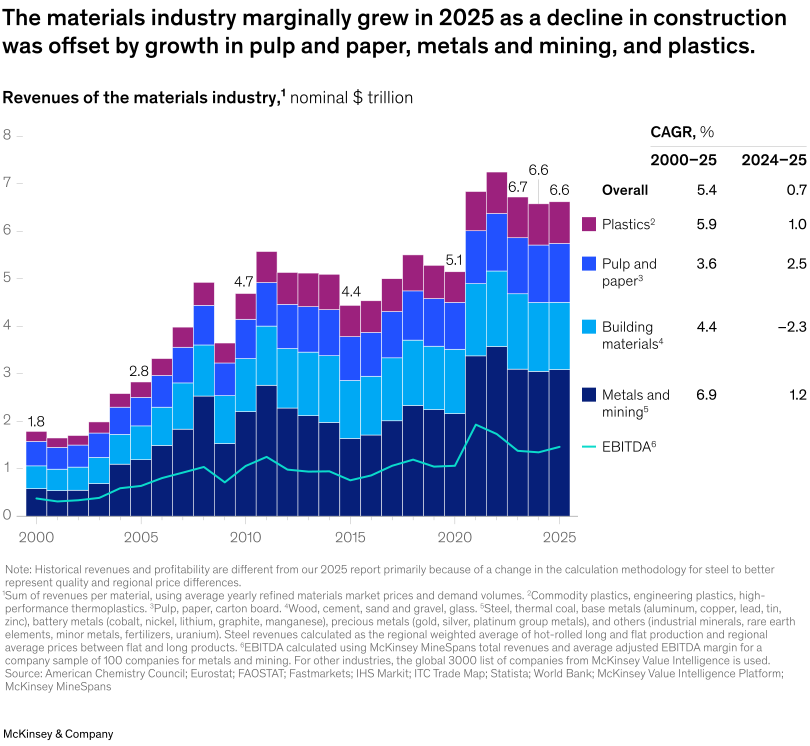
The materials industry marginally grew in 2025 as a decline in construction was offset by growth in pulp and paper, metals and mining, and plastics.
In a year characterized by price volatility and shifting trade conditions, materials revenue grew in 2025 by just over 1 percent to approximately $6.6 trillion, with the decline in construction being offset by growth in pulp and paper, metals and mining, and plastics.
This resilient performance ranks 2025 as the sector’s fourth highest-earning year in the past two decades, with all four of these occurring in the last five years.
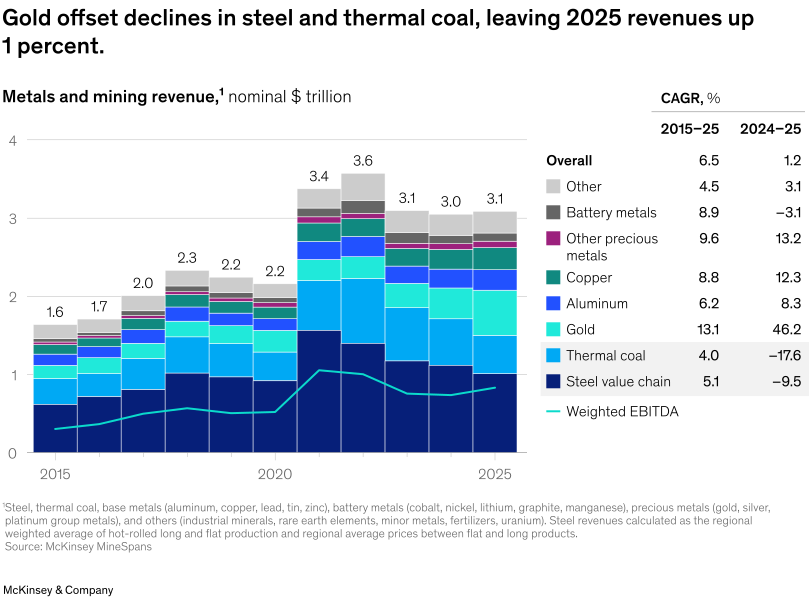
Gold offset declines in steel and thermal coal, leaving 2025 revenues up 1 percent.
For metals and mining revenues, gold, copper, and aluminum offset declines in both thermal coal and steel, leaving 2025 revenues up 1 percent from the prior year.
This is a continuation of a longer-term shift in industry value pools from steel and thermal coal to gold, copper, aluminum, and other precious metals.
At their peak, steel (including iron ore and metallurgical coal) and thermal coal accounted for 65 percent of industry revenue in 2021 and have since seen that share decline to 49 percent in 2025. Falling prices drove the decline in both, and steel also suffered weaker demand as China’s construction sector slowed.
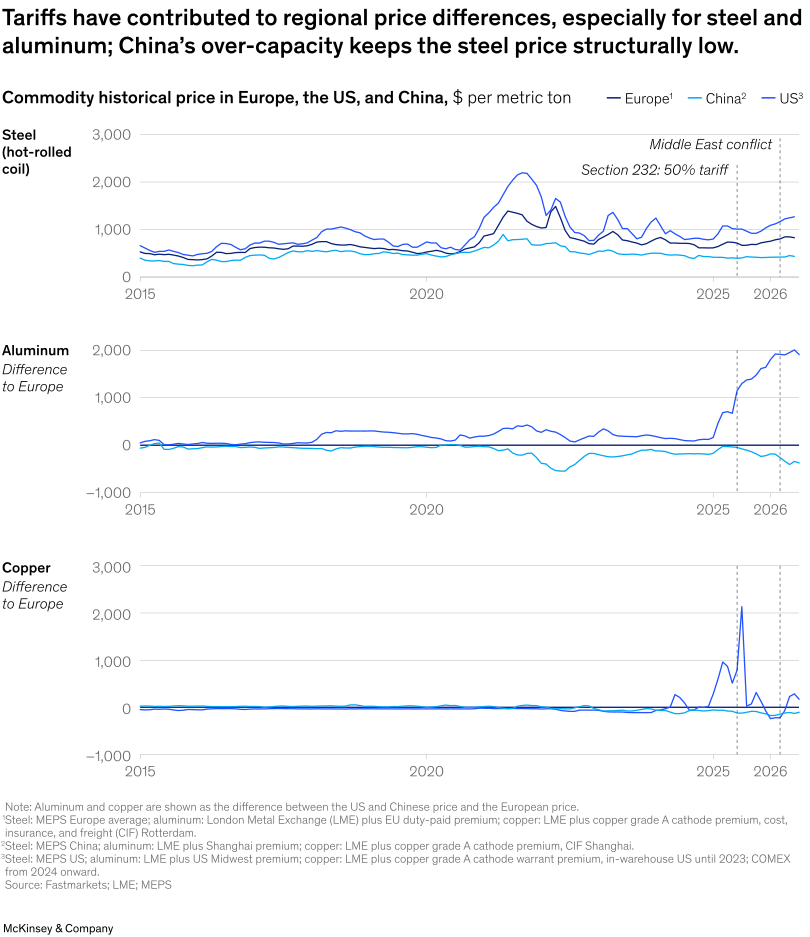
Tariffs have contributed to regional price differences, especially for steel and aluminum; China’s over-capacity keeps the steel price structurally low.
Steel prices have diverged by region, with overcapacity in China keeping the steel price low and tariffs in Europe and the US sustaining regional price premiums.
Aluminum followed a single global price from 2015 to 2024. Regional prices diverged when the US tariff increased to 50 percent in June 2025.1 This created a US-only premium that pushed US prices past $6,200 per metric ton by mid-2026.
Copper, by contrast, shows no regional divergence. Global AI and electrification demand, combined with mine supply losses, drove copper’s rally to over $13,500 per metric ton by mid-2026. The potential for further tariffs contributed to elevated copper prices. US and European prices began to diverge amid increased US stocking activity.
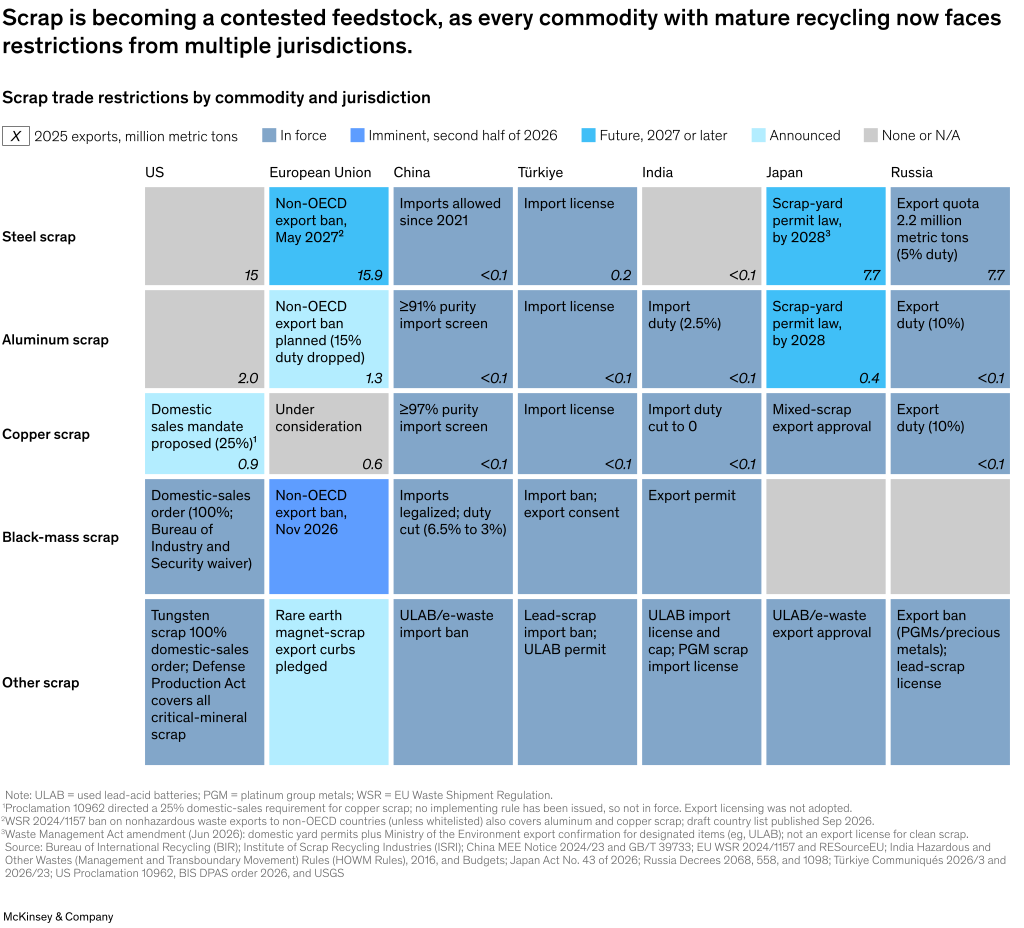
Scrap is becoming a contested feedstock, as every commodity with mature recycling now faces restrictions from multiple jurisdictions.
Restrictions increasingly extend beyond primary materials to scrap. For countries that are net importers of materials, restricting scrap supply can provide a means to reduce that import dependency, while at the same time offering a lower carbon alternative to primary supply. The economic viability of this production route depends on the scrap quality, with processing cost being higher for lower-quality scrap.
The European Union, the United States, Japan, and Russia restrict outbound flows of scrap with duties, licenses, quotas, orders, and bans.
China, Türkiye, and India—historically among the largest global importers of scrap—have introduced measures aimed at restricting imports to higher-quality grades, including purity thresholds, duties, and licensing requirements.
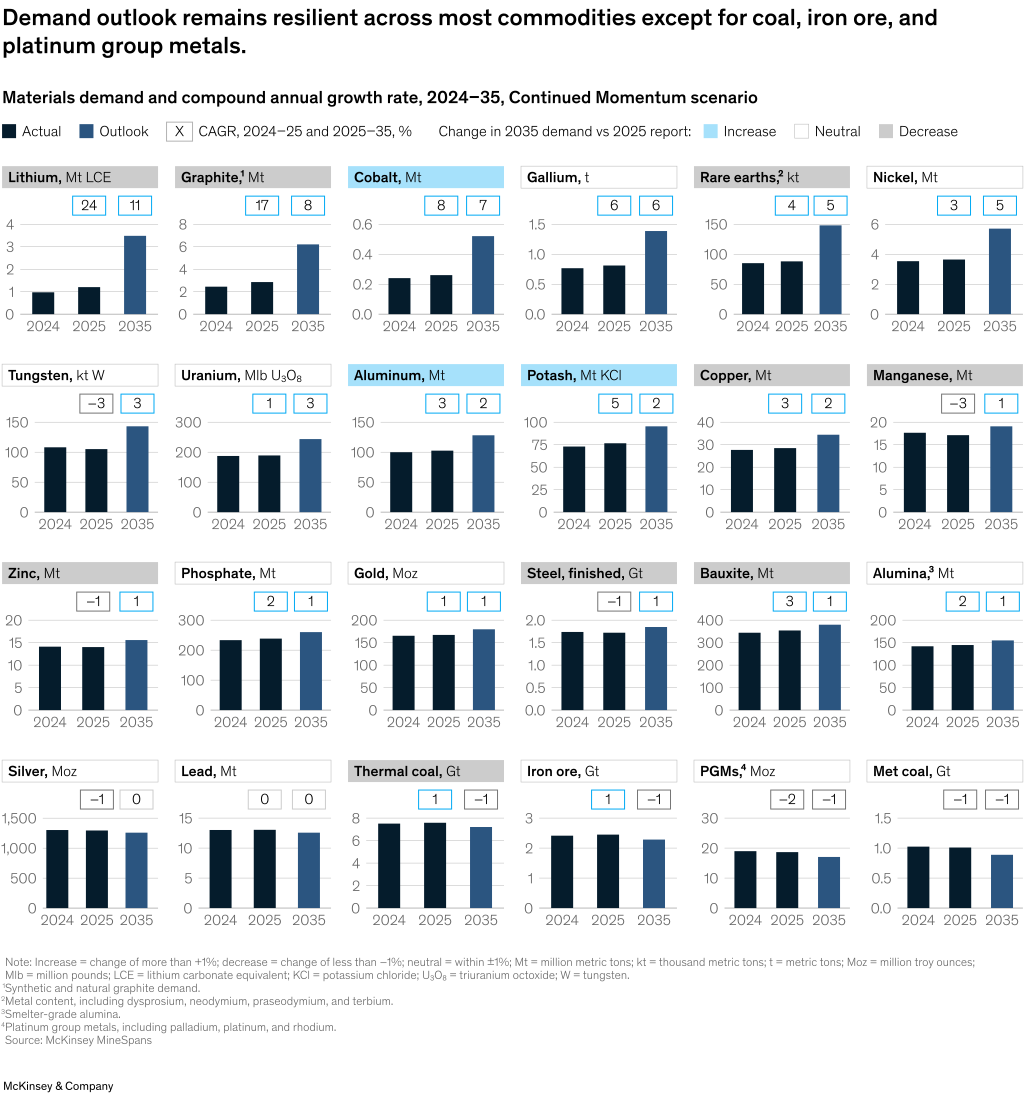
Demand outlook remains resilient across most commodities except for coal, iron ore, and platinum group metals.
Although projected demand growth until 2035 for several commodities decreased compared with last year’s report—a continuation of last year’s trend—overall materials demand remains resilient except for coal, iron ore, and platinum group metals (PGMs). Several materials are also seeing a diversification of demand from data centers and the defense industry, among others.
Battery materials saw a downward revision due to a slower than expected transition to electric vehicles yet continue to be among the fastest-growing materials in the industry, with expected growth rates of 5 to 11 percent per annum until 2035. Conversely, the slower expected transition increased the outlook for PGMs used in ICE vehicles.
The outlook on steel and iron ore has also become more modest due to a further expected slowdown of the construction industry in China. The outlook for metallurgical coal remained stable due to an expected slower shift from blast furnace–basic oxygen furnace (BF–BOF) toward alternative steelmaking technologies.
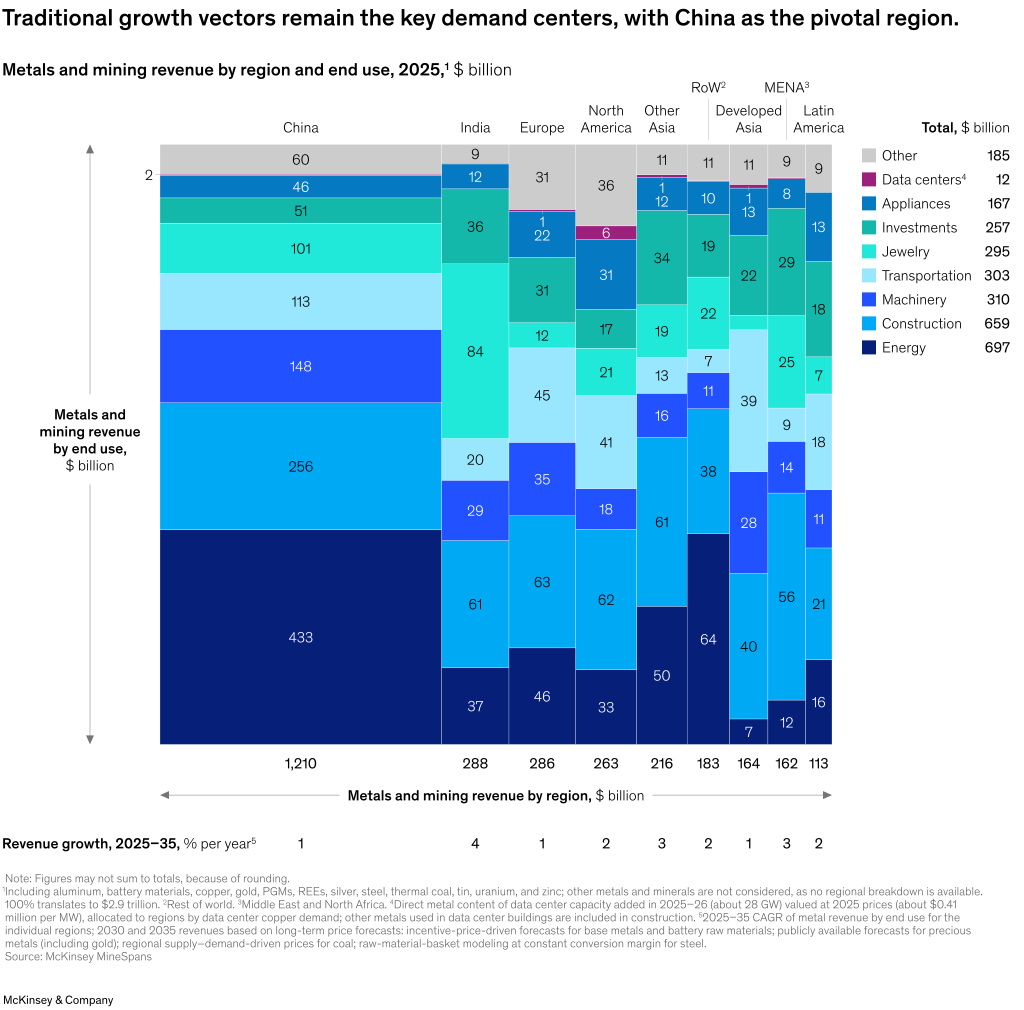
Traditional growth vectors remain the key demand centers, with China as the pivotal region.
Metals demand continues to be driven by traditional sectors linked to global middle-class development, with the largest drivers of total metals and mining revenue in 2025 being the energy and construction industries, followed by industrial machinery, transportation, and jewelry—the latter seeing its share increase substantially in 2025 as a result of increasing gold prices.
The sector is seeing new sources of demand, including those related to the global deployment of data center capacity and increasing investments in the defense sector, among others. Data centers already accounted for about 0.5 percent of the industry revenue in 2025 (equivalent to about $12 billion), a share that is expected to increase in the coming years.
China accounts for the largest regional share with about 40 percent of the total metals and mining revenue in 2025, although faster growth is expected in North America, India, and Other Asia markets, which may reduce China’s overall share in the next decade.2
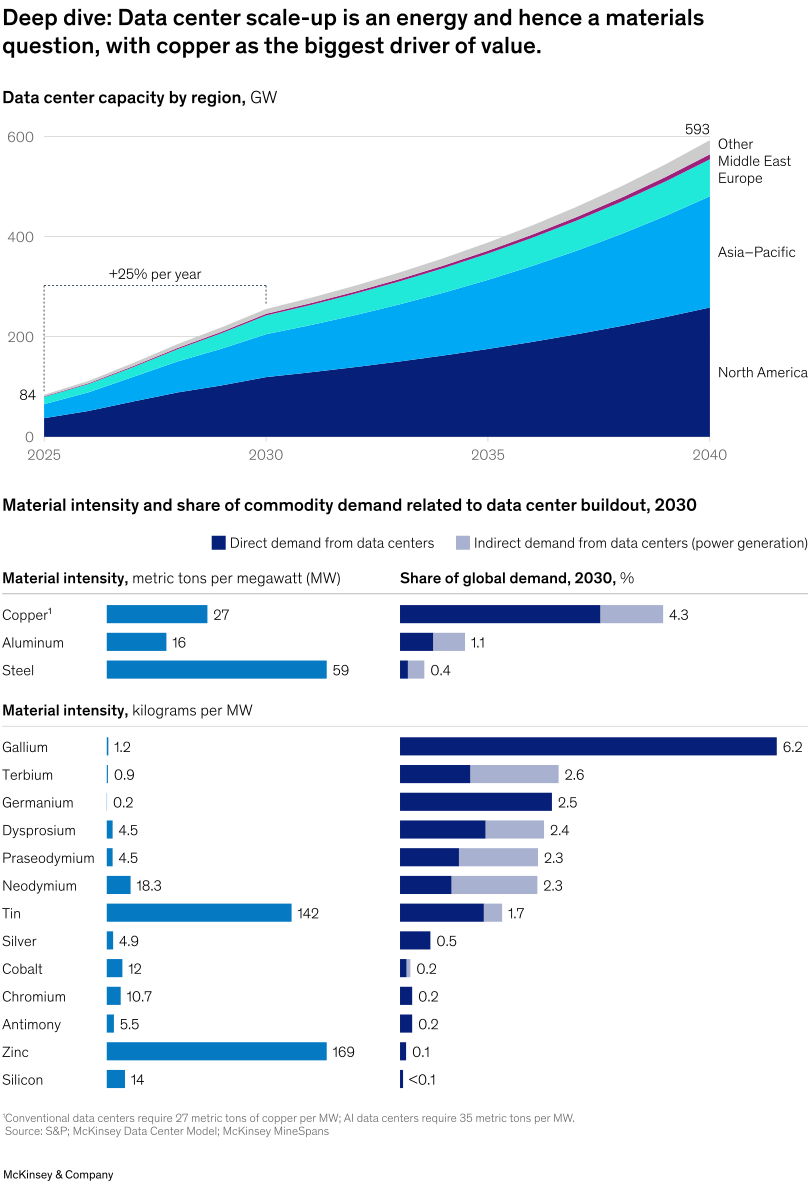
Deep dive: Data center scale-up is an energy and hence a materials question, with copper as the biggest driver of value.
In one of the most impactful demand shifts since earlier outlooks, global data center capacity is set to grow roughly 25 percent a year, from 84 gigawatts (GW) in 2025 to nearly 600 GW by 2040, driven largely by North America and Asia–Pacific.
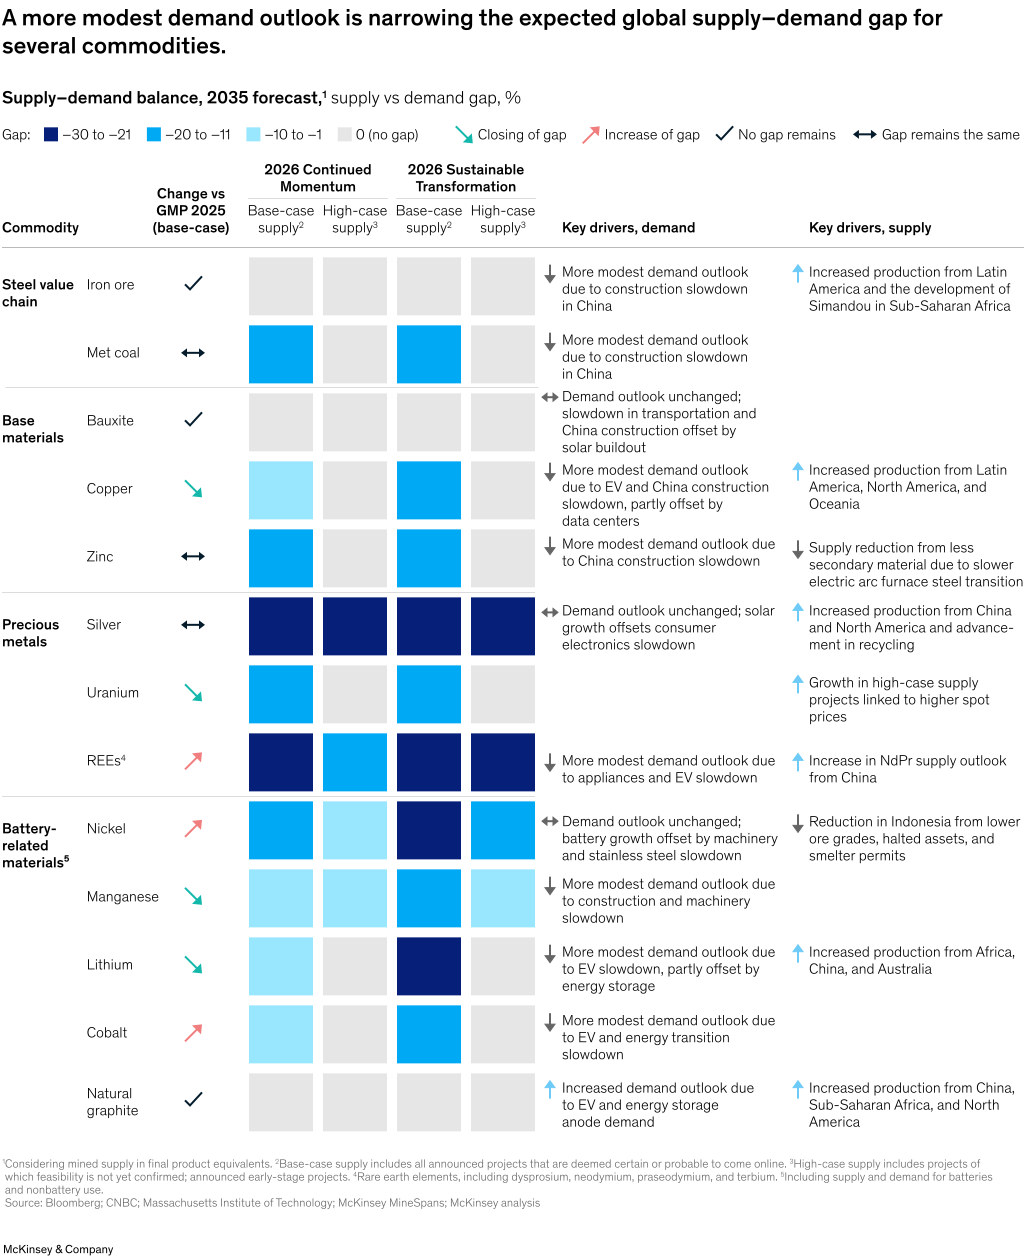
A more modest demand outlook is narrowing the expected global supply–demand gap for several commodities.
Bringing supply and demand together, the expected supply–demand balances for 2035 have stabilized or improved across all commodities in the scope of the analysis, compared to last year’s Perspective.
However, supply–demand imbalances are still expected for most commodities, especially in a base-case supply scenario, and for four commodities in a high-case supply scenario (silver, rare earths, nickel, and manganese).
The commodities for which a supply–demand imbalance may be expected in a scenario with accelerated global decarbonization (“sustainable transformation”) remain unchanged, although the expected imbalances become more pronounced.
As shown in last year’s report, there are several innovations that could positively impact, if not resolve, these supply–demand balances in the coming years, yet which may trigger periods of price volatility.
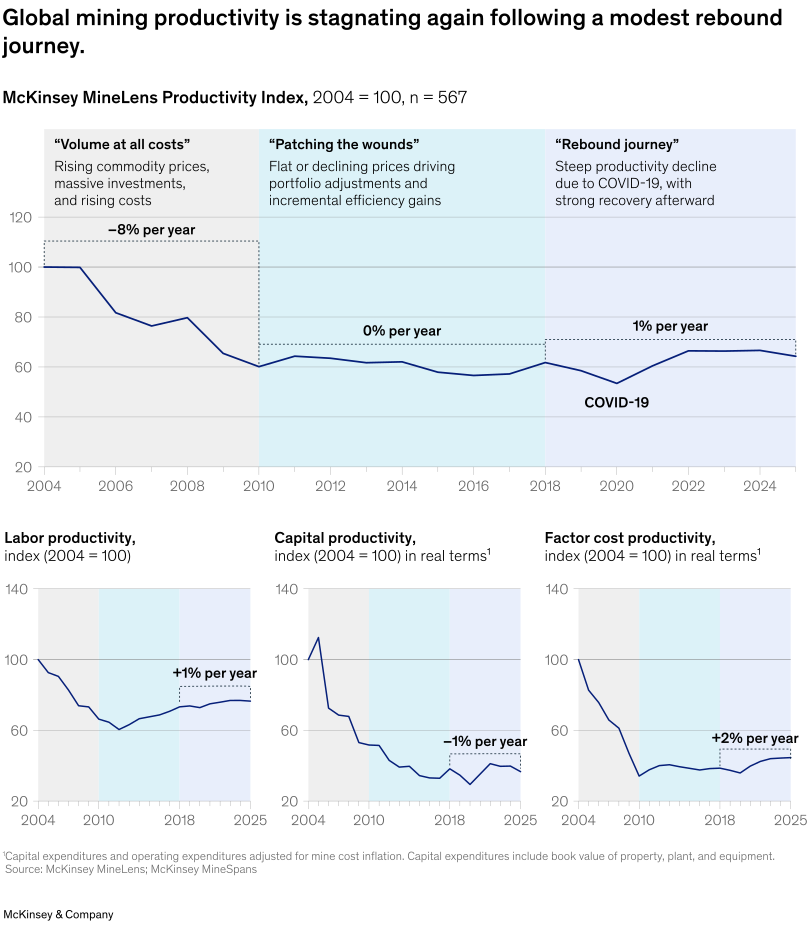
Global mining productivity is stagnating again following a modest rebound journey.
The commodity supercycle of the early 2000s to the early 2010s was marked by heavy investment and rising costs, yet it delivered only limited production growth, and productivity fell sharply as a result.
As commodity prices fell in the first half of the 2010s, mining companies shifted their focus to operational efficiency, primarily targeting labor productivity to offset persistent cost inflation. That put downward pressure on capital productivity in particular.
The industry began a modest recovery around 2017, interrupted temporarily by the COVID-19 pandemic, but now appears to be stagnating again. Labor and factor cost productivity have both edged up, but capital productivity has dragged down the total.
Capital intensity kept rising as deeper pits and declining ore grades, among other factors, increased the capital needed simply to sustain operations. With operational complexity expected to increase further and inflation persisting, capital productivity may likely remain under pressure in the coming years unless the industry reimagines its approach to capital spending.
Total value at stake from productivity improvements is estimated at $450 billion to $750 billion annually across the mining and metals industries.
Next-generation technologies—including automation and robotics, often combined with AI, and the use of AI and advanced analytics to improve processes—along with best-country sourcing are creating new opportunities to raise productivity across the value chain.
A full-potential assessment based on a scan of more than 150 known innovations and proven industry references suggests an annualized value creation opportunity of $450 billion to $750 billion across throughput, operational excellence, and capital excellence, measured against a 2025 baseline. This opportunity is equivalent to 15 to 25 percent of the industry revenue of $3.1 trillion in 2025.
Not all of this potential value would flow through to the industry’s profitability, since widespread adoption could impact supply–demand dynamics and industry cost curves, and therefore prices. Even so, it represents a substantial opportunity to strengthen competitiveness, both within the industry and against potential substitutes.
Metals and mining emissions are projected to decrease by 8 percent by 2035.
Global industry emissions are estimated to have decreased about 1 percent from 2024 to 2025, primarily driven by lower steel production.
Steel remains the largest source of emissions, accounting for about 38 percent of the industry total, followed by thermal coal (30 percent) and aluminum (15 percent).
Assuming long-term supply equals current demand outlooks, emissions from metals and minerals production are projected to fall roughly 8 percent from 7,110 metric tons of carbon dioxide equivalent (CO2e) to 6,580 metric tons of CO2e per year, as production growth adds around 450 metric tons of CO2e at current average emission intensities.
Grid decarbonization and continued efficiency improvements may drive the bulk of the decline, with higher recycled-materials shares and announced net-zero production contribution the remainder.