Executives, strategists, and economic forecasters, somewhat sheepish after missing the “big one”—last year’s global credit crisis—turned to the lexicon of natural disasters, describing the shock as a tsunami hitting markets and as an earthquake shaking the world economy’s foundations. Shopworn as these metaphors may be, they aptly capture the extreme and unexpected nature of the circumstances. In fact, the parallels between the dynamics and failures of man-made systems, such as the economy or the electricity grid, and similarly complex natural ones are bringing new ideas to economic forecasting, strategic planning, and risk management. This trend may have profound implications for policy makers, economists, and corporate strategists alike.
Scientists, sometimes in cooperation with economists, are taking the lead in a young field that applies complexity theory to economic research, rejecting the traditional view of the economy as a fully transparent, rational system striving toward equilibrium. The geophysics professor and earthquake authority Didier Sornette, for example, leads the Financial Crisis Observatory, in Zurich, which uses concepts and mathematical models that draw on complexity theory and statistical physics to understand financial bubbles and economic crises.
Sornette aims to predict extreme outcomes in complex systems. Many other scientists in the field of complexity theory argue that earthquakes, forest fires, power blackouts, and the like are extremely difficult or even impossible to foresee because they are the products of many interdependent “agents” and cascades of events in inherently unstable systems that generate large variations. One symptom of such a system’s behavior is that the frequency and magnitude of outcomes can be described by a mathematical relationship called a “power law,” characterized by a short “head” of frequently occurring small events, dropping off to a long “tail” of increasingly rare but much larger ones.
The power law phenomenon, explored in recent bestselling books and observed by academics for decades, seems to be applicable to a wide range of currently relevant economic outcomes, including financial crises, industrial production, and corporate bankruptcies. It can even describe how industry structures evolve.1
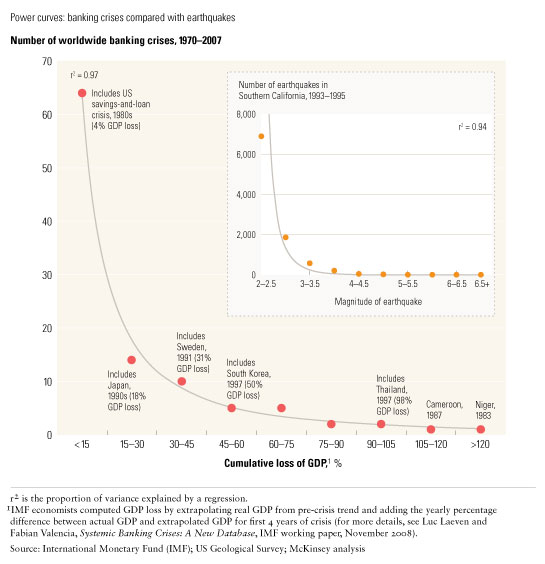
If, for instance, you plot the frequency of banking crises around the world from 1970 to 2007, as well as their magnitude as measured by four-year losses of GDP for each affected country, you get a typical power curve pattern, with a short head of almost 70 crises, each with accumulated losses of less than 15 percent of GDP, quickly falling off to a long tail of very few—but massive—crises (Exhibit 1). While the most extreme cases involve smaller, less developed countries, the same distribution also applies to more developed ones—and with much larger absolute values for GDP loss. Earthquakes, forest fires, and blackouts yield a similar power curve pattern—for instance, from 1993 to 1995, Southern California registered 7,000 tremors at 2.0–2.5 on the Richter scale, falling off to the 1994 Northridge earthquake, at the end of the tail, with a magnitude of 6.7. The curve highlights a key property of the power law: extremely large outcomes are more likely than they are in a normal, bell-shaped distribution, which implies a relatively even spread of values around a mean (in other words, shorter and thinner tails).
The banking-crisis power curve
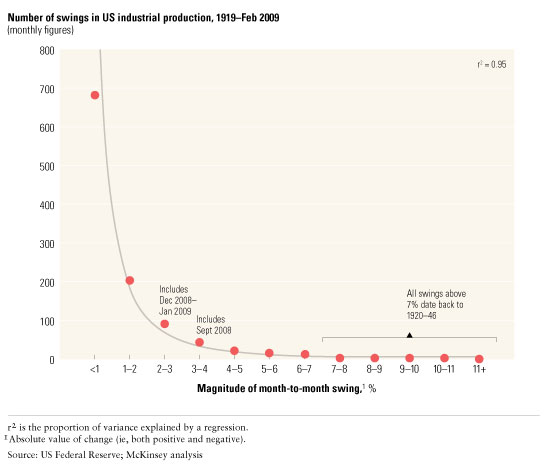
Similarly, the power law pattern can be seen in the frequency and magnitude of the monthly swings, positive and negative, in US industrial production from 1919 to February 2009 (Exhibit 2). Negative swings of up to 4 percent in late 2008 and early 2009 were the largest since the 1940s, though much smaller than some of those from 1920 to 1946, at more than 7 percent (the largest gyrations occurred at the end of World War II).
The industrial-production power curve
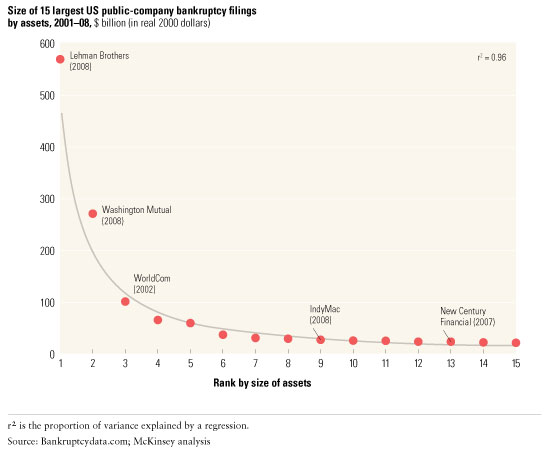
The power law dynamics that affect the overall economy and industries can generate staggering outcomes for individual companies. Plotting the size of the biggest US bankruptcies from 2001 to 2008 by assets shows that the largest, Lehman Brothers, was twice the size of the second largest, Washington Mutual, which in turn was three times the size of the third largest, WorldCom (Exhibit 3).
The corporate-bankruptcy power curve
These examples indicate that power law patterns, with their small, frequent outcomes mixed with rare, hard-to-predict extreme ones, exist in many aspects of the economy. This suggests that the economy, like other complex systems characterized by power law behavior, is inherently unstable and prone to occasional huge failures. Intriguing stuff, but how can corporate strategists, economists, and policy makers use it? This is still a young field of research, and the study of power law patterns may be part of the answer, but it isn’t too early to consider and discuss potential implications.
Make the system the unit of analysis. You can’t assess the behavior and performance of a specific agent—for example, a financial-services company—without gauging the behavior and performance of the system in which it is embedded. Proponents of a systemic financial regulator that would span multiple subsectors and geographies are making a similar argument.
Don’t assume stability and do take a long look back. Major systemic imbalances and corrections are highly likely, and everyone should be wary of new economic paradigms to the contrary. It’s equally important to take a truly historical perspective and consider a system’s underlying patterns. If you look at the sharp rise in US corporate profits from 1997 to 2007 in isolation, it might seem like steady, sustainable development that can be justified by pointing to near-term trends, such as globalization and productivity growth. Yet it becomes a striking departure from the historical norm when you look back and find that profits last hit such a lofty percentage of GDP more than 50 years ago and dropped shortly thereafter. Outliers such as these should not be ignored but rather studied closely for clues that might help us understand current and future events.2
Focus on early warning. The inherent uncertainty of complex systems makes point predictions unreliable. Much as earthquake scientists are developing tsunami early-warning systems, corporate strategists should monitor potential indications that economic stress might be building in their industries. One indicator could be changes in the exit and entry rates in a particular industry. It’s notable, for instance, that specialized US mortgage companies experienced difficulties in late 2006 and that several went bankrupt long before the problems spread to financial institutions with a strong mortgage exposure and then to broader financial institutions and other major companies.
Build flexible business models. Corporate leaders might consider robust business models incorporating some slack and flexibility instead of the models most common today, which aim to optimize value in the most likely future scenario and thus leave companies exposed when conditions change dramatically. The offshoring of production or services to a number of continents and countries, for example, is surely more costly, under stable conditions, than maintaining a single center but would protect a company in the event of an unexpected regional or national economic crisis.
Learn from scientists studying other complex systems. Strategists, economists, and others should consider several other potential parallels. To take one example, what economic-policy lessons could be drawn from the observation that efforts to put out small forest fires quickly may in time lead to large-scale fires, because the rapid mitigation of small ones allows burnable undergrowth to accumulate?
Related Articles