Growth might be the lifeblood of a business, but it isn't always the best or most sustainable way to create value for shareholders. Return on invested capital (ROIC) is often just as important—and occasionally even more so—as a measure of value creation and can be easier to sustain at a high level.
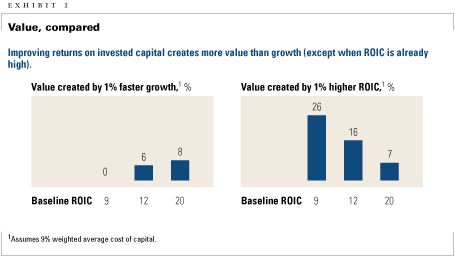
When a company's ROIC is already high, growth typically generates additional value. But if a company's ROIC is low, executives can create more value by boosting ROIC than by pursuing growth (Exhibit 1). A close look at companies with high price-to-earnings multiples shows that many have extraordinary returns on capital but limited growth. This scrutiny suggests that, contrary to conventional wisdom, investors recognize (and will pay more for) the anticipated returns of companies with a strong ROIC, despite their limited growth prospects. This observation doesn't mean that growth is undesirable; unless companies keep up with their industries, they will likely destroy value. But they shouldn't pursue growth heroically at the expense of improvements in ROIC.
After identifying the largest publicly listed companies in the United States (by revenues) in 1965, 1975, 1985, and 1995, we examined their long-term patterns of growth and ROIC.1 The median ROIC for the 1965 group remained stable, at about 9 percent, over the next 40 years. We observed the same pattern for the groups from 1975, 1985, and 1995. In other words, ROIC tends to remain stable over time (Exhibit 2).
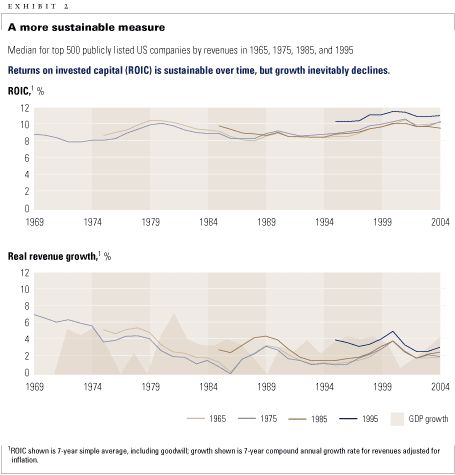
Growth, by contrast, is fleeting. The median inflation-adjusted growth in revenues for the top 500 companies in 1965 started out at 7 percent and steadily declined to 2 percent over the next 10 years, hitting a cyclical low of 0 percent by year 17. For the next 20 years, growth hovered at around 2 percent—a figure below the level of US GDP growth.2 We observed a similar general pattern of decay in median real growth for the top 500 companies in 1975, 1985, and 1995.
Moreover, pattern analysis at the industry3 level further shows the importance of managing ROIC. A comparison of ROIC4 for the top 500 companies of 1965 shows that it remained steady in most sectors and even increased in some—particularly those with strong brands or patent-protected products (household and personal goods, for example) and pharmaceuticals and biotechnology (Exhibit 3, part 1). Growth, by contrast, almost always declined, except in pharmaceuticals (Exhibit 3, part 2).


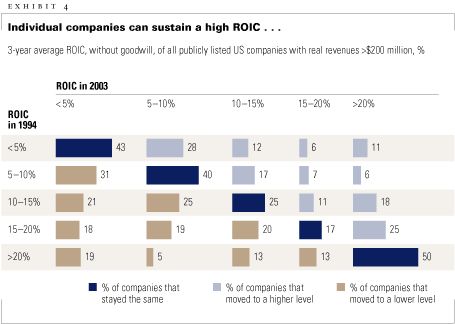
A close look at individual companies finds similar patterns; companies with high levels of ROIC tend to hold on to that advantage, whereas high-growth companies rarely do. Exhibit 4 looks at the probability that a company will migrate from one level of ROIC to another over the course of a decade. A company that generated an ROIC of less than 5 percent in 1994, for instance, had a 43 percent chance of earning less than 5 percent in 2003. As the exhibit shows, low and high performers alike demonstrate consistency throughout the 40-year period. Companies with an ROIC of 5 to 10 percent had a 40 percent probability of remaining in the same group ten years later; companies with an ROIC of more than 20 percent had a 50 percent probability.
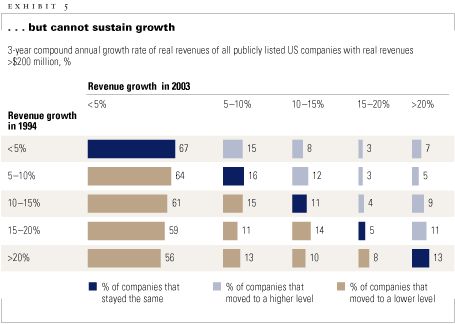
But when it comes to growth, companies are very likely to experience substantial declines (Exhibit 5). Of companies that grew by more than 20 percent in 1994, for example, 56 percent were growing at real rates of less than 5 percent ten years later. Only 13 percent of the high-growth companies maintained 20 percent real growth ten years on, and acquisitions probably drove most of it.
Related Articles