

The world’s energy systems are undergoing rapid transitions triggered by simultaneous shifts in technological development, regulations, consumer preferences, and investor sentiment. It’s likely that these transitions will accelerate exponentially in the coming decades, underpinned by the most recent wave of announcements by public- and private-sector leaders around COP26.
As demand and supply for different energy carriers across regions undergo fundamental changes, the economics of energy systems will change as well. The short-term effects of such demand-supply imbalances we see in the current price spikes on many commodities. In light of this changing landscape, business leaders and investors along the energy value chain face important strategic questions:
- What is the future (global) value pool for energy and how will it evolve?
- How will that affect my specific industry within energy (and adjacent ones)?
- In which countries and industry segments should I explore investment opportunities?
- When is the best time for me to react? What possible portfolio moves should I consider?
Our ongoing research assesses the economic implications of changing technological, economic and regulatory forces that drive the energy transition.
How the energy transition could unfold: Four scenarios
In our research, we explore four scenarios for how the energy transition could unfold:
- The Reference Case is a forward-leaning “continuation of existing trends” outlook. This scenario reflects expectations of how current technologies will evolve and incorporates current policies and an extrapolation of key policy trends. It does not include anticipated policies that will likely bring further acceleration.
- The Accelerated Transition scenario shows the impact ten conceivable shifts such as faster renewables cost decline or EV uptake could have on the overall energy system.
- The McKinsey 1.5°C Pathway offers a view on the shifts required to limit emissions to a level linked to preventing global warming beyond 1.5°C.
- The Delayed Transition case mirrors the Accelerated Transition case and assumes that at a global scale, stakeholder acceptance proves lacking or COVID-19 recovery measures fail to go hand-in-hand with green policies to stimulate the energy transition.
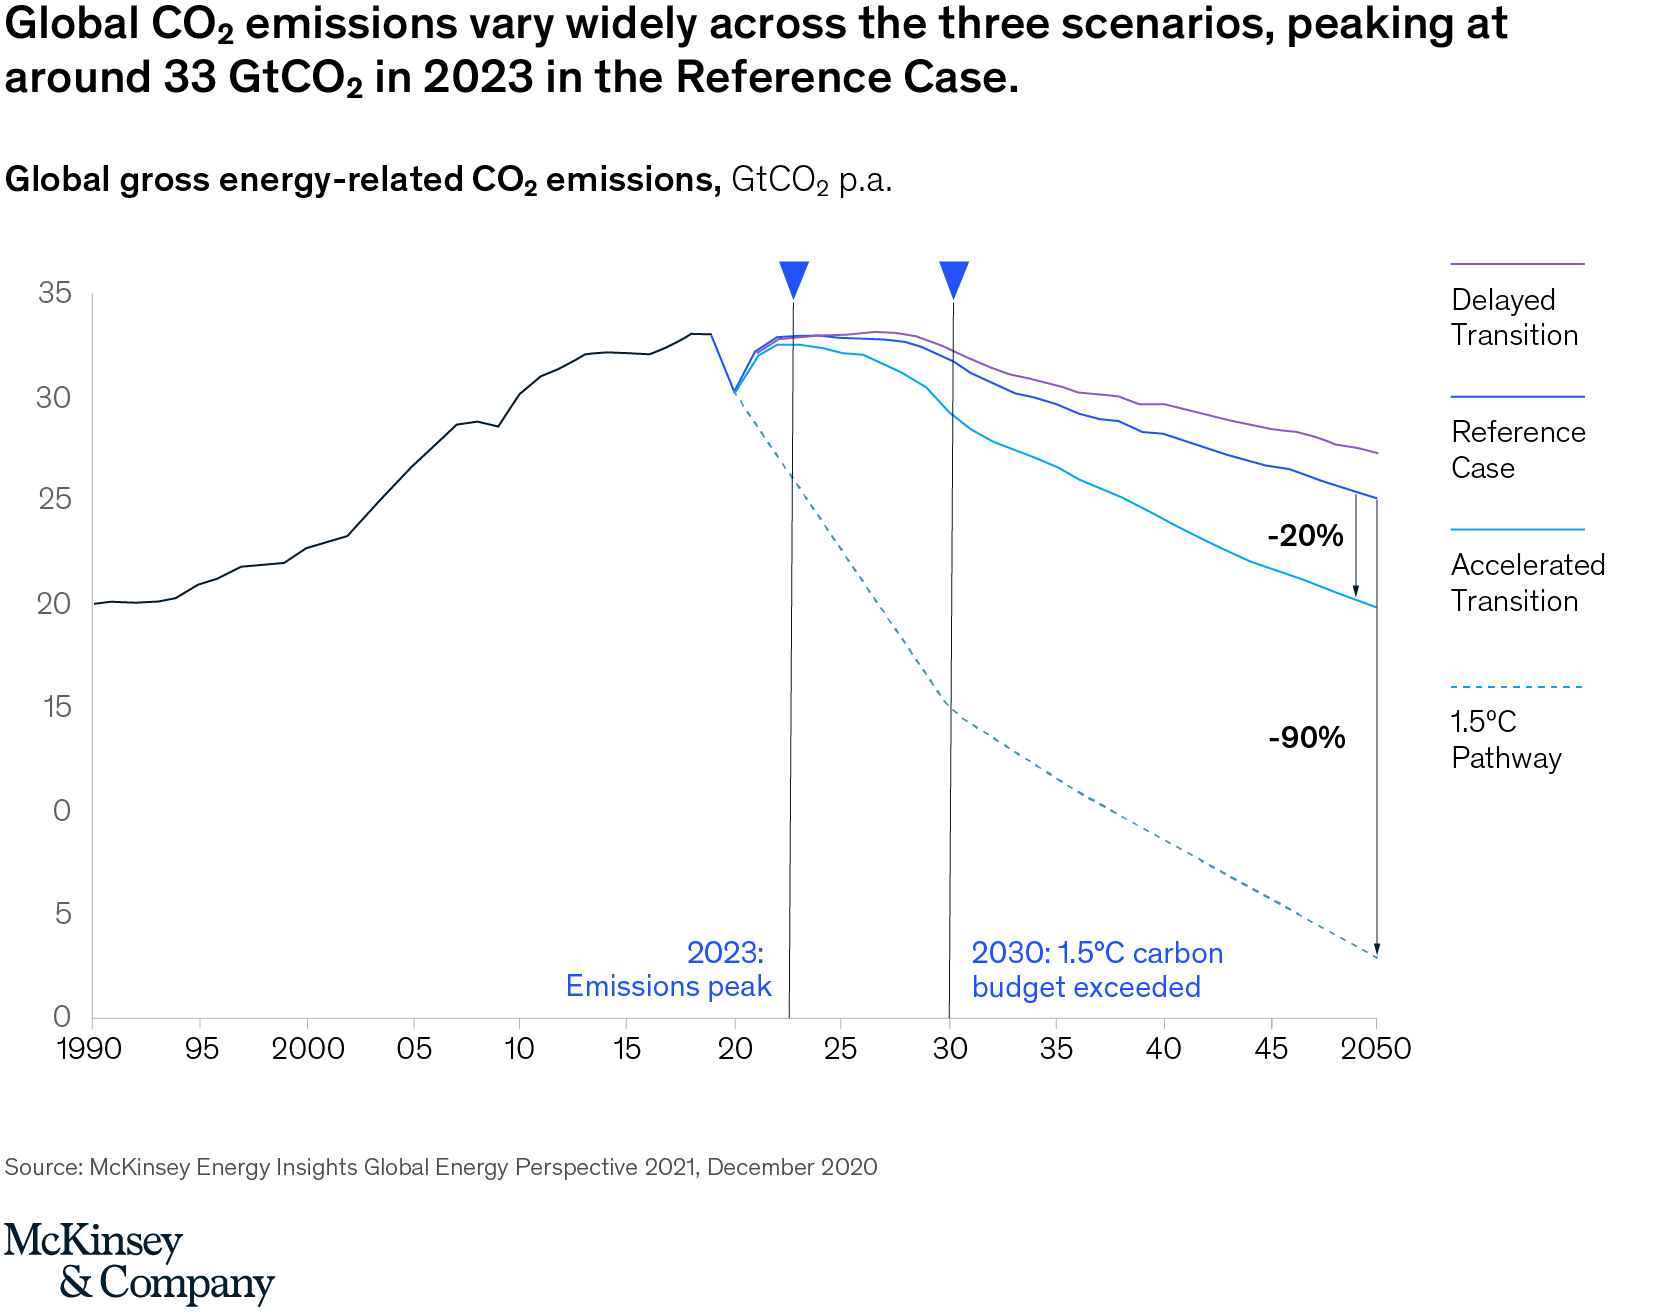
The CO2 emissions associated with each of these scenarios would differ widely. In a Reference Case scenario, global CO2 emissions peak at around 33 GtCO2 in 2023, exhausting the global carbon budget for a 1.5°C Pathway by 2030. The Accelerated Transition case shows emissions only 20 percent below Reference Case, despite rapid acceleration of the energy transition across multiple sectors, whereas a 90 percent emissions reduction is required to comply with a 1.5°C Pathway.
Our analysis in this blog focuses on the first three of these scenarios, exploring their impact on global energy value pools.
Insights on global energy value pools
Focusing on the owner/operator’s perspective, our analysis aims to provide a perspective on the energy transition’s implications on global energy value pools as well as on investments and EBIT as key economic metrics (based on our Global Energy Perspective 2021). We focus on sub-industry level.
Investments
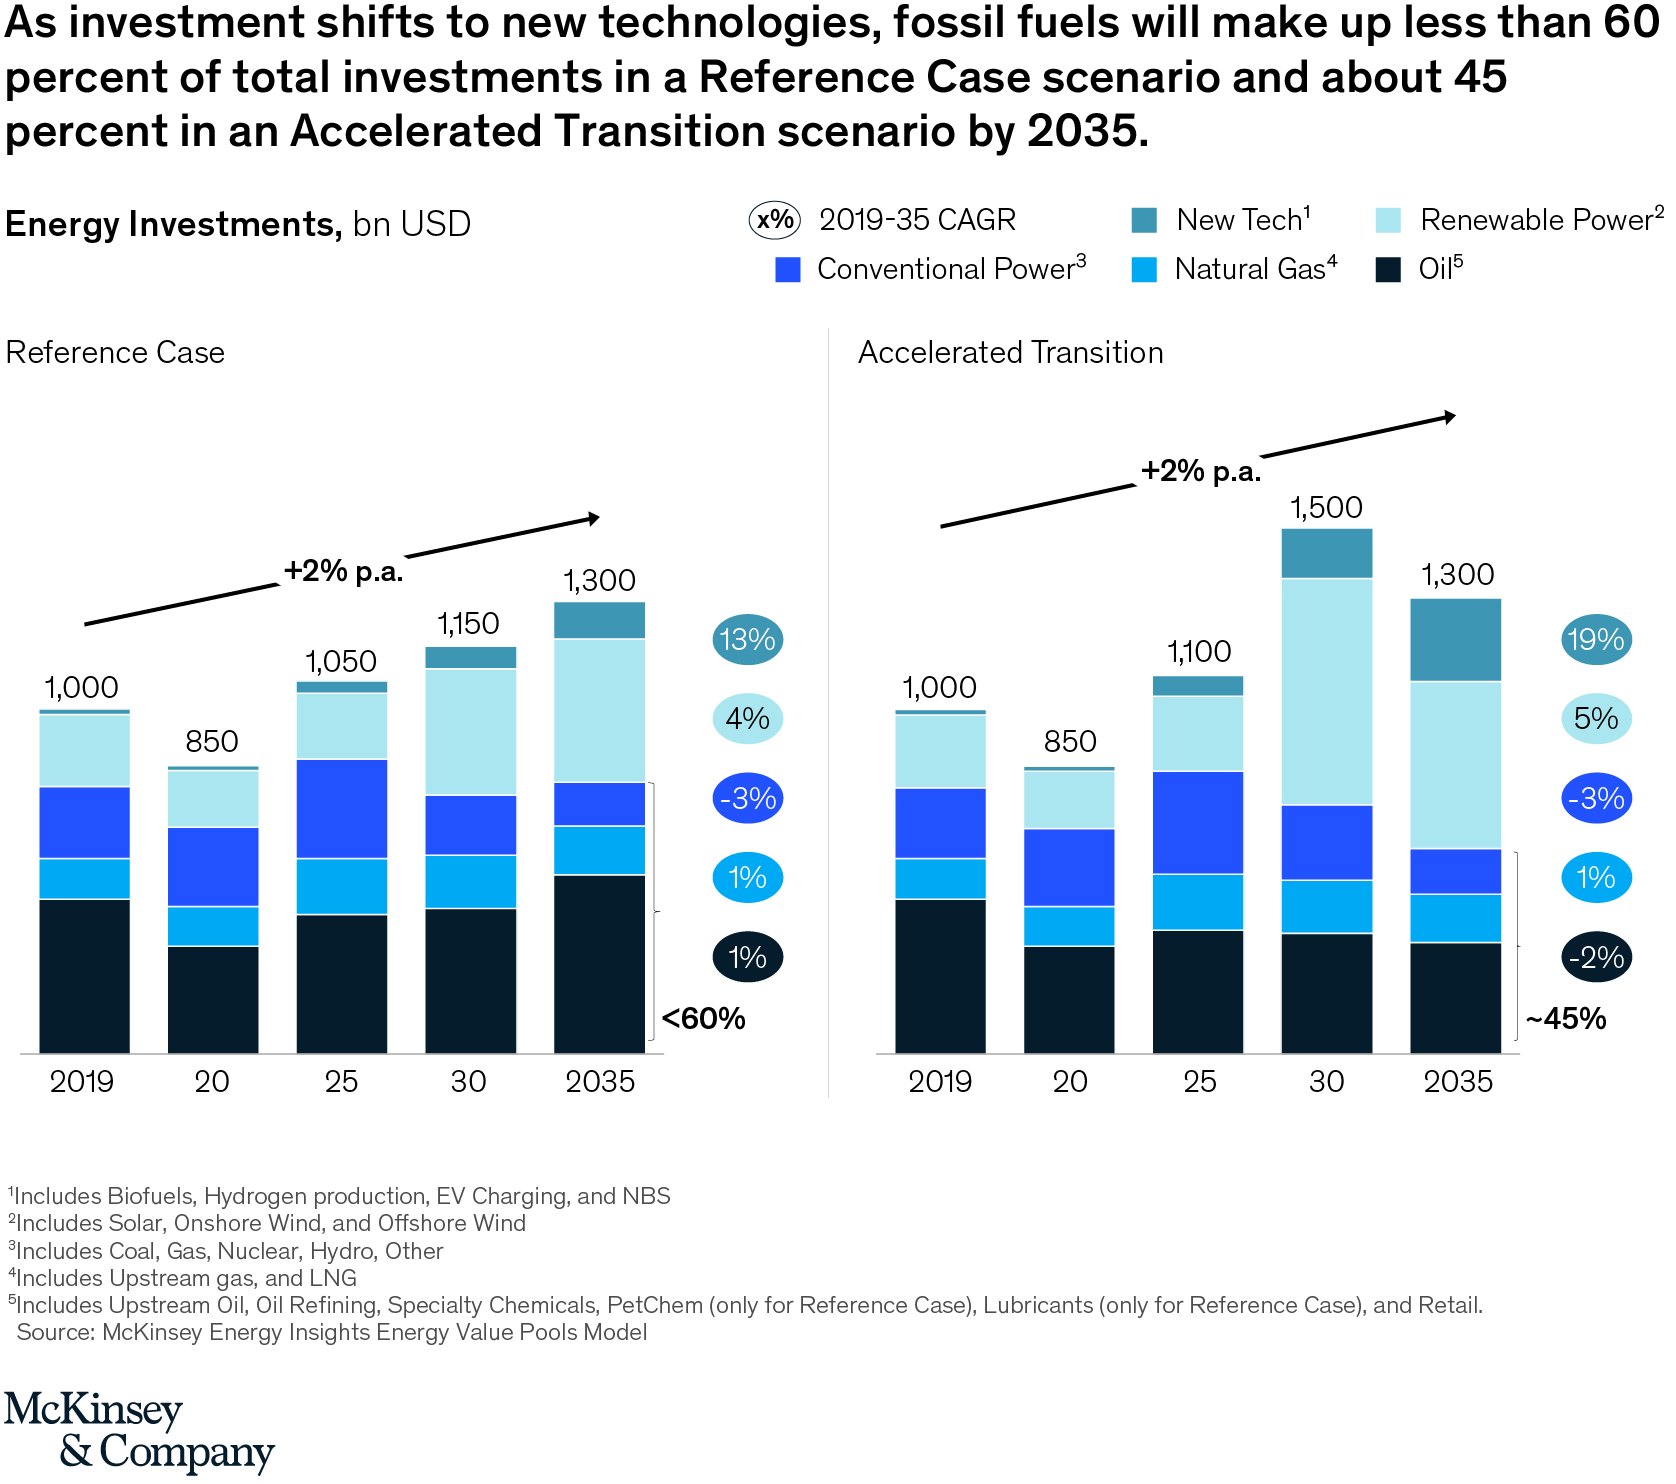
In the Reference Case scenario, global final energy demand would continue to grow, albeit at lower pace (<1 percent CAGR 2019-2035), while in the Accelerated Transition case, we would expect to see a slight decline (<-1 percent CAGR 2019-2035).
However, in both scenarios, we would see significant and increasing investments in energy supply to meet this expected future demand.1 Investment would increase ~2 percent p.a. versus 2019 and even more versus the 2020 low point, with most growth coming from new technologies (e.g., hydrogen, biofuels, EV charging and NBS, and CCUS) and the renewable power sector.
As investment shifts to these new technologies, we would expect the share of fossil fuels to decline from the 75 percent share of energy investment today. Interestingly, we still expect significant investment needs into oil & gas in many scenarios leading to with ~60 percent of 2035 total investments in a Reference Case scenario and ~45 percent in an Accelerated Transition scenario. This is driven by the time it takes to replace a global car park of more than a billion vehicles and other consumption technologies as well as continued growth of energy demand in many sectors. Together, that results in an only gradual decline in demand for fossil fuels over this time horizon and, with more expensive marginal projects for supply, to somewhat stable overall investments. In power generation we would see a drop in investment into fossil-fired plants as new-built renewables in most places significantly outcompete fossil alternatives.
EBIT
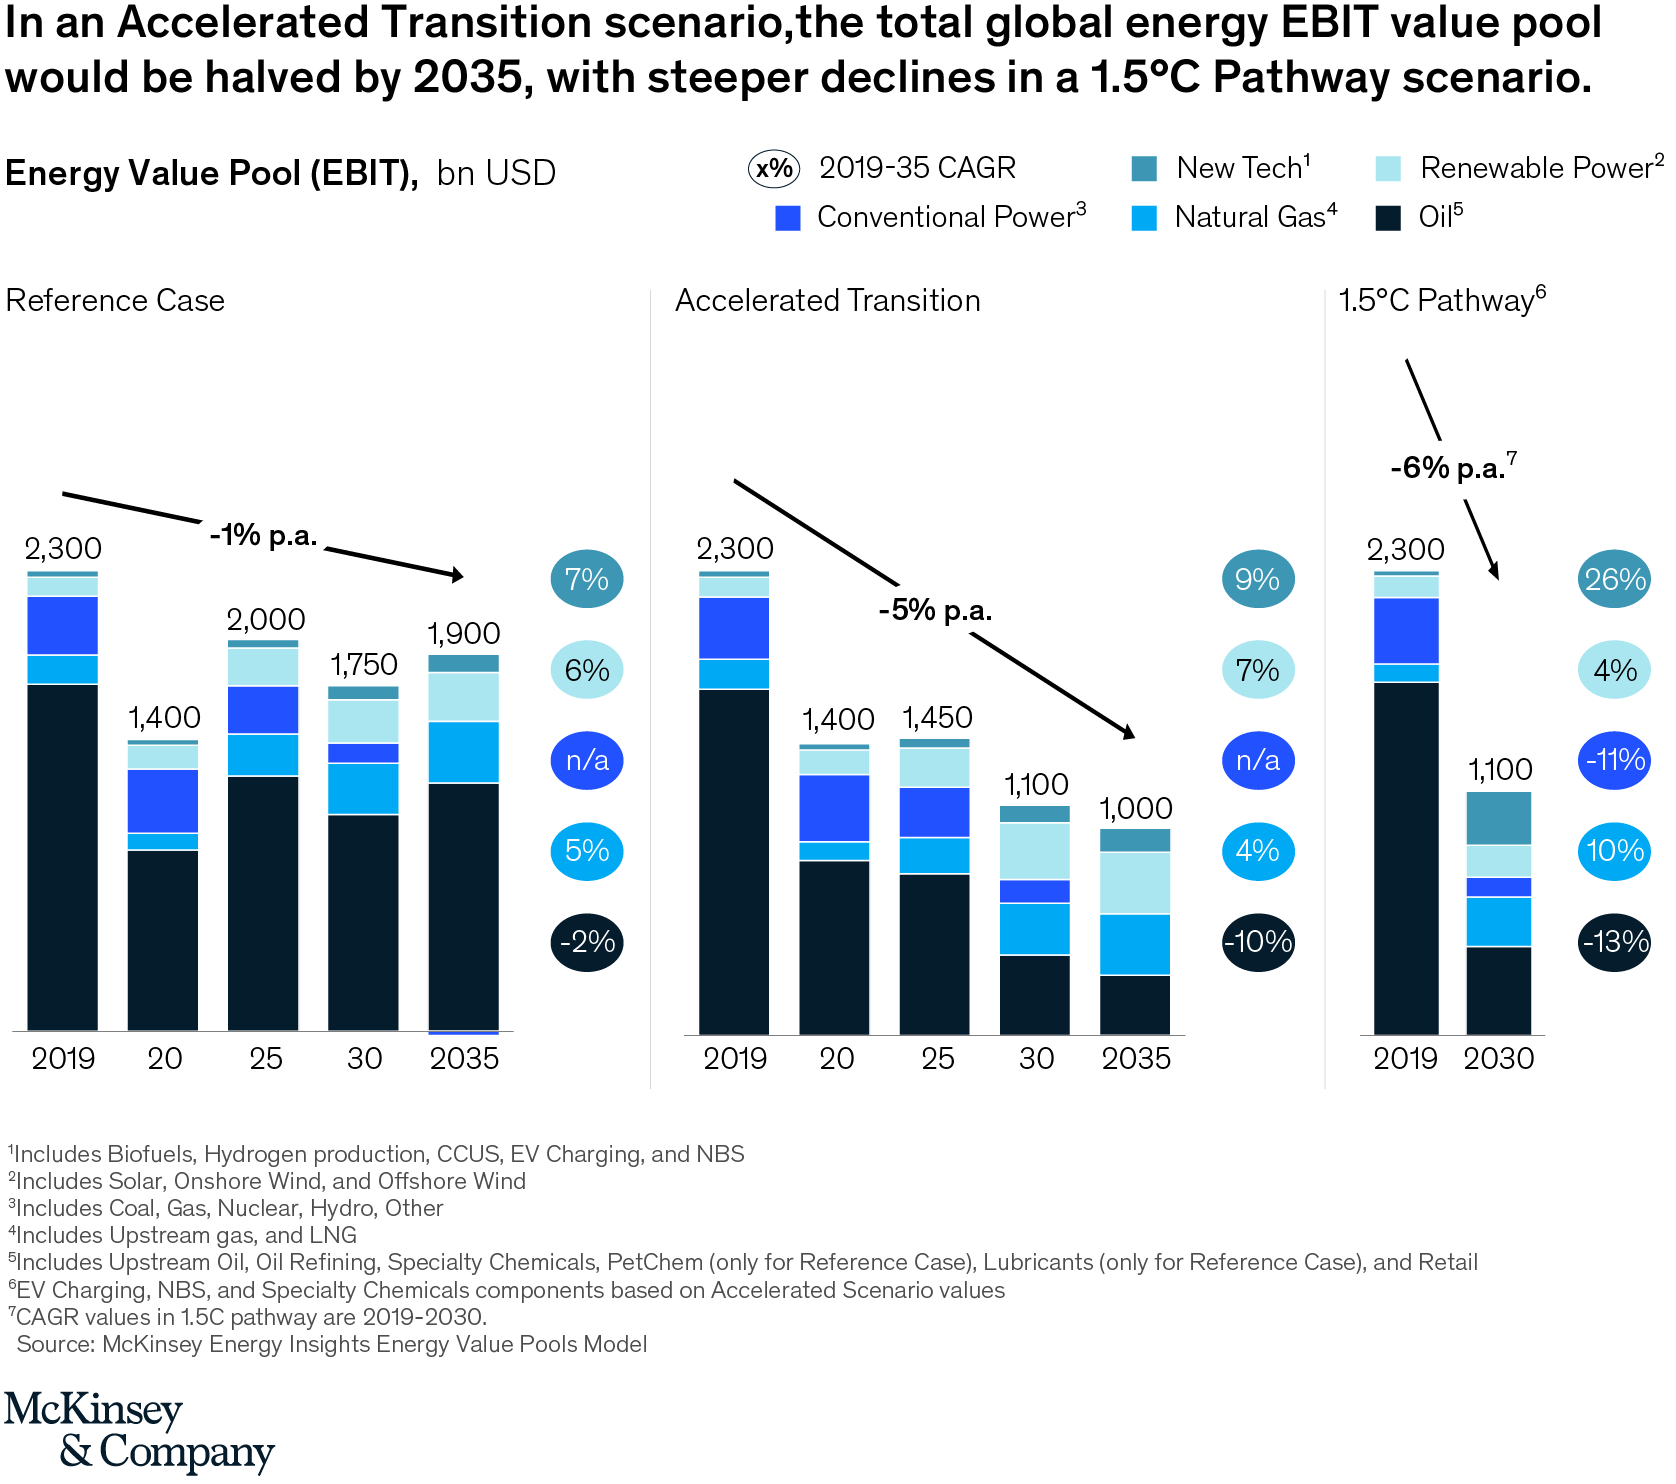
In a Reference Case scenario, global EBIT across the energy system would recover from the 2020 low point to around USD 2 trillion p.a. and stay around that level well into the 2030s. Despite this recovery, it would not reach 2019 levels.
This trend will be driven by competition for both the remaining growth in fossil fuels as well as the constant stream of ever-cheaper renewables—both of which weigh on market prices and reduce returns.
In an Accelerated Transition scenario, these effects are amplified—for example, with oil demand peaking in 2024 versus 2029. This creates both a volume and a price impact as cheaper marginal supply leads to lower overall energy prices and increased competition leads to additional cost compression—and likely lower prices.
As a result, such a scenario would roughly halve the total global energy EBIT value pool by 2035. The total share of the energy value pool represented by oil would drop from 50 percent to ~25 percent, a significant decline. While renewables would experience growth during this period, they would not create enough additional EBIT to offset the decline in fossil fuels, partly due to a rise in renewables-to-renewables competition.
In a scenario that complies with a 1.5°C Pathway, overall EBIT would decline by a further 14 percent from the Accelerated Transition scenario. This is driven by a combination of increased competition (as a lot of renewables will be coming online in a short amount of time) and a faster cost decline, as technological progress accelerated through the larger cumulative scale of the renewable build-outs. This would lead to increased challenges in finding the funding for such economically challenging investments. Many people refer to this as the “missing money problem,” something that would need to be addressed by a market mechanism or other subsidization.
The biggest factor offsetting this decline is the growth in new technologies, particularly driven by skyrocketing global demand for low-carbon hydrogen and CCUS—especially in heavier industries.
One surprising insight from our analysis is that the oil EBIT value pool is slightly higher in 2030 in a 1.5°C Pathway scenario than in an Accelerated Transition scenario (while clearly lower than in a Reference Case scenario). This is driven by a more significant rationalization in upstream oil and oil refining—leading to a situation where the remaining fields and units are the most economical and where there is less depreciation due to a decline in new investments. Of course, such development would depend on the actual speed of rationalization.
Oil upstream EBIT
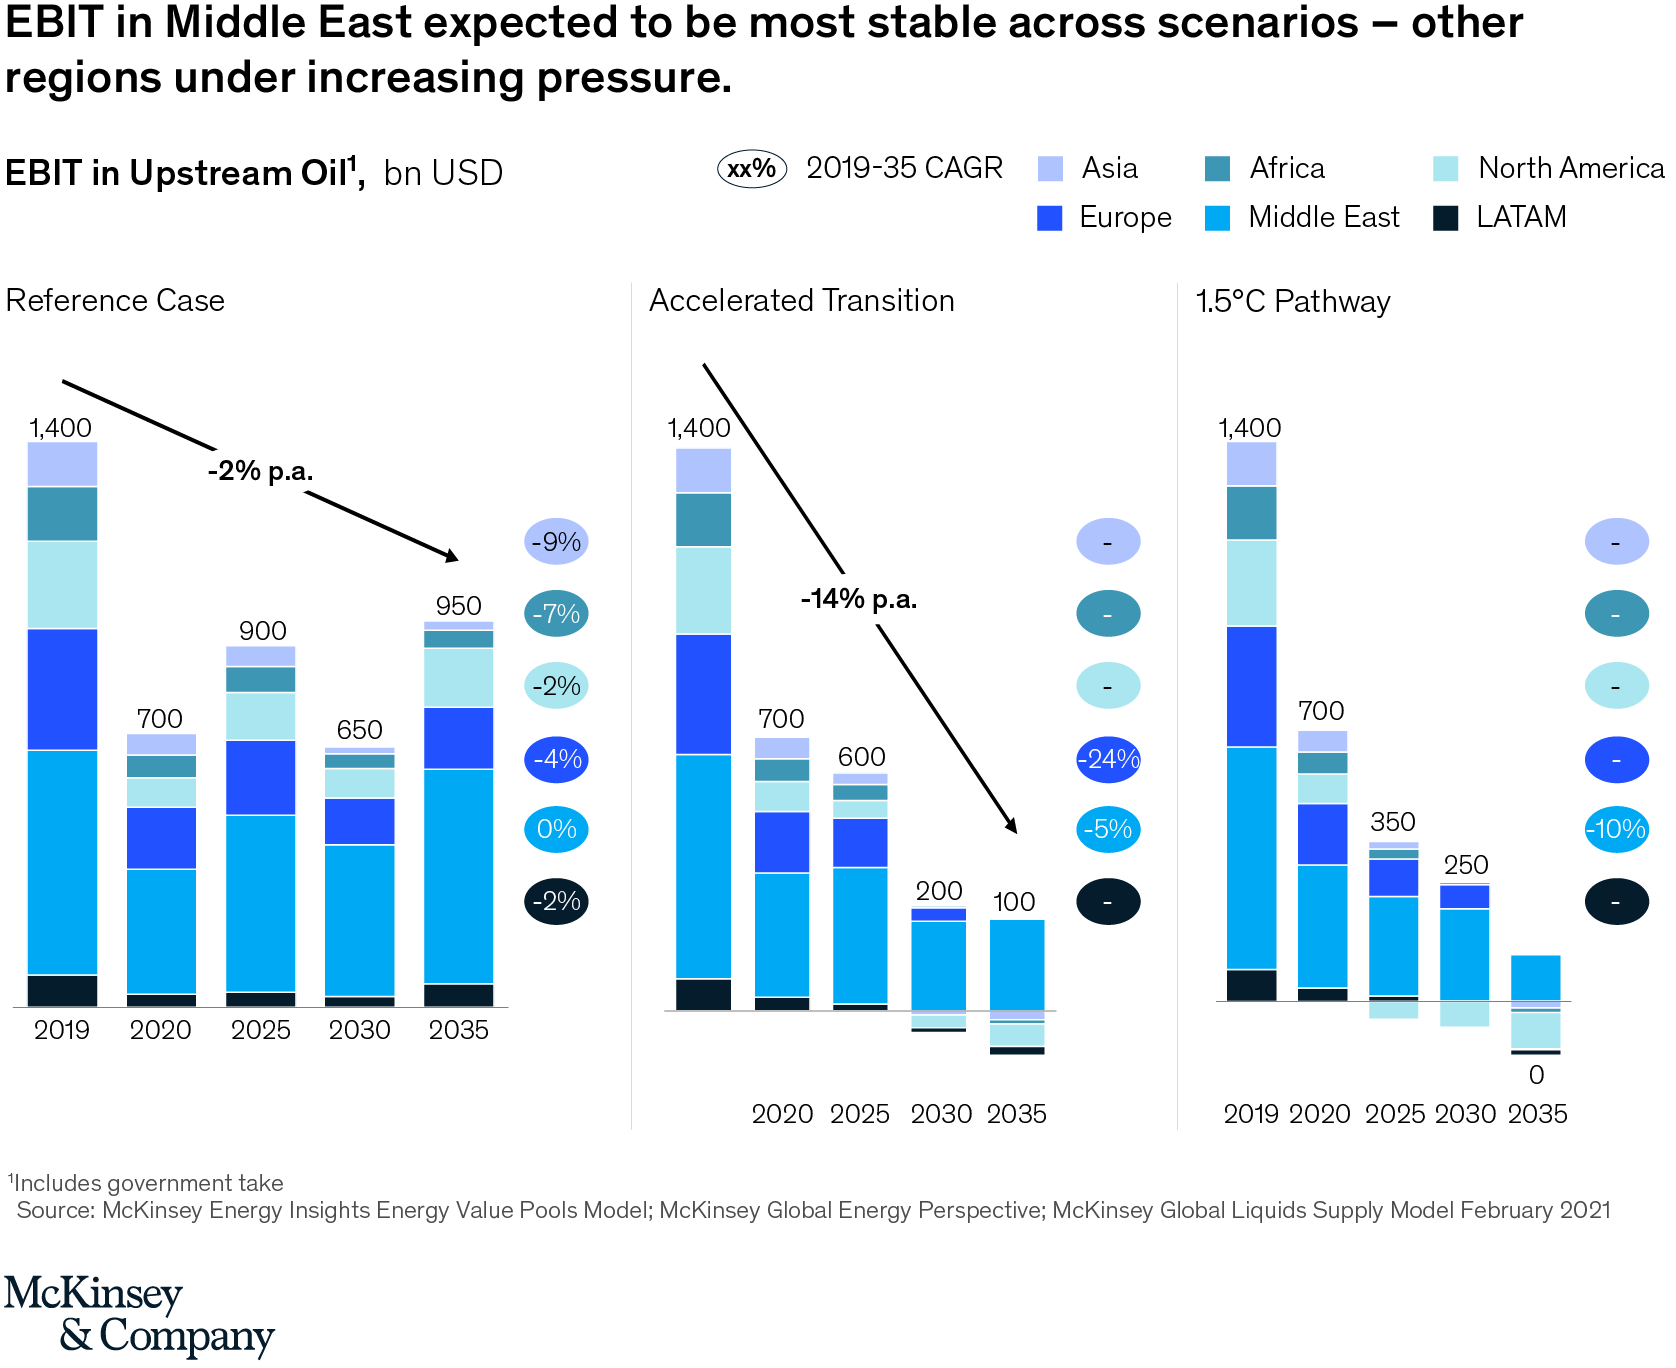
Oil demand is exposed to the strongest variations across the scenarios due to the relatively simple substitution in several key segments—for example, with road transport. In a Reference Case scenario, global EBIT in upstream oil is expected to stabilize between the 2019 and 2020 levels as demand peaks towards the end of the decade. At this stage, average prices would be in the range of $/bbl 50-60 given the required marginal supply costs.
In the longer-term, demand slowdown will be the main factor driving prices down—particularly given the increasingly large cuts that would be required from OPEC+ to balance the market. Despite this trend, significant new oil supply of ~35-40 MMBD would still be required by 2040.
In an Accelerated Transition case, liquids demand would diverge from the Reference Case path in the late 2020s, peaking in 2024, with key differences in the road transport and aviation sectors. Paired with a much lower price level expectation (around $40/bbl versus $50-60/bbl), this results in a much steeper decline of EBIT value pools (-14 percent p.a. versus -2 percent p.a. in Reference Case). By 2035, the EBIT value pool would be 75 percent lower than in the Reference Case.
The lowest cost producers would of course be the most resilient against increasing competition and price pressure. For these producers, the biggest share of the price is going into their profits and thus any dollar of price change represents a smaller percentage of their overall value pool. Accordingly, the Middle East value pool stays most stable and reaches 50 percent+ of global share.
Indeed, as of 2030, all regions but the Middle East and to a limited extent Europe, will experience significant pressure on their EBIT with industry averages possibly turning negative – creating an increasing need for players to improve performance, outcompete this average and get the returns of the top decile players. In a low-price environment such as in the Accelerated Transition scenario only lowest-cost production would retain profitability and players with access to privileged resources can deliver attractive returns into the 2030s (assuming the right tax climate).
The change in liquids demand in a 1.5ºC Pathway would be even more dramatic. Oil demand would never return to 2019 levels, and 2035 demand would be ~50 percent lower than in the Reference Case. This would result in an EBIT value pool which constitutes less than 15 percent of that in an Accelerated Transition scenario, and less than 2 percent of that in a Reference Case scenario.
What’s next?
As these three scenarios indicate, there are several paths that the energy transition could take. Business leaders will need to navigate uncertainties across technology, regulation, macroeconomy, and consumer behavior, preparing to respond rapidly in an evolving landscape. Identifying and tracking key signposts that indicate the direction and speed of change, can help inform the key decisions.
While the outlined energy value pools depict the industry as a whole, it is critical to keep in mind that economics vary widely between different regions, players, and assets. In every segment, there will be both highly profitable and also highly negative assets—as well as a significant gap between the top decile and other players. Moreover, while price fluctuations will move around the long-term equilibrium our findings are based on, price fluctuations along commodity cycles can lead to profitable periods even in declining markets. The current price spikes are a good example and indicate also what under-investment into certain supply sources can cause.
It will be important for companies to look to find the most attractive niches for their specific skill set and portfolio and an understanding of future value pools in adjacent sectors can help identify these.
Thanks to: Emily Billing, Cristina Blajin, Gillian Boccara, Giovanni Bruni, Arjun Chopra, Julian Conzade, Luciano Di Fiori, Jesus Rodriguez Gonzalez, Shashank Kalurkar, Elif Kustal, Morgan Lee, Mateusz Luszczynski, Michiel Nivard, Jesse Noffsinger, Benoit Petre, Jay Sheth, Bram Smeets, Piotr Szabat, Linda Tiemersma, Pawel Wilczynski, Raffael Winter, and Nicola Zanardi.1 This analysis focuses on energy investments including 25 sub-sectors and includes in particular oil & gas upstream, oil refining & retail, LNG liquefaction & regasification, different types of power generation (renewables, gas, coal etc.) as well as some of the new technologies like EV charging, sustainable fuels (biofuels/PtL), CCUS or hydrogen supply. Investments in electricity T&D or materials sourcing not reflected.