


Brent prices averaged USD68/bbl in August, down by USD0.4/bbl. This marks the third month in which oil prices have fallen, as a result of downward pressure from rising supply, geopolitical and trade uncertainty, and softening demand, particularly in China:
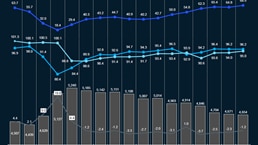
- Global oil demand. Global liquids demand remained relatively steady at 104.6 MMb/d in August. The largest decline in demand was associated with China (-0.5 MMb/d), which was offset by gains in the US (+0.4 MMb/d)
- OPEC 9 production (excl. Iran, Venezuela, Libya). OPEC 9’s production increased by 0.1 MMb/d to 28.1 MMb/d. During August, Saudi Arabia’s output remained steady m-o-m with the largest monthly increase associated with Nigeria, as the country has been increasing its output throughout 2025 to support its domestic energy security, with supply up by 0.2 MMb/d since the start of the year
- Non-OPEC production (excl. US shale). Non-OPEC production saw a significant increase of 0.6 MMb/d, reaching an all-time high of 64.1 MMb/d. This increase was mainly driven by Guyana (+0.3 MMb/d), Canada (+0.1 MMb/d), and Kazakhstan (+0.1 MMb/d)
- US shale oil production. US shale production increased to 9.1 MMb/d in August. The number of active rigs has been in decline since March 2025, totalling 521 in August (down 37 rigs y-o-y)
- Iran, Venezuela, Libya production. The combined production of Iran, Venezuela, and Libya has declined by 0.2 MMb/d to 5.4 MMb/d. Most of the decline was associated with Iran (-0.2 MMb/d) and Libya (-0.1 MMb/d), whereas Venezuelan supply remained steady
- Commercial inventories.1 Global commercial inventories rose slightly in August, gaining around 16 million barrels to remain broadly steady at ~4.6 billion barrels. The increase was driven by OECD stocks, while non-OECD inventories edged lower. At this level, stocks stood nearly 300 million barrels below the 2020 average of ~4.9 billion barrels
- Market sentiment. Oil market sentiment in August and September 2025 was driven by OPEC+ continuing to increase production, US tariffs doubling on Indian imports of Russian crude, the EU and UK lowering the Russian oil price cap, and mixed global inventory data. Sanctions and tariff uncertainty, plus an overall market oversupply and a weaker demand, are resulting in a bearish market sentiment, as reflected by weaker Brent prices over the last few months
1 Non-OECD share of inventories is estimated, assuming that non-OECD inventories have 50% days of demand cover of OECD inventories
Download dashboard:
Oil supply & demand dashboard: August 2025
Subscribe to Energy Solutions
To receive our oil supply & demand dashboards, please subscribe to upstream oil and gas updates from Energy Solutions.