

Snapshot of LNG market dynamics
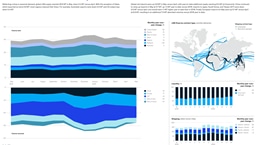
LNG supply from Q1 to Q3 2021 was up 15.8 MT or 6 percent versus Q1 to Q3 2020. The large increase in supply comes predominantly from the US (+21.6 MT or 66%) and Australia (+1.9 MT or 3%) and is offset by declines in Nigeria (-3.2 MT).
On a quarter-by-quarter basis, total supply in Q3 is down 3.7 MT compared to Q2 due to maintenance in Russia and supply outages.
The fierce competition for cargoes between Europe and Asia has led to an increase in Atlantic to Pacific basin flows (+186 BTMi or 52%).
In terms of LNG demand, China continues to dominate the growth in imports with a 22 percent increase between Q1 and Q3 compared to the same period in 2020 (+10.5 MT). JKT imports were also up 9 percent (+9.1 MT) from Q1 to Q3 2021.
Imports from the rest of Asia are marginally up by 2 percent (+0.7 MT) from Q1 to Q3 2021 as high gas prices have led to some delays or cancellations of cargoes. European LNG imports are down 19 percent (-12.5 MT) in the same period this year as flows were redirected towards Asia.
- Total LNG demand (last 12 months): 372.5 mtpa
- LNG shipping intensity (last 12 months 2,068 BTMi
Snapshot of European natural gas flows
From Q1 to Q3 2021, production levels declined by 2 bcm (-6%) compared to the same period last year and were offset by increases in pipeline entries (+23 bcm, 14%).
Imports from Algeria rose by 119 percent or 14 bcm over Q1-Q3 2021, while Russian piped imports were up 8.5 bcm (+ 9%), and imports from Norway dropped 3 bcm (-5%).
LNG withdrawals were down 11bcm (18%). Storage contributed an additional 12 bcm of supply through a combination of higher storage withdrawals (+10 bcm over Q1-Q3 2021) and lower storage injections (-2 bcm over the same period). Storage levels are now 17 bcm below the 2018-2020 average and stand at 74% full.
Demand across Europe was up 27 bcm or 11 percent from Q1 to Q3 2021 with over one third of the increase coming from Germany (+10 bcm, +23%) and 17 percent of the increase from North West Europe (+5 bcm or 17%).
- Total EU gas demand (last 12 months): 391.2 bcm
- Total EU pipeline imports (last 12 months): 262.8 bcm
- Gas storage utilization (and volume): 74% (73.4 bcm)
Energy Insights tracks the exports, imports, and flows of global gas and LNG in real time. Download our latest market updates below.
Download dashboards:
Subscribe to Energy Insights
To receive our LNGFlow dashboards, please subscribe to gas and LNG updates from Energy Insights