2019 was a turning point for LNG markets. With 28 MTPA of new LNG capacity starting up over the course of the year, the large increase in LNG flows significantly impacted global gas markets and depressed prices.
McKinsey has developed two advanced analytics solutions to help monitor the gas markets in real time. First, LNGFlow tracks global liquefied natural gas fleet utilization and daily movements as well as monitors trade flows and supply–demand. And second, EUPipeFlow tracks daily natural gas flows in the EU pipeline system, providing analyses of supply, demand, and storage levels and enabling users to compare utilization of key infrastructure points.
Through an analysis of the data gathered by these solutions, we have identified and ranked 14 key insights from the past year that help explain the implications for 2020 and beyond.
Global LNG volumes
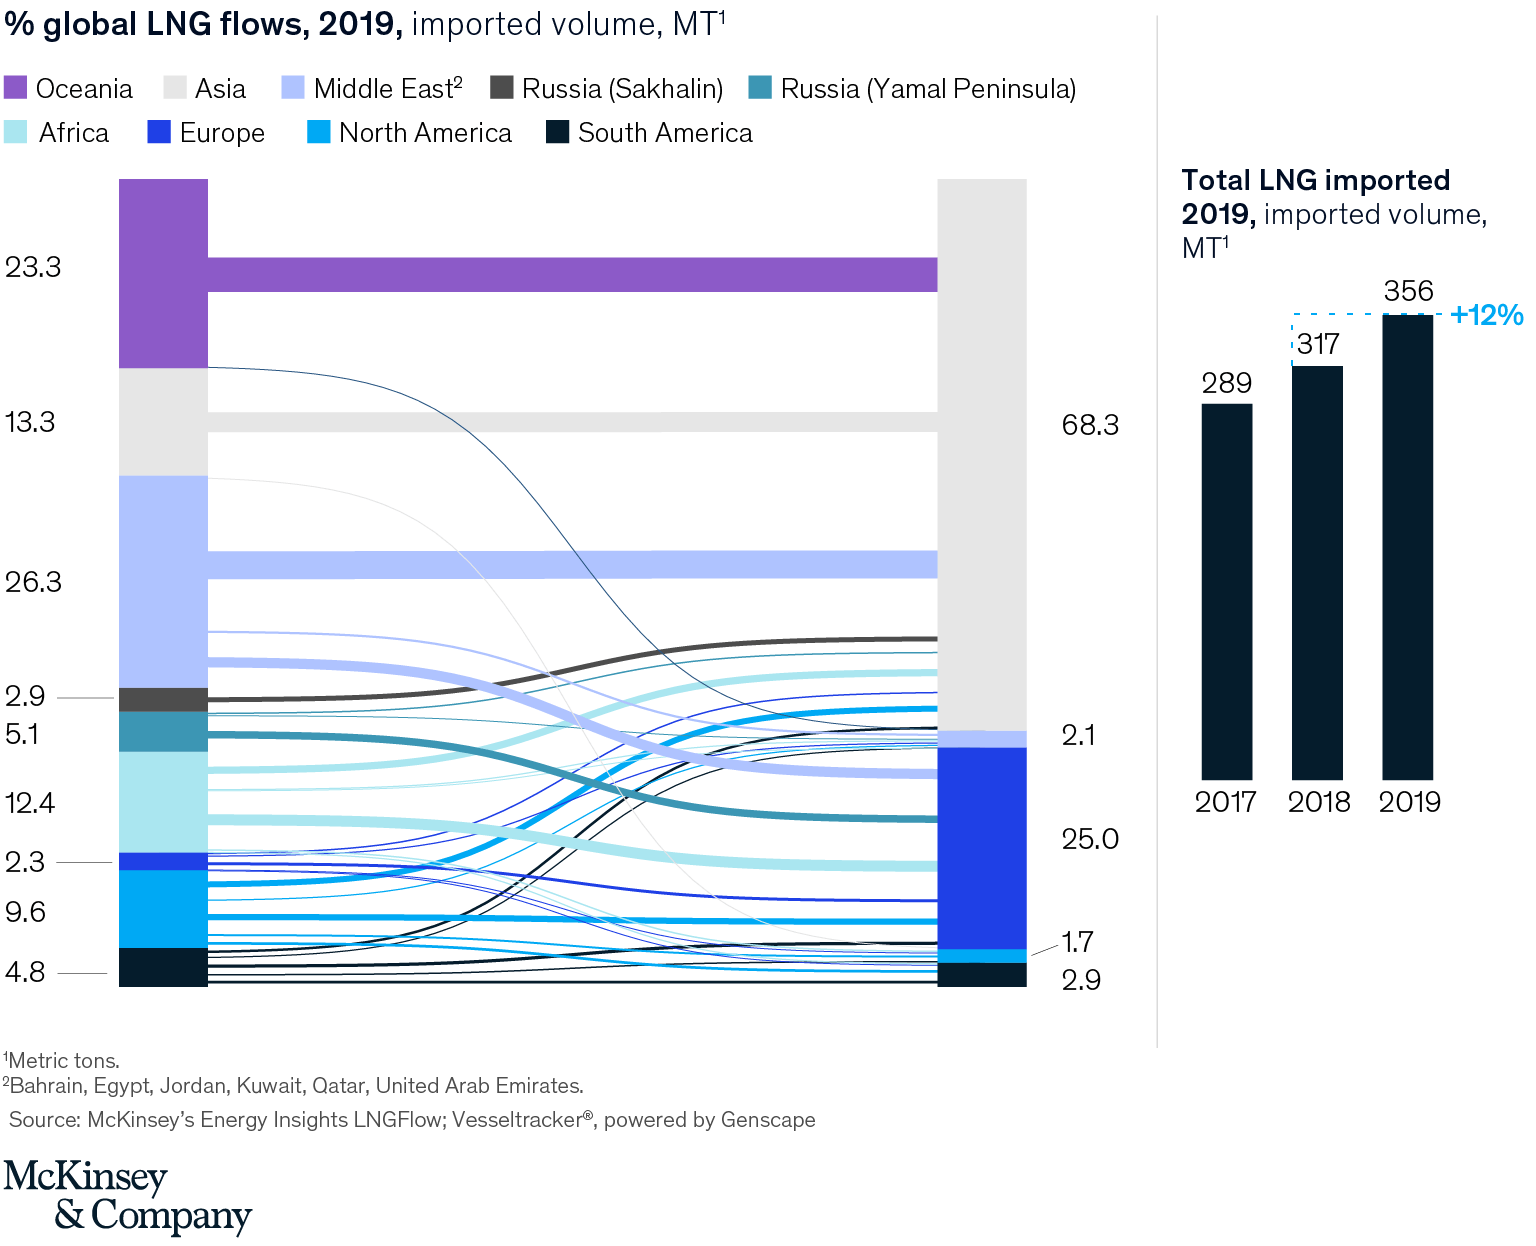
Net volumes of LNG imports grew by 12.0 percent over 2018–19 (356 MT versus 317 MT in 2018), an acceleration in growth of 10.0 percent in 2018 and 9.5 percent in 2017. 2019 also saw limited intrabasin trading—with supply balancing demand to a large extent in each basin. In the Pacific basin, for example, the recent ramp-up in Australian production going to Asian customers has constrained Atlantic basin LNG flows.
Global LNG supply
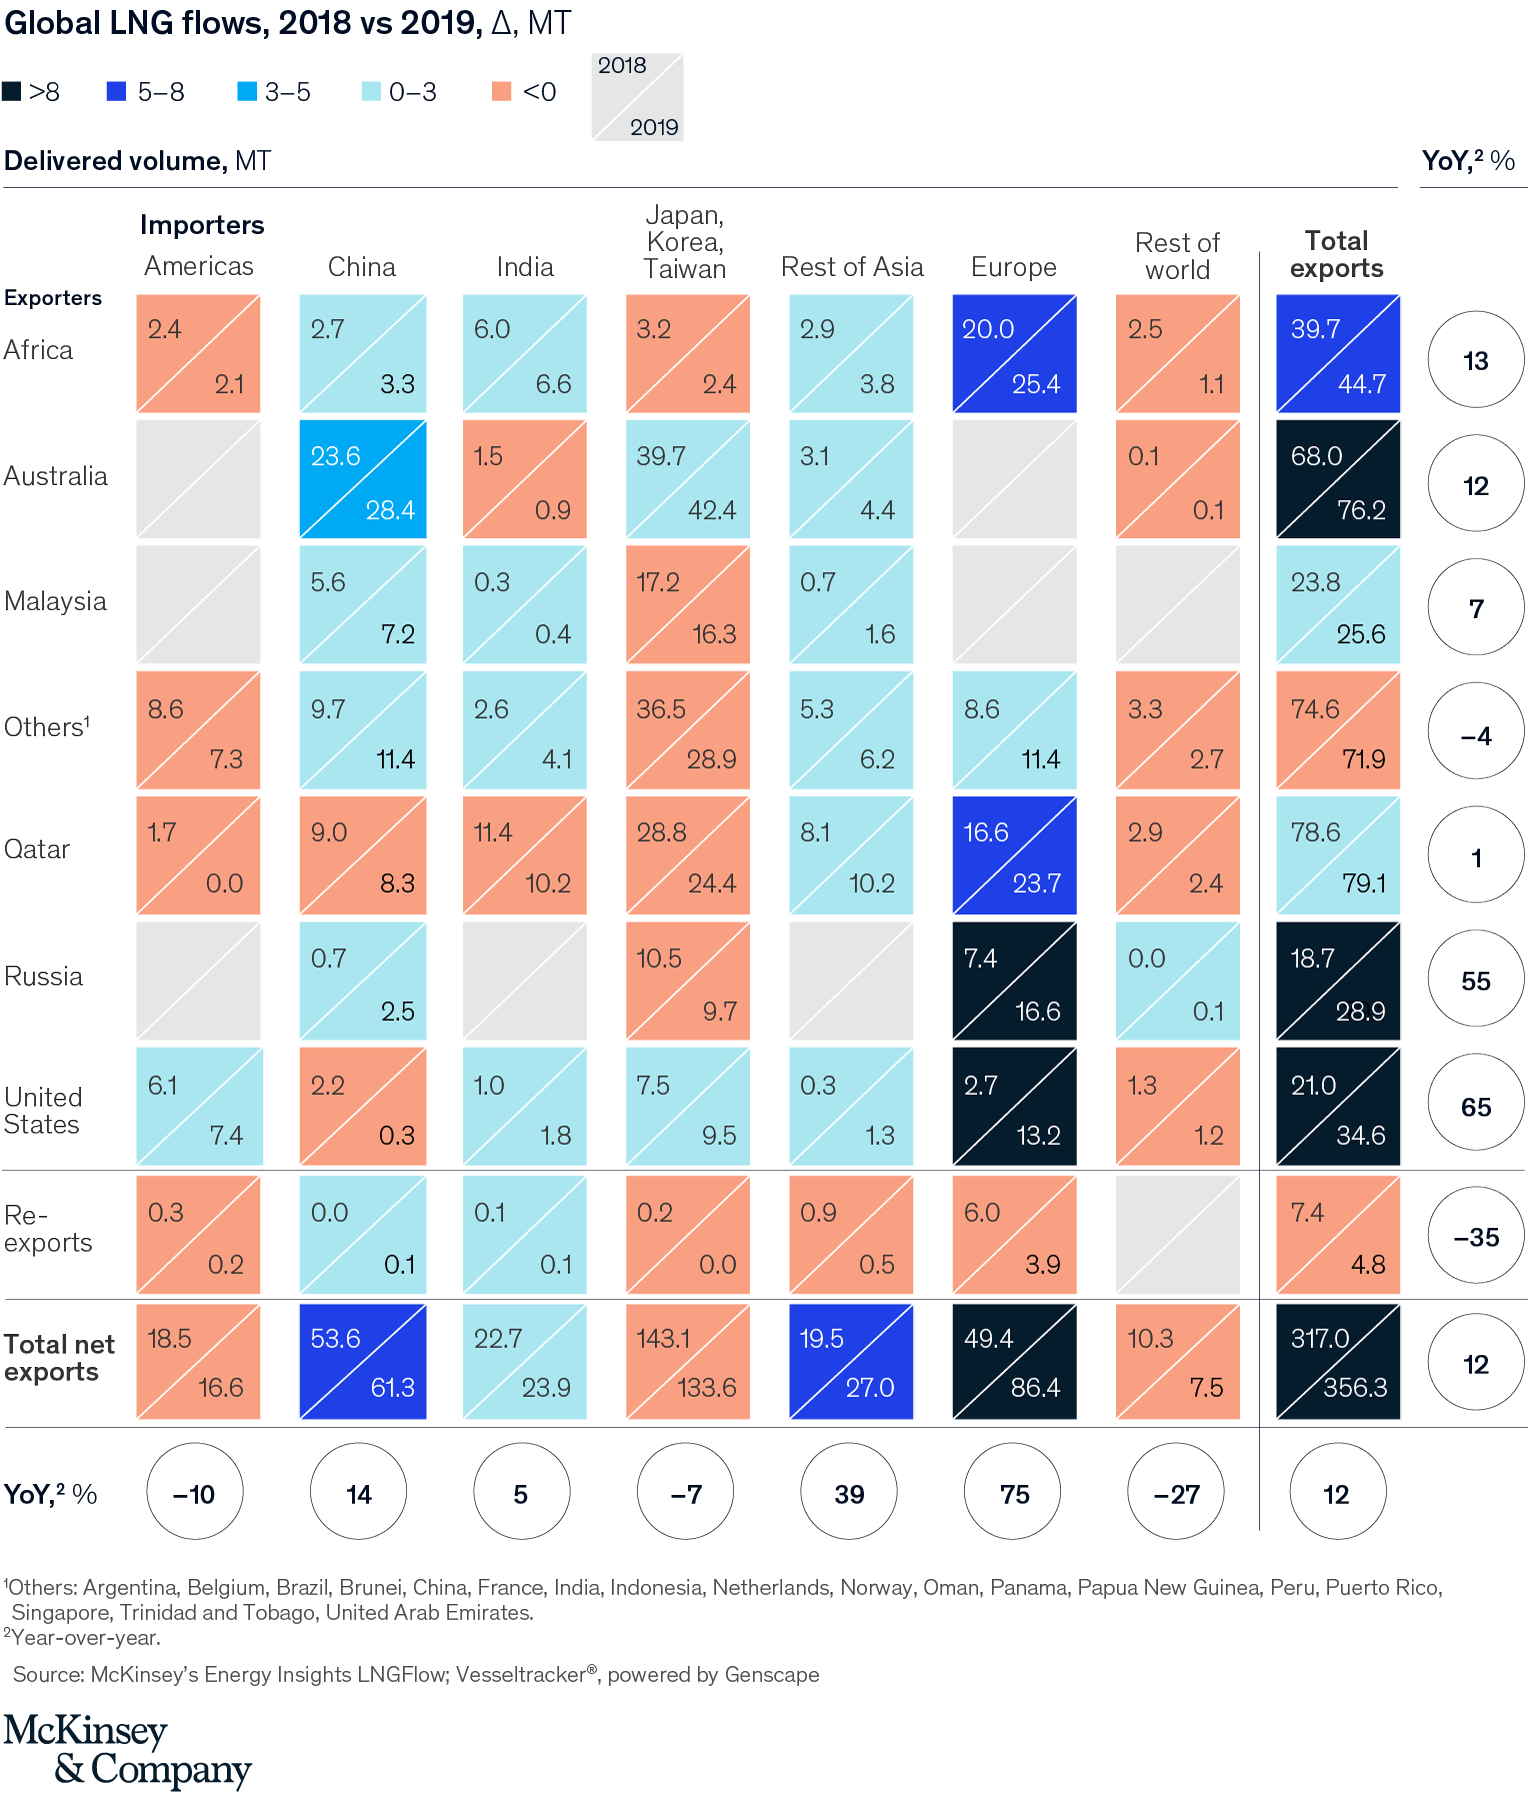
The 39 MT of 2019 supply growth came from both the start-up and ramp-up of new LNG trains driven by the United States (+14 MT), Russia (+ten MT), and Australia (+eight MT). With more projects coming online in 2020, LNG flows from the United States are expected to continue growing and to gain further ground on Qatar and Australia.
US supplyThe expansion of US exports (14 MT) went primarily to Europe (ten MT), with smaller volumes to JKT (two MT) and the Americas (one MT). Six MT of the growth originated from the ramp-up of the Corpus Christi project with Train 2 becoming operational in August 2019, four MT additional volumes from Sabine pass where T5 was commissioned in 2019, two MT of full year production at Cove Point and one MT each from the start-up of Freeport and Cameron LNG.
Russia supplyRussian LNG volumes grew significantly as Yamal’s three trains operated at full capacity for all of 2019. An additional ten MT of exports were sent mainly to Europe (+nine MT) and to China (+2MT).
Australia supplyFinally, Australian LNG exports increased by 12 percent (+eight MT) driven by a full year of production from Ichthys (+seven MT) and one MT from Prelude FLNG, which sent its first cargo in June 2019.
Global LNG demand
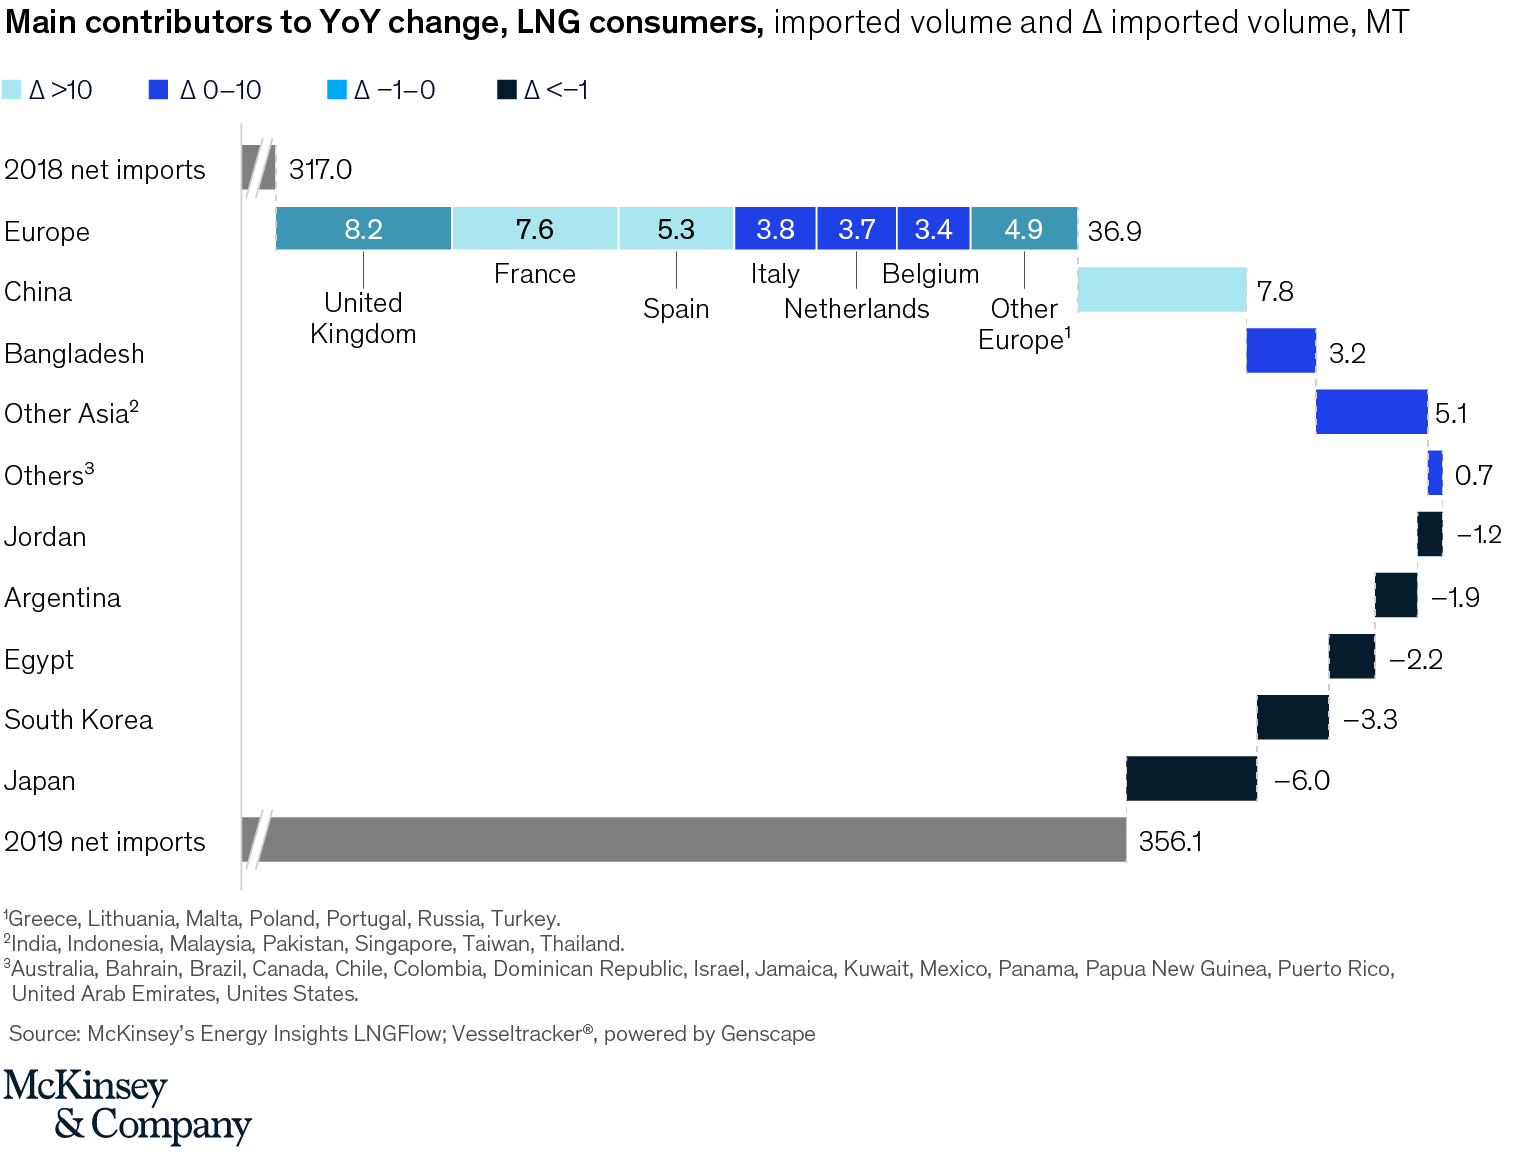
Asia remains the largest importer of LNG volumes with 246 MT (68 percent of global imports). While year-on-year LNG net imports to Asia increased by 3 percent over 2018–19, the pace of growth has slowed down considerably compared to 2018 (+14 percent). In contrast, volumes of LNG net imports to Europe grew by an impressive 75 percent year-on-year (+37 MT).
China demand. China still makes up 17 percent of global imports (equal to 2018). However, the growth in LNG net imports slowed down to 14 percent year-on-year in 2019 (+7.8 MT) versus 41 percent in 2018 (+15.4 MT). Overall gas demand in China is also growing more slowly, 8 percent in 2019 versus 17 percent the previous year, leaving LNG imports to compete with increasing domestic production. The start-up of the Power of Siberia pipeline in December 2019, which brings Russian gas to China, is likely to contribute to further changes to the supply mix.
South Asia demand. LNG net imports to South Asia have continued to increase—albeit at a slower rate than in 2018 (year-on-year delta 5.6 MT in 2019 versus 6.3 MT in 2018). Bangladesh was the main contributor, absorbing an extra +3.2 MT (480 percent growth) with the addition of a second FSRU on Moheshkhali Island in April 2019. In addition, Pakistan and India each imported an extra +1.2 MT.
JKT demand JKT imported a sizeable portion of global LNG at 134 MT (37 percent of global imports), but year-on-year demand contracted over 2018–19 by 9.6 MT. Japanese LNG net imports have decreased 7 percent year-on-year (–6.0 MT), driven by the restart of Japan’s nuclear program and overall low incremental energy needs. South Korea net imports also contracted by 8 percent in 2019 (–3.3 MT) mainly driven by the start-up of long-planned nuclear and coal power plants as well as high LNG storage levels upon entering 2019.
Europe demandIn contrast with Asia, Europe witnessed a 64 percent increase in gross LNG imports (89 MT in 2019 versus 54 MT in 2018). Incremental volumes were supplied mainly by the United States (ten MT), followed by Russia (nine MT) and Qatar (seven MT). This brings up Europe’s share in overall imports to 24 percent in 2019 versus 16 percent in 2018.
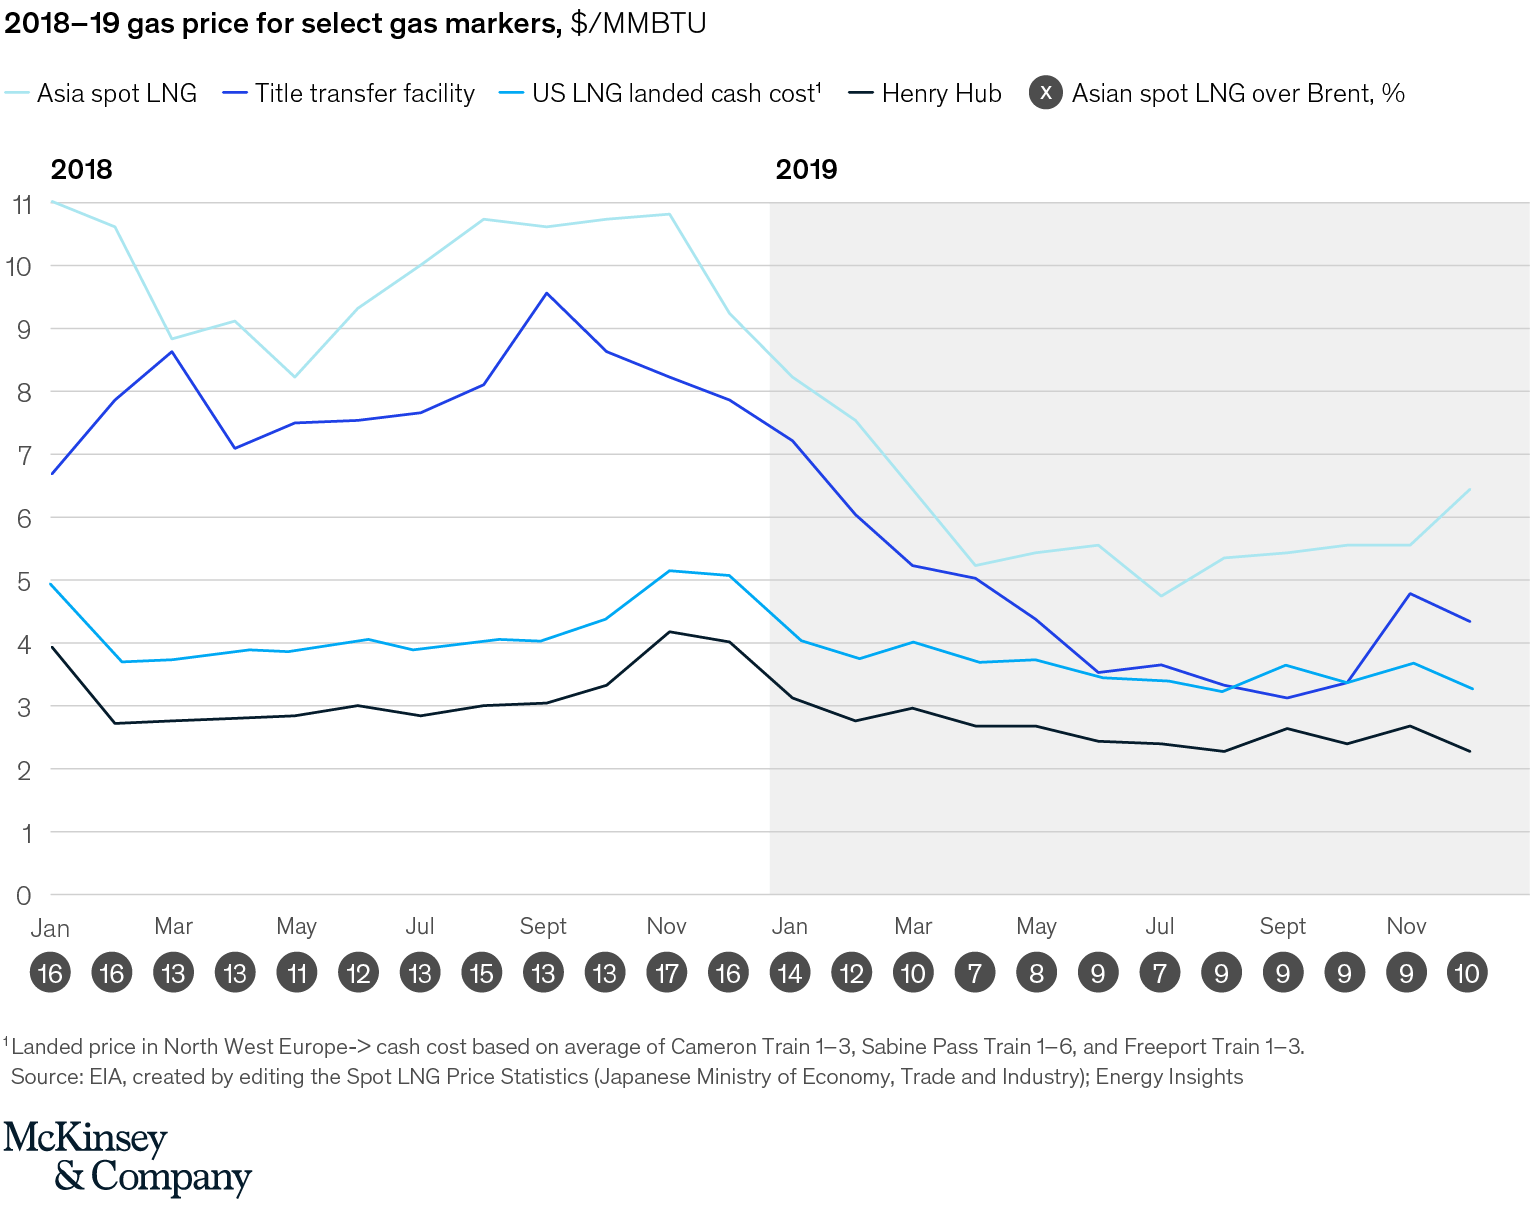
Although Europe remains the largest re-exporter globally (82 percent of global re-exports), more gas is staying in Europe with re-exports almost halving to 3.8 MT in 2019 from 6.0 MT in 2018. This further demonstrates the narrowing availability of arbitrage opportunities between European and Asian LNG spot markets, as the 2019 average differential hovers around $1.50/MMBTU, a 25 percent reduction from differentials in 2018. As a result, covering high charter rates has become a challenge.
Gas demand in the European Union has remained relatively flat year-on-year (+4 BCM). With the European Union becoming a sink for global LNG supply (+47 BCM), these additional imports have reduced Europe’s reliance on storage withdrawals (–27 BCM) and have filled the gap from declining domestic production and pipeline imports (–17 BCM), while still leaving a surplus to inject into storage (+9 BCM).
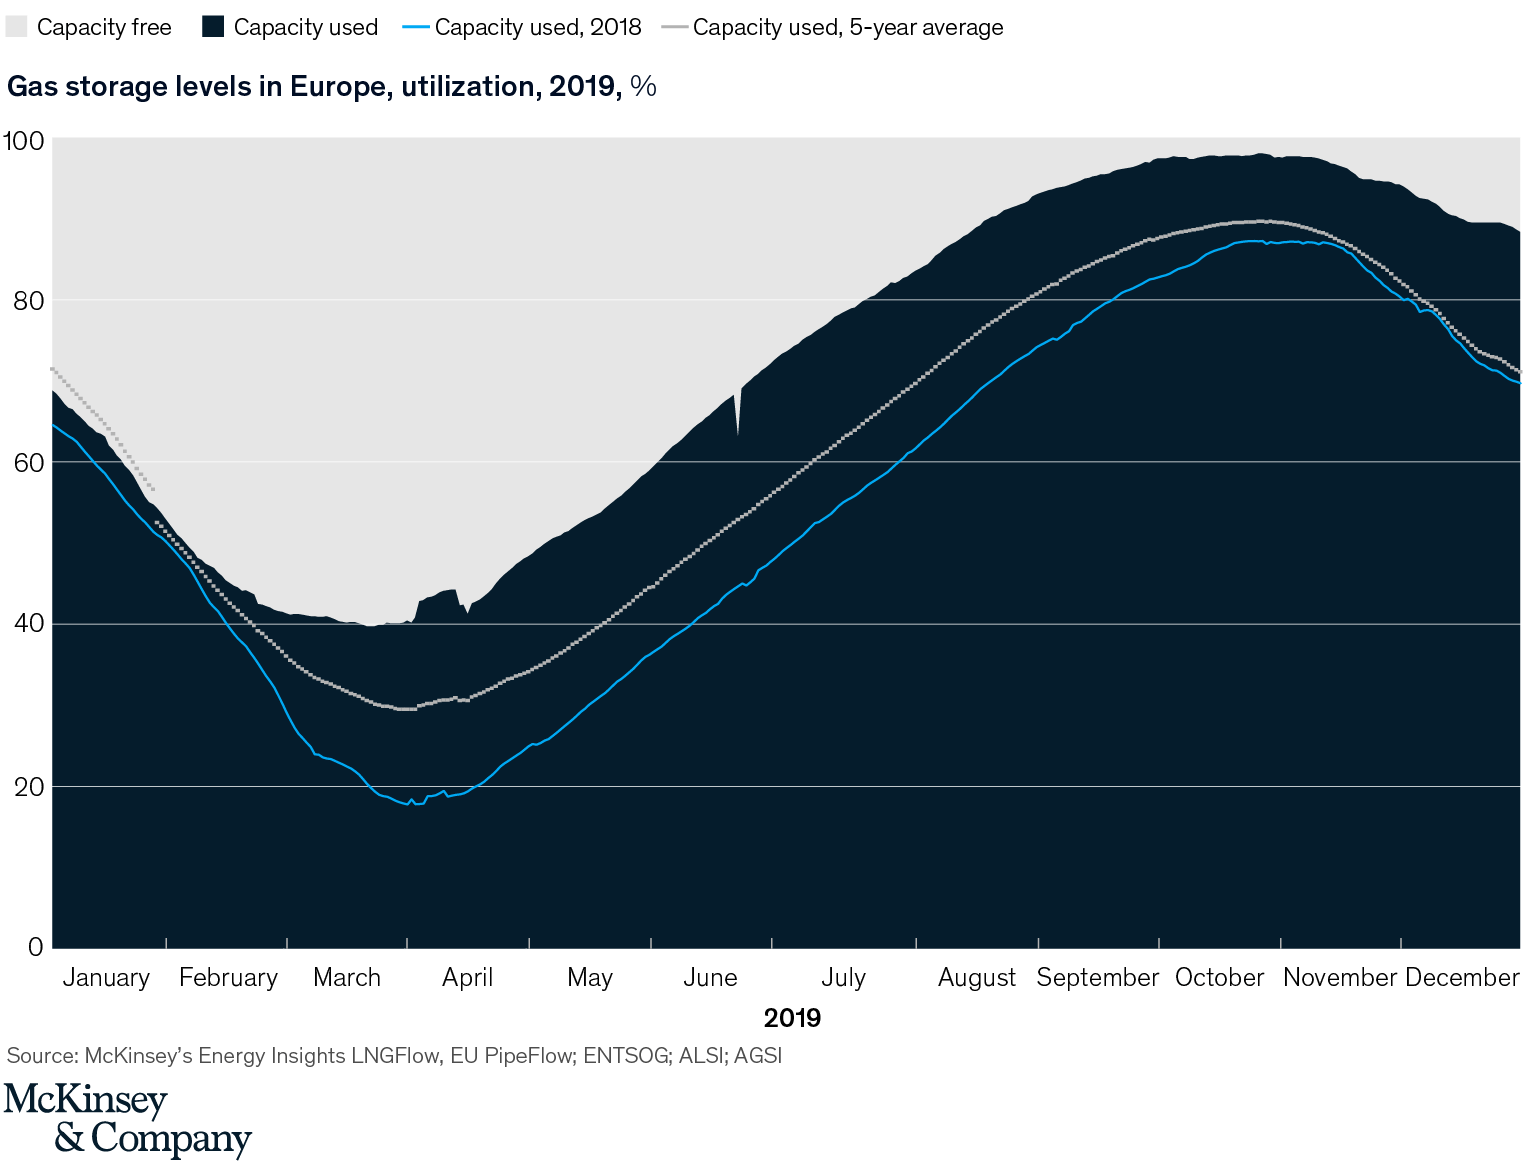
With European gas storage levels at nearly full capacity—and well above the five-year average—there is significant risk that storage levels at the end of winter will remain high, constraining gas storage injections over the course of 2020.
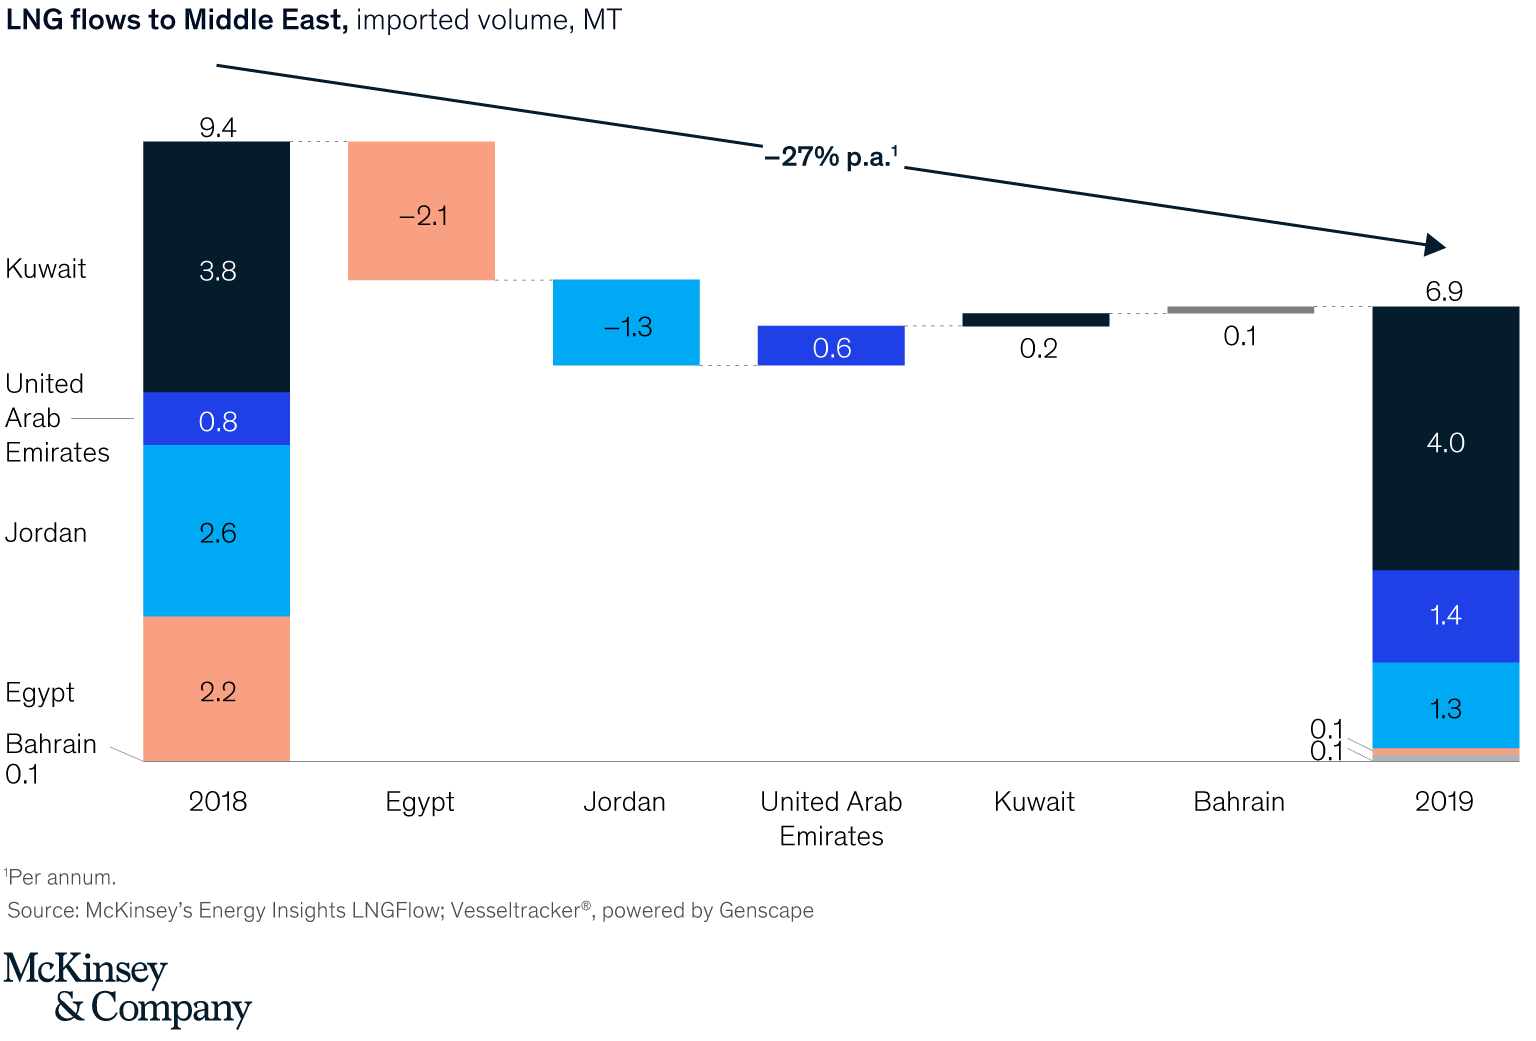
In the Middle East and Egypt, overall LNG net imports were down 27 percent year over year primarily driven by Egypt transitioning from importer to net exporter, sending 3.5 MT of LNG to Asia (1.9 MT) and Europe (1.4 MT).
Regasification utilization
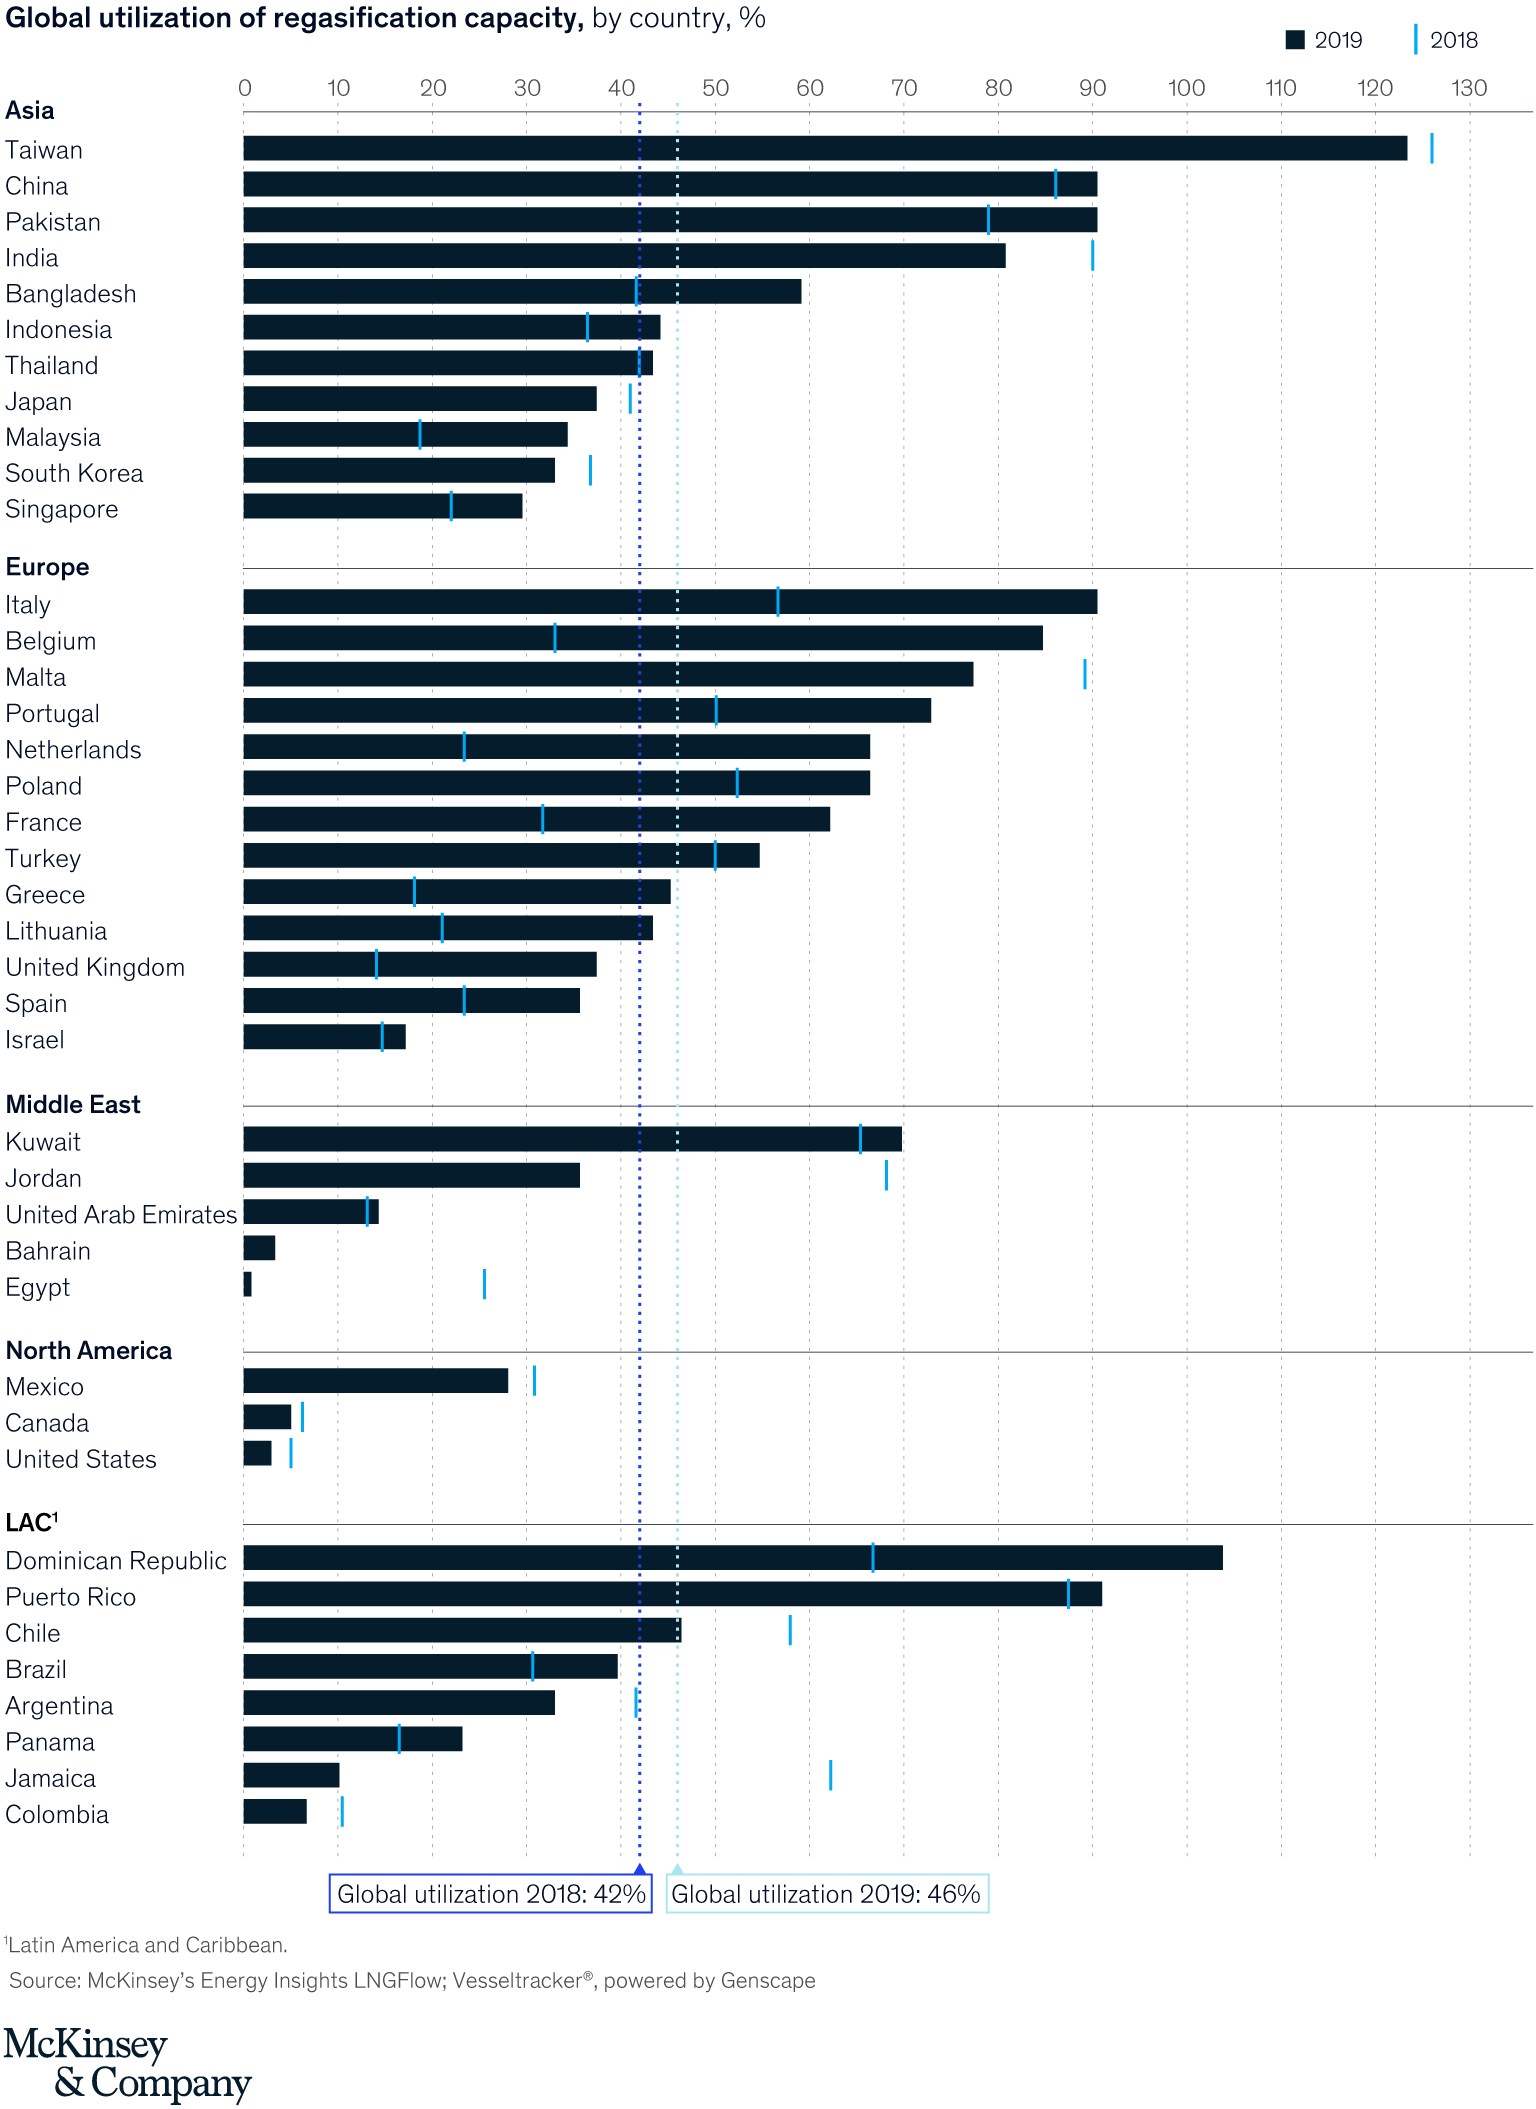
As a result of the increase in imported volumes globally, regasification rates have picked up in 2019 to 46 percent globally versus 42 percent in 2018. In particular, European utilization significantly increased (61 percent versus 39 percent), as imports surged.
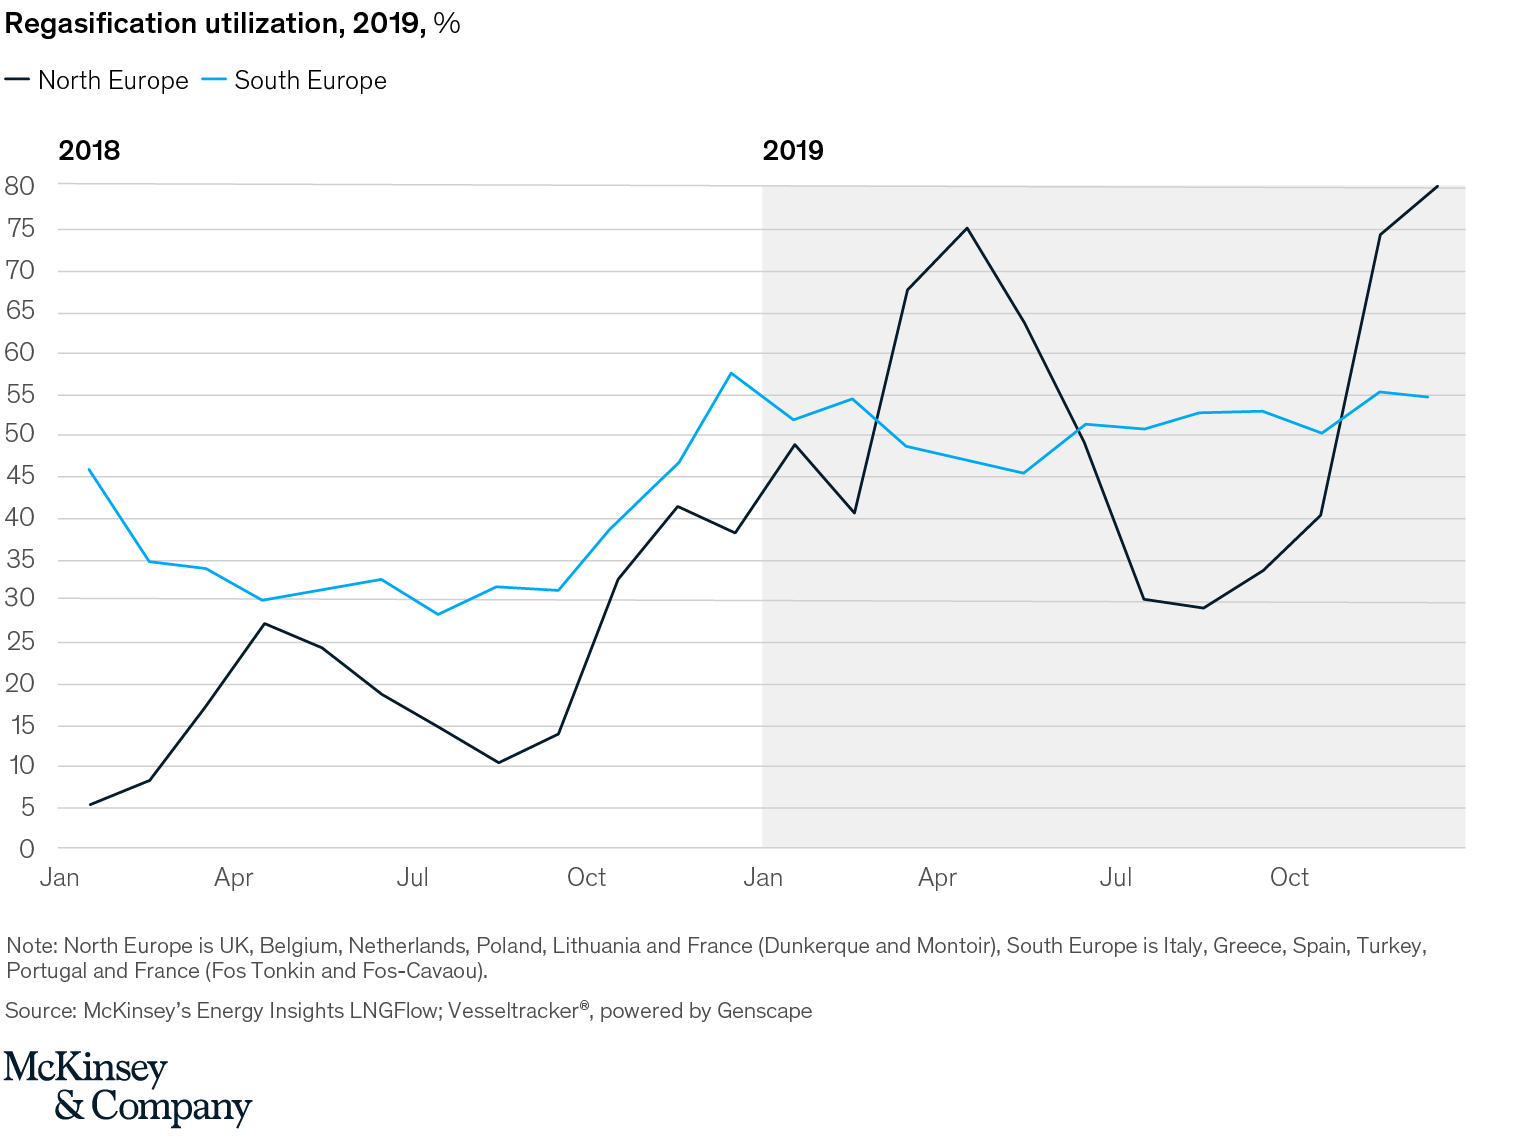
The spike in utilization was most pronounced in North European terminals where rates reached peaks of 80 percent for the winter months (versus peaks of 40 percent in 2018). Southern Europe showed a less marked increase, but utilization was a steady 10 percent higher than 2018.
Implications for 2020
- In 2020, LNG volumes are expected to continue growing versus 2019 with production ramping up at Corpus Christi, Freeport, and Elba Island in the United States. Furthermore, Yamal LNG’s fourth train is expected to be commissioned in H1, as is headroom for a further ramp-up in Australian LNG utilization. The competition to place volumes should become more pronounced as LNG exporters compete for customers on the back of increasingly sizable US LNG outflows. With Northern European regasification utilization running at high levels in 2019, some terminals are expected to utilize their full capacity in 2020.
- The prospect of further increases in LNG volumes heading to Europe is likely to lower gas prices as European storage facilities are already close to capacity. Sluggish demand in Asia presents an additional risk to the market if the incremental volumes cannot be absorbed. In turn, this is likely to put US cash costs under sustained pressure for delivery to Europe, following the trend in 2019 when they were negative or borderline negative for several months.
- Intensifying the competition for the European gas market, additional pipeline capacity is expected to bring new gas flows to Europe in 2020. This includes the Trans Adriatic Pipeline and the Trans Anatolian gas pipeline, TurkStream starting deliveries in January 2020, and Nord Stream 2 potentially activating if the United States lifts sanctions.
The authors would like to thank Yara Saeed and Konrad Boszczyk for their contributions to this blog post.