


Brent prices averaged USD 71.5/b in June, (USD +7/bbl). Price growth was temporary and attributable to a temporary Israeli-Iranian conflict escalation, which increased perceived risks to stability of Middle Eastern oil output and offtake.
- Global oil demand. Global liquids demand increased by 1.8 MMb/d to 104.4 MMb/d. The seasonal increase driven by the US and the Middle East (+0.7 MMb/d and +0.4 MMb/d respectively)
- OPEC 9 production (excl. Iran, Venezuela, Libya). OPEC 9’s production increased by 0.3 MMb/d to 27.8 MMb/d, led by Kingdom of Saudi Arabia, which added 0.2 MMb/d. Eight core OPEC+ members have agreed to speed up their production hikes again, and to add 0.55 MMb/d m-o-m in August, in addition to the 0.41 MMb/d increase scheduled for July
- Non-OPEC production (excl. US shale). Non-OPEC production increased by 0.5 MMb/d, to 62.6 MMb/d. Growth was driven by Brazil (start-up of 180kb/d FPSO Alexandre de Gusmão, deployed at Mero) and Kazakhstan (Tengiz ramp-up), which continues to exceed it’s OPEC+ quota
- US shale oil production. US shale production was flat (+0.02 MMb/d), at 9.2 MMb/d. Active rigs declined by 16, to 537
- Iran, Venezuela, Libya production. Combined production of Iran, Venezuela, and Libya declined 0.2 MMb/d to 5.4 MMb/d, driven by Iran, which suffered airstrikes by Israel. Oil assets in the country were not damaged
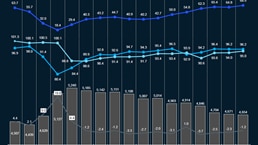
- Commercial inventories.1 Global commercial inventories decreased by ~23 million barrels in June, mainly driven by non-OECD. Overall, inventories have remained relatively steady at ~4.5 billion barrels over the last six months
- Market sentiment. In June sentiment was driven by perceived risk of Israeli-Iranian conflict spilling over to the broader region and disrupting local production and offtake. During a 2-week escalation, Brent spiked to USD 80/b (+12 USD/bbl), only to give gains back entirely when ceasefire was agreed. Markets also digested the impact of further acceleration of OPEC+ cut rollbacks amid softening tariff tensions between the US and its key trading partners
1 Non-OECD share of inventories is estimated, assuming that non-OECD inventories have 50% days of demand cover of OECD inventories
Download dashboard:
Oil supply & demand dashboard: June 2025
Subscribe to Energy Solutions
To receive our oil supply & demand dashboards, please subscribe to upstream oil and gas updates from Energy Solutions.