


Brent crude rose to USD102/bbl (+USD31.1/bbl) as the market moved into sharp supply deficit of 9.8 MMb/d driven by escalating geopolitical tensions in the Middle East combined with infrastructure disruption, as well as sanctions constraining access to Russian and Iranian exports
- Global oil demand. Global oil demand fell to 102.9 MMb/d (-1.9 MMb/d). This was largely driven by a decline in demand in China and Japan (-0.4 MMb/d) due to soaring prices amid supply shortages
- OPEC 9 production (excl. Iran, Venezuela, Libya). OPEC 9’s production plummeted to 21.2 MMb/d (-8.5 MMb/d) as Saudi Arabia (-2.6 MMb/d), Kuwait (-1.26 MMb/d) and UAE’s (-1.26 MMb/d) production declined due to the blocking of the Strait of Hormuz as a result of the ongoing conflict
- Non-OPEC production (excl. US shale). Non-OPEC production has declined by 1.2 MMb/d, to 62.1 MMb/d, as attacks on the major oil and gas infrastructure in Qatar have caused massive disruptions, leading production to fall by 1.4 MMb/d
- US shale oil production. US shale output increased to 9.4 MMb/d, rebounding from weather-related outages. Active rigs increased to 530 (+2) vs February
- Iran, Venezuela, Libya production. The combined output from Iran, Venezuela, and Libya fell to 5.5 MMb/d (-0.1 MMb/d) driven by Iran (-0.1 MMb/d) and Libya (-0.1 MMb/d) while Venezuela’s output increased slightly
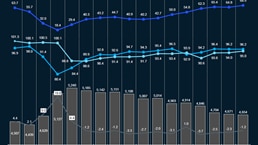
- Commercial inventories.1 Global commercial inventories decreased by about 54 MMbbl in March to roughly 4.6 billion barrels, driven by OECD (-44 MMbbl). Overall, OECD inventories are still around 78 million barrels above the five‑year seasonal March average
- Market sentiment. Market sentiment for oil was highly volatile, characterized by extreme bullishness to a cautious, short-term bearish correction with ongoing peace talk optimism. The structural sentiment remains heavily influenced by supply constraints as risks to oil flows in the Strait persist and damaged energy infrastructure in the Middle East will take time to return to its full capacity
1 Non-OECD share of inventories is estimated, assuming that non-OECD inventories have 50% days of demand cover of OECD inventories
Download dashboard:
Oil supply & demand dashboard: March 2026
Subscribe to Energy Solutions
To receive our oil supply & demand dashboards, please subscribe to upstream oil and gas updates from Energy Solutions.