



Welcome to McKinsey’s Chemical Insights Quarterly, our regular blog reviewing recent developments in the chemicals industry. In each edition, we share data-backed insights drawn from public and proprietary sources, expert perspectives, and the latest McKinsey research.
What we are seeing in October 2026
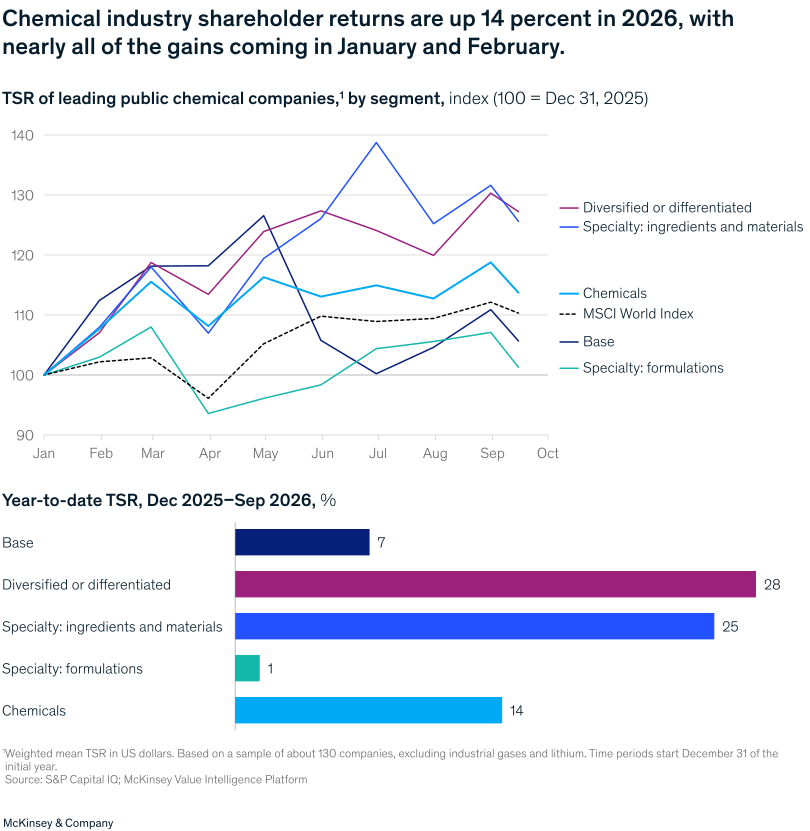
- Chemicals TSR performance has outpaced the broader market but has been volatile. Chemicals TSR rose 14 percent through mid-September 2026, compared with 10 percent for the broader world index (Exhibit 1). Most of the sector’s outperformance occurred in January and February 2026, before the Middle East supply constraints emerged, and TSR has been broadly flat since. This follows several years of the chemicals sector lagging behind the overall market, with a CAGR of 5 percent since the start of 2023, compared with 21 percent for the world index.1
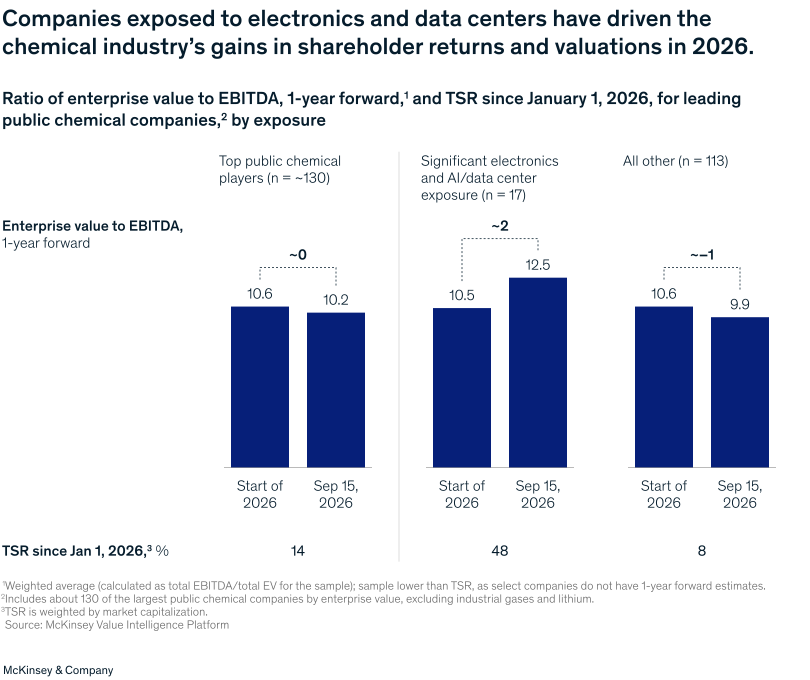
- Electronics and data center exposure is driving the strongest TSR contribution. Chemical companies serving electronics and data centers have generated TSR of about 48 percent so far in 2026, compared with 14 percent for the chemicals industry overall (Exhibit 2). Their enterprise-value-to-EBITDA (EV/EBITDA) multiples increased by roughly four to five turns during the year. Aside from electronics-related businesses, valuations across the chemicals industry have been fairly consistent in 2026.
- The Middle East disruption continues to play out, but its effects on petrochemical markets have been more limited than a previous McKinsey analysis estimated. Supply and shipping constraints continued into the third quarter of 2026.2 Petrochemical prices have so far moved broadly in line with feedstock costs, and the pricing effect has been more limited than earlier market commentary indicated.3 Imports into Asia and improving global availability have helped moderate the impact. Approximately 8 million metric tons per annum (MTA) of global ethylene capacity came online from April through July 2026.
- Chemical companies are shifting from cost transformations to structural change. With demand recovery outside of Asia no longer assumed for sectors other than electronics, players are looking for ways to change their positioning, including through M&A. Many are focusing on portfolio moves, consolidation, asset rationalization, and reducing capital projects. On AI, discussions are shifting from pilots and productivity gains to embedding AI in core processes.4
These dynamics are explored in more detail below, across performance and M&A, commodity margins and trade, and end-market demand.
Performance and M&A
- Profitability is rebounding sharply for petrochemical players. Based on equity analyst estimates, EBITDA for the largest-revenue public petrochemical companies is expected to nearly double from 2025 to 2026—an estimated 106 percent increase—with total EBITDA in line with 2019, 2020, and 2022.5
- Industry free cash flow is expected to recover through 2027, as capital intensity continues to decline and operating cash flow rebounds. Capital expenditures among the top chemical companies have fallen from approximately $80 billion in 2023 to an estimated $60 billion in 2026—the lowest level in seven years. Higher free cash flow could support balance sheets, based on equity analyst estimates.
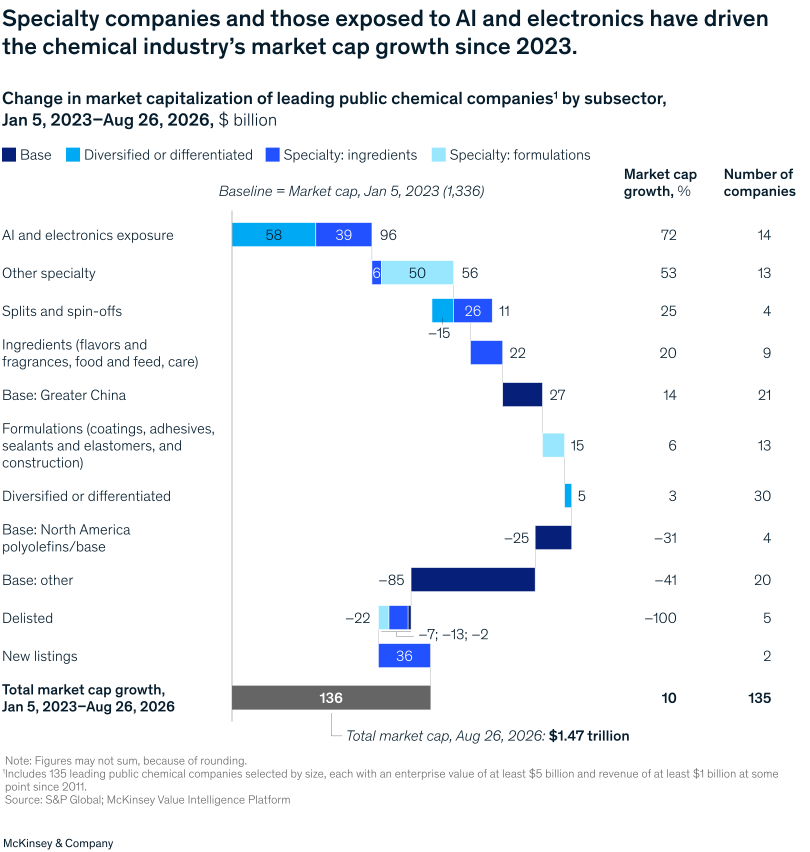
- Petrochemical players have seen a negative impact on industry returns over the past several years. Base-chemical market cap outside of Greater China is down approximately $110 billion since the start of 2023, while market capitalization of Greater China base chemicals is up about $25 billion (Exhibit 3).
- Large-scale M&A activity is continuing. The number of announced chemicals transactions valued at more than $1 billion increased to 18 in 2025, compared with an annual average of 13 from 2016 to 2025.6 Activity in 2026 is already tracking at about 20 deals and includes consolidation, spin-offs, and investments in higher-growth segments, including multiple $10 billion-plus deals.7
Webinar
Chemicals 2026: New growth amid a shifting industry landscape
Friday, October 23, 2026 at 9:00 am ET │ 3:00 pm CET
Stalling demand in core businesses, cost challenges, and recent disruption around the Strait of Hormuz has brought renewed attention to the resilience of global specialty chemicals and petrochemicals value chains. But beyond near-term volatility, a set of longer-term shifts—from new sources of demand to portfolio repositioning and AI adoption—could have significant implications for the sector.
The session will bring together near-term market developments and longer-term structural trends to explore what they could mean for chemicals companies and their strategic priorities.
Commodity margins and trade
- The duration and market implications of the Middle East supply disruption remain uncertain. Constraints on shipping corridors continued in September 2026, and oil prices started increasing again in the third quarter.8 Petrochemical prices, however, have not yet increased beyond levels broadly explained by higher underlying feedstock costs.
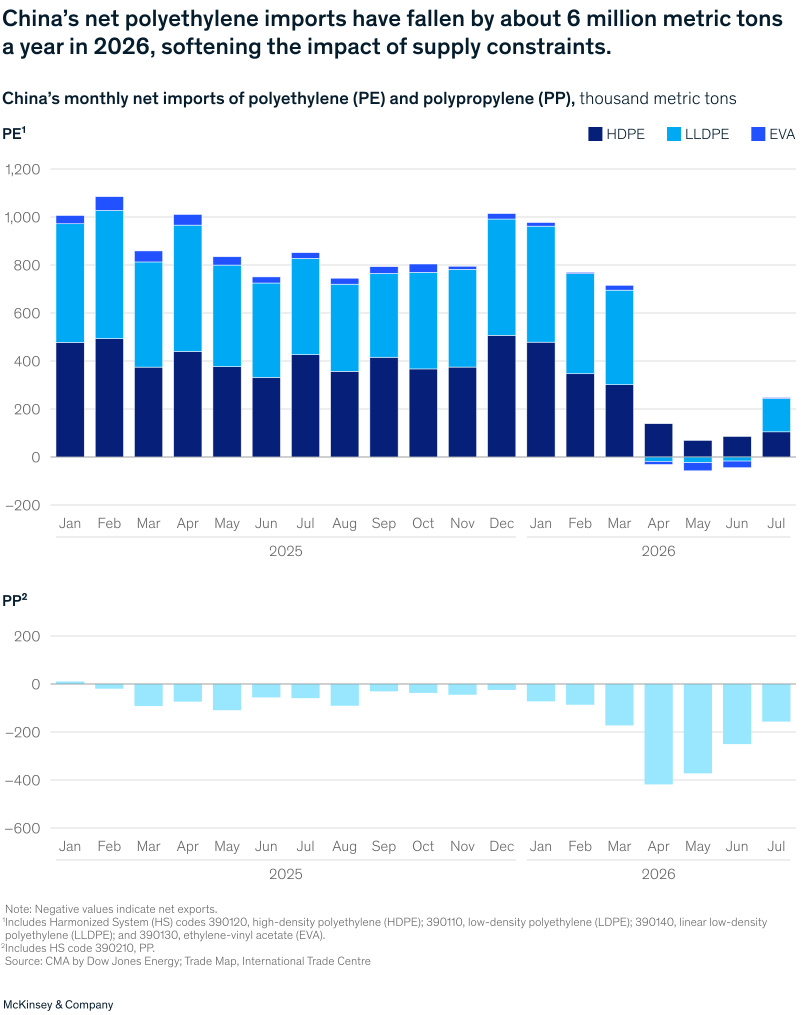
- China’s lower petrochemical import requirement is limiting the impact of supply constraints on Asian markets. China’s net polyethylene (PE) imports fell by approximately 6 MTA on a run-rate basis in 2026 compared with 2025, a change visible in trade data from April 2026. Polypropylene (PP) exports also increased sharply in the second quarter (Exhibit 4). These shifts have reduced Asia’s call on imported petrochemicals and helped limit the pricing effect of disrupted Middle East supply.
- China’s total exports across sectors have increased. Total Chinese exports increased 17 percent from March through July 2026 compared with the same period in 2025, averaging approximately $373 billion a month.9
End-market demand
- Demand growth remains concentrated in a few pockets despite improving industry sentiment. Electronic chemicals companies are seeing strong volume growth, with top players showing increases of approximately 15 to 20 percent. Specialty ingredients are seeing a broad return to more GDP-like growth in nonindustrial markets: flavors and fragrances, surfactants and care chemicals, and pharmaceutical and life-science additives grew at 2 to 3 percent over the past 18 months and at about 3 to 6 percent in the first half of 2026. Formulators’ volume growth continues to be challenged by higher construction and automotive exposure; for example, coatings volume growth was mostly flat.
- Downstream demand has strengthened in some segments, while industrial and construction markets remain challenged. Personal-care volumes among top public consumer packaged goods companies grew by approximately 3 to 4 percent in the second quarter of 2026.10 Other markets’ volume growth continues to be challenged, including packaging, automotive (light-vehicle production declined in the second quarter of 2026 compared with last year), and construction. Semiconductor demand continues to be the outlier, with industry sales up approximately 124 percent in the second quarter of 2026 compared with the second quarter of 2025.11
What we are watching through 2026
So far, 2026 has shown how unevenly the recovery is progressing across the chemicals industry, with shareholder returns concentrated among electronics-exposed companies and trade flows reshaped by both the Middle East disruption and China’s growing exports. Looking ahead, we will continue to monitor whether these gains mark a lasting shift in the industry’s trajectory, including overcapacity and weak demand growth. We will also monitor:
- how companies use recovering cash flows, whether to strengthen balance sheets, increase shareholder remuneration, or invest in capital projects and M&A
- whether Middle East supply disruptions tighten petrochemical availability and lift prices beyond feedstock cost increases
- how chemicals trade flows in and out of Asia evolve as short-term supply constraints meet the longer-term capacity cycle and where new capacity is coming online
- whether Western chemical companies see volume growth outside data centers and electronics, particularly in the building and construction, packaging, and industrial sectors
- whether M&A activity extends to long-held private assets as a potential signal of broader recovery across segments
The information in this blog reflects chemicals industry conditions as of October 2026 and is intended as a point-in-time snapshot, not a forecast and not investment, legal, sanctions, or policy advice. Given the dynamic nature of these markets, some details may have changed since publication.
The authors wish to thank Adam Youngman, Arjun Padmanabhan, Dorota Mista, Jonas Oxgaard, Lin Ju, Mikhail Kirilyuk, Przemyslaw Zima, Reagan Maddalone, Sari Varpa, Sweety Chandak, and Tea Liutkus for their contributions to this blog.
Want to be one of the first to view our insights? Subscribe to our quarterly newsletter.
1 S&P Global Capital IQ; McKinsey Value Intelligence Platform, accessed September 2026.
2 Toril Bosoni, “Oil markets strain to plug the gap left by Middle East supply shortfall,” International Energy Agency, September 18, 2026.
3 “Chemical Market Analytics,” OPIS, accessed September 2026.
4 McKinsey analysis.
5 Visible Alpha data, S&P Global; McKinsey Value Intelligence Platform, accessed September 2026.
6 Chemical week, S&P Global, accessed September 2026.
7 Chemical week, S&P Global, accessed September 2026.
8 Oil market report—September 2026, International Energy Agency, September 2026.
9 General Administration of Customs, People Republic of China, accessed September 2026.
10 Company earnings releases; US Securities and Exchange Commission filings; Visible Alpha data, S&P Global, accessed September 2026.
11 “Global semiconductor sales increase 35.1 percent from Q1 2026 to Q2 2026,” Semiconductor Industry Association, August 6, 2026.