For all the time and money companies invest in integrating separate businesses into a single strategy and culture, most managers also understand that different businesses have their own management challenges. Although they see their companies as more than the sum of their parts, they also create separate management, P&L, strategic plans, and performance targets for each of their business units.
So it’s surprising how often we encounter many of these same managers using a single cost-of-capital metric or valuation multiple across the entire organization—instead of breaking these measures out business by business, the way many outside observers and securities analysts do. For companies with distinctly different businesses, it doesn’t make sense to use the same cost-of-capital assumptions or valuation multiples— or even an average of them—when assessing these different businesses’ performance or strategic plans. At a universal bank, for example, its retail-banking, commercial-banking, asset-management, and trading businesses each have different economics, risk profiles, and valuations, and so contribute differently to the overall economics of the bank. Using the wrong cost-of-capital assumptions can lead group managers to allocate capital incorrectly, giving too much funding to some units and too little to others.
One obstacle to breaking these measures out is that the traditional approach requires managers to compare their businesses with others to derive a benchmark. Often, so-called pure-play comparisons with similar characteristics and performance may not exist. And even where there may seem to be an abundance of comparable businesses, identifying the right ones is often as much a matter of personal pride as of getting ahold of enough data.
For many companies, statistical modeling—or more precisely, regression analysis—can offer an alternative. It can help them more accurately estimate business unit–level betas and valuation multiples even where there are few pure-play comparisons, enabling them to make better trade-offs between businesses. Such modeling works in industries where many companies have different mixes of similar businesses—such as banking, chemicals, insurance, metals and mining, and technology.
In our model, which most analysts should be able to recreate on their own, using simple regressions in any common spreadsheet software, we started by assessing the business mix by revenue or asset weights—the independent variables—and regressed those weights against company-level multiples or betas—the dependent variables. The regression model then determines the betas or multiples for individual business units. With this approach, managers can draw on a broader range of companies—even including those they would not normally see as peers—and let the statistical regression control for differences in the size and makeup of their portfolios. As a result, analysts are more likely to find sufficient available data.
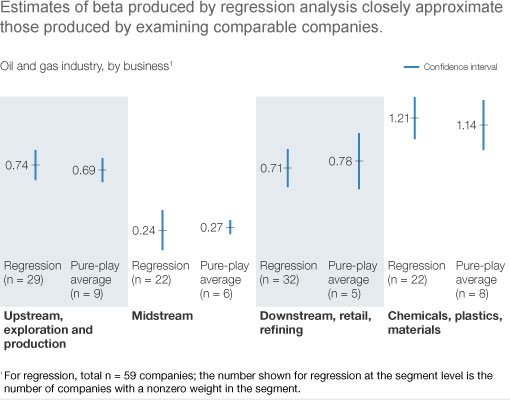
When we tested them, the estimates produced by this approach stacked up well against the traditional pure-play approach in the oil and gas industry, where pure-play comparables are abundant (Exhibit 1). We’ve also employed this approach in banking and insurance, where betas estimated by statistical correlation make intuitive sense at the business unit level and, when summed up, are consistent with estimates of industry betas.
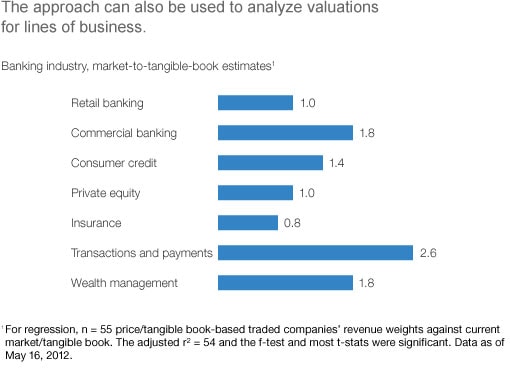
Moreover, when we extended the approach to estimate the market-to-tangible-book multiples for lines of business in banking (Exhibit 2)—estimates that, given the lack of pure plays, are hard to generate any other way—we were able to better understand the different valuations that investors were implicitly assigning to different businesses.