Cost cutting is a crucial value driver for consumer-goods companies, but its impact is finite. What do you do when all the cost is out of the system? Most industry analysts agree that volume-driven earnings growth is the key to future prosperity and independence. But how do you make it happen?
Many companies seek to boost sales by increasing trade spending, especially in highly contested categories, such as processed food and beverages. But in the vast majority of cases, even dramatic increases in trade spend have failed to bring about substantial, sustainable market share gains.
In effect, an increase in trade spending is nothing else than an indirect price reduction. It may help consumer-goods manufacturers steal market share from competitors temporarily, but when competitors counter the investment with their own promotions, the pendulum will swing back. In the long term, such price wars damage everyone’s brand equity. Consumers are trained to buy a brand only when it is on sale. Nobody wins.
So if trade spend doesn’t do the trick, how do you find the treasure trove that will help you outgrow an ever more fragmented market? This is where Growth Mapping comes in. Essentially, Growth Mapping is about aligning what manufacturers make with what consumers want. It combines different types of segmentation—of people (demographic), their choices (behavioral), and their underlying needs—to detect and unlock new sources of volume-driven growth, be it from existing, neighboring, or new categories, channels, markets, and brands.
Consider the case of a maker of premium pet foods. The company was looking for growth opportunities, and it used Growth Mapping to discover an unmet need: snacks that actually help clean and strengthen dogs’ teeth. In the past, various competing manufacturers had claimed that their products improved canine oral health, but the teeth of dogs were rotting anyway, resulting in cumbersome and costly trips to the vet. The pet food company in question invested in the development of a product that actually worked in clinical trials. The product exceeded all expectations and quickly became the company’s biggest growth driver.
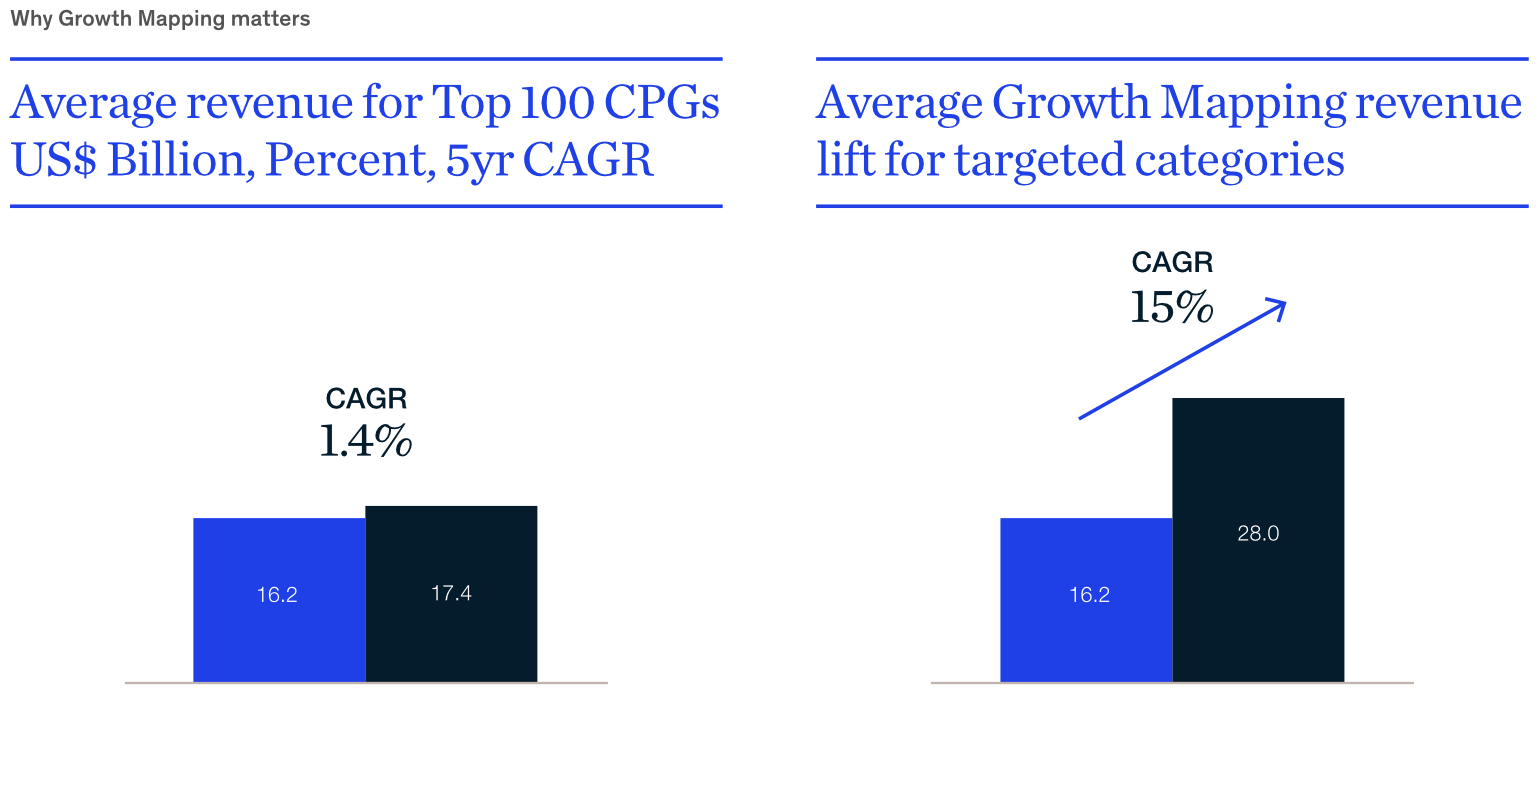
Growth Mapping turns big data into a fact base for the entire organization to rally around and prioritize growth initiatives according to their prospective payoff. According to a recent McKinsey analysis, companies that use Growth Mapping outperformed their category average by a factor of ten in the five-year period ending in 2016.
While the average revenue growth for the world’s top 100 consumer goods companies was 1.4 percent (CAGR) for that period, users of Growth Mapping achieved a revenue uplift of 15 percent (CAGR) in targeted categories (see Exhibit 1). While the focus of this analysis, and of this document, is on consumer goods, Growth Mapping has also successfully been deployed in other B2C industries, such as banking, insurance, and telecoms.