
In his autobiography, Mark Twain wrote “A man who goes around with a prophecy-gun ought never to get discouraged: if he will keep up his heart and fire at everything he sees, he is bound to hit something by and by.”
I, too, have found the surest way to get credit for predicting something spectacularly well is to make many predictions and not mention the erroneous ones. In the wake of the Brexit vote and the U.S. elections, I’m sure many political forecasters wish they could enthusiastically subscribe to this dictum! In our work as consultants, we have to make many predictions and can’t shoot from the hip. Our success is measured by the value generated through the strategic decisions that we define as irreversible choices when facing uncertainty, rather than our ability to correctly predict the events that influenced them.
Consider again the forecasting for the U.S. and U.K. votes. What’s more important than forecasting precision is our confidence in the predicted range of outcomes. This information can give us a clearer picture of reality so we can tailor a strategy that optimizes our actions against the full range of possibilities, allowing us to deflect (or prepare for) the worst case scenarios.
In 2009, I worked with a premium goods company whose management was nervous about investing in China. Global sales had been declining, and the company faced tough choices. We built a model estimating the market opportunity for them by 2015 and suggested they could be at least five times as big by then and that China could become their biggest market after the U.S. (and a more profitable one). That was enough to convince the executives the risk of missing on China was bigger than the risk of over-estimating the potential, and they made it their top priority. Ultimately we guided them to the right decision, although we did underestimate market growth, which by 2012 had exceeded our 2015 prediction.
I have made a lot of similar predictions in my six-year stint in China, during which I led our greater China Consumer Center and Strategy Practice. I made predictions about the pace of expansion of many markets (such as luxury goods), the evolution of sales channels (and the pace of development of the then nascent online sales channel), the development of cities and city clusters, and the rise of the Chinese middle class and how it may change (or not) its attitudes and preferences. These predictions influenced important strategic decisions on supply chain and distribution footprint, branding and marketing plans, product development and regulatory management.
In 2011, we capped five years of analysis and research with a report trying to predict how the Chinese consumer will evolve by 2020 and I recently compiled a progress report on these predictions, which has just been published on McKinsey Quarterly.
As I was doing so and reflecting on my learnings about business predictions, I thought it’s an opportunity to share what I think helps to develop good estimates and use them aptly in strategic decision making.
- Start from momentum
- Clarify the context
- Study inflection points
- Make it add up
- Re-create the past
Leaving aside unforeseen events and natural disasters, past performance is a strong indicator of future events. Recent evolution (what we like to call “momentum”) is likely to follow in the same direction for at least a while longer, short of significant events or inflection points (more on that below). If a market has been declining for three years in a row it’s quite likely to continue to decline. If the decline has been accelerating, the pace may be worse the next year. This may be even truer for the performance of specific businesses. Similar to sports, unless you made noteworthy changes to the squad, it would be absurd to expect very different outcomes.
Three years of market decline could be either structural or may be cyclical. So it is important to understand why it’s happening. There are mega-trends such as digitization or health and wellness that suggest the decline of print publishing and carbonated soft-drinks consumption is very likely to continue. Consumption of luxury goods may dip and rise at a higher beta than the overall economy. When we made predictions about Chinese consumers we often looked at how consumers behaved in other markets when the economy advanced (and discretionary income rose). In some cases the Chinese were not different than other Asian (and even Western) counterparts, while in other cases they very clearly diverged. This was how we decided consumers are likely to become more individualistic and brand loyal but not less conscious about efficient purchases.
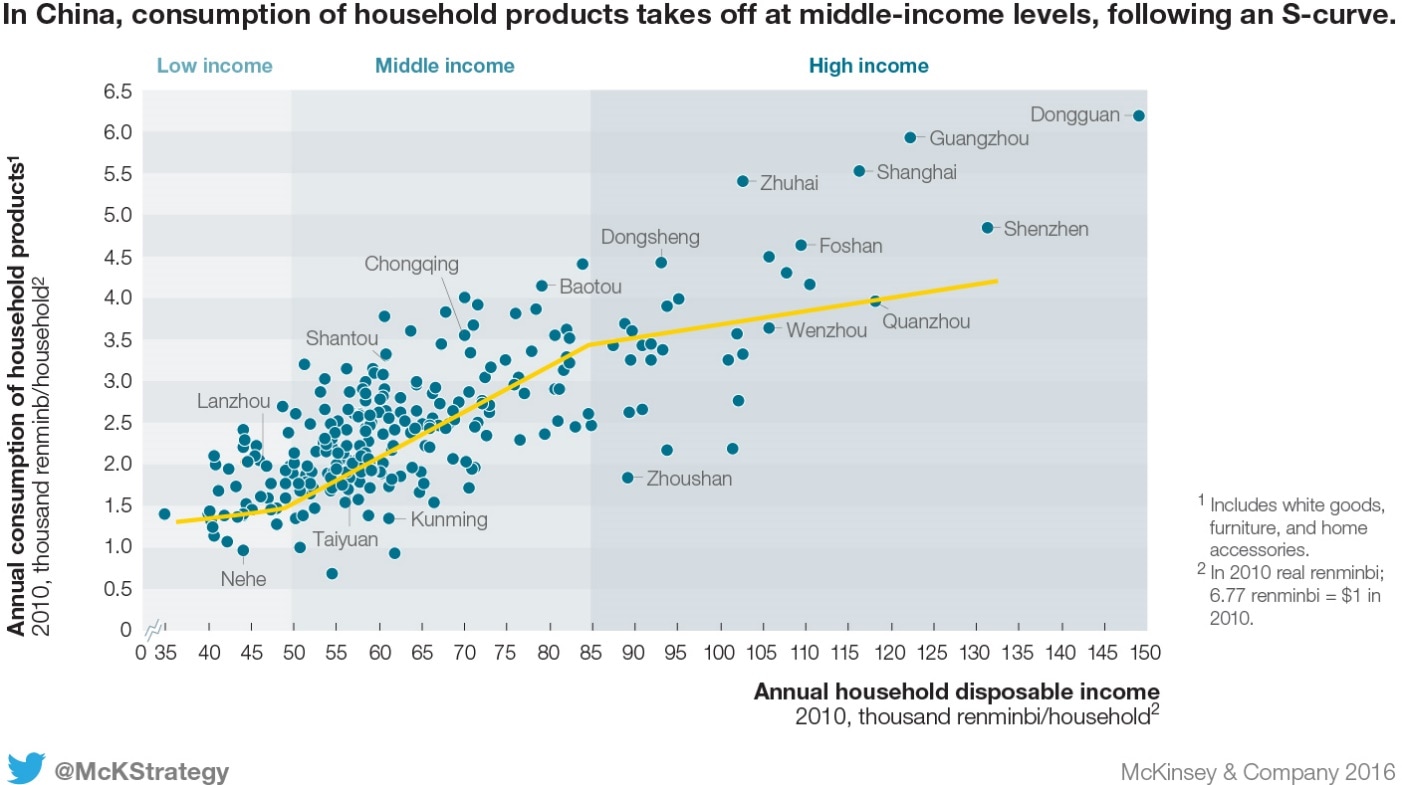
This is where science meets art to add crucial nuance to the momentum approach. There are various kinds of inflection points – they can be economic, infrastructural, social, technological or regulatory. In our China market forecasts we often referred to an illustrative s-curve (observing that actual regression curves where directionally similar) to describe the relationship between income per capita and consumption of goods and services. Take cars as an example. Even as income per capita starts to rise, it takes time until consumers can afford to buy a car. The market then hits an inflection point where growth accelerates until it decelerates (growing slower) as affordability stops being an issue. We were able to dig deeper to look at sub populations because the average isn’t as important as the number of people who are reaching affordability every year. This dynamic varied across cities of China, meaning inflection points took place in different years.
Economic growth is not the only driver accelerating demand. Other inflection points include improved roads, drivers’ education, car sharing and easier-to-drive cars and regulatory changes (consumption tax, driving age, city licenses).
In sports, consider England’s Premier League football clubs. There are 380 games played a year. If one side wins, it gets three points (none for the loser) or both sides get one point if it is a draw (which is three times less common). That means the 20 teams are playing for about 1,045 points (draw occurrence varies a little year over year). But it’s likely that if you predict each team separately when you add it up you will get to a very different number than 1,045 (typically much higher).
When we did our modelling in China we were sometimes more conservative than others because we tried to balance across consumption categories to make it add up to overall consumption per capita, as we found our initial modelling in each category was often more optimistic.
If you are building a pricing elasticity or churn propensity model, you are typically developing an algorithm with a certain prediction level (say 90 percent) that is actually predicting recent past behavior from a slightly more distant past. You may apply it to the future assuming the multivariate relationships will stay similar. But many business predictions are anchored on hypotheses about the relationship between future events and outcomes. We learn a lot by re-creating the past. Go back three or five years and forecast from that point with the same approach to see if you reach the results you expected. If not, why?
The last two are examples of some of my favorite triangulation methods and I would strongly recommend using others, such as debiasing techniques.
Prediction models are tools for executives to look at several scenarios and understand where in the range of outcomes the business impact lands. The predictions may not be sensational, but they often show certain trends compound their impact over time and should drive significant strategic changes.
Yuval Atsmon is a senior partner in McKinsey’s London office.
Originally published on LinkedIn.