Executives, board members, the press, and investors regularly look at total returns to shareholders (TRS) as an important metric of value creation. Yet TRS, like any performance metric, is instructive only when users understand its components. Actual corporate performance, for example, is only part of the mix, as TRS is also heavily influenced by changes in investors’ expectations of future performance. Sophisticated managers know that a failure to grasp how the various components work together can generate unrealistic expectations among companies or their investors and even steer companies to pursue more growth or take on more risk—without any value creation.
Sadly, most traditional ways of understanding TRS are flawed. Many of them, for example, define TRS as the sum of the percentage change in earnings plus the percentage change in market expectations—as measured by the price-earnings ratio (P/E)—plus the dividend yield. This simplistically connects TRS with changes in earnings, as if all forms of earnings growth created value equally. Not so. Earnings growth creates more value when it is rooted in activities that generate high returns on capital—such as the discovery of new customer segments for a company’s products—than in activities with low returns on capital, such as many acquisitions when the goodwill paid is taken into account.
Traditional approaches also err when they relate TRS to dividend payments. Dividends do not create value. For example, if a company pays a higher dividend today by taking on more debt, that simply means that future dividends must be lower. If a company pays a higher dividend by forgoing attractive investment opportunities, that also reduces future dividends. Finally, the usual approaches fail to account for the impact of financial leverage: two companies that created underlying value equally well could generate very different TRS, simply because of the difference in debt-equity ratio and the resulting differences in risk.
A better approach to understanding TRS breaks up the metric into four fundamental parts: a company’s operating performance, its stock market valuation at the beginning of the measurement period, changes in stock market expectations about its performance, and its financial leverage. The analysis can further divide a company’s operating performance into the value from revenue growth net of the capital required to grow, from margin improvements, and from improved capital productivity.
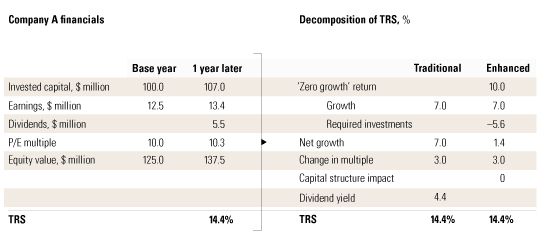
Consider a hypothetical example using a traditional approach to gauging TRS (Exhibit 1). Company A has a 14.4 percent TRS based on 7 percent earnings growth, a 3 percent change in the company’s P/E (as a proxy for changed expectations), and a 4.4 percent dividend yield. When we apply a more fundamental breakdown of the elements of TRS into the parts described above, however, we see that the reinvestment required to achieve the 7 percent earnings growth consumed most of the earnings growth; the TRS stemming from it is actually only 1.4 percent.1 With 3 percent coming from a change in expectations, the remain-ing 10 percent is the TRS that results from the company’s value at the start of the period—its “zero growth” return, which represents the company’s TRS if it had no earnings growth and investors had no change in expectations.2
The old versus the new TRS decomposition
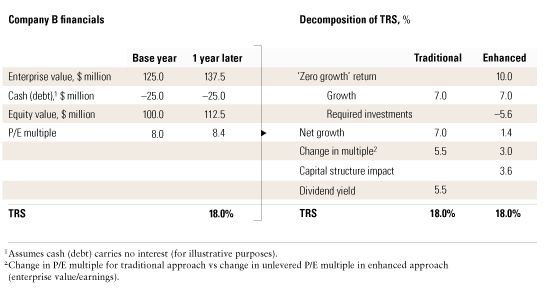
Let’s now consider Company B, which is identical to Company A except for its debt financing (Exhibit 2). As a result, Company B generated higher TRS but did not create more value after adjusting for higher financial risk. The traditional decomposition approach fails to reflect this and suggests that Company B’s shareholders benefited from a higher dividend yield and a stronger increase in expectations. The fundamental decomposition clearly shows that at the business level, companies A and B have an identical TRS from zero-growth returns, growth, and changed expectations, when measured by the unlevered P/E multiple (enterprise value/earnings). The additional 3.6 percent TRS for Company B now shows up under TRS from capital structure, indicating that it is leverage-induced and not value creating.
Illusory growth
Examples from various industries show how a more detailed, fundamental analysis can be illuminating. Let’s compare the TRS performance of the Dutch brewer Heineken and its Belgian–Brazilian competitor InBev. A traditional TRS decomposition suggests that InBev generated significantly higher annual shareholder returns over five years mainly because of its superior earnings growth (Exhibit 3). A deeper look with the new approach reveals more accurately where InBev made the difference.
A closer look
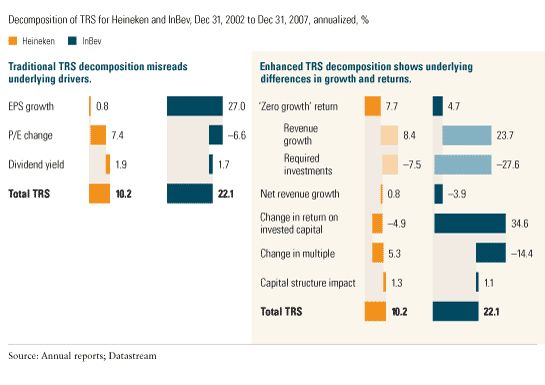
Compared to Heineken, Interbrew (now InBev) was facing a bigger challenge in 2002 to generate strong TRS. Its valuation multiple already reflected higher investor expectations for future value creation, resulting in a zero-growth return three percentage points below that of Heineken.3
Over the subsequent five years, revenue growth was not an important factor for shareholder returns: InBev’s top-line annual growth of almost 24 percent did not create positive shareholder returns once capital expenditures and good-will paid were taken into consideration. Heineken actually generated higher shareholder returns from much lower revenue growth.4
InBev’s outperformance of Heineken in terms of TRS was driven by its superior improvements in return on capital over the period. It generated an impressive 34.6 percent shareholder return per annum by pushing its return on invested capital5 (ROIC) from 14 percent in 2002 to an industry-leading 47 percent in 2007. Heineken, by contrast, saw its ROIC decline over the same period to 17 percent, from 24 percent, thereby losing around 5 percent in TRS.6
Finally, InBev’s TRS was negatively impacted by 14.4 percent as its valuation multiple declined from 2002 to 2007, reflecting lower stock market expectations that InBev would further improve its value creation. By contrast, the market increased its expectations for Heineken to improve its performance and growth after 2007, driving up TRS by 5.3 percent.
The analysis shows that InBev generated its shareholder returns through very strong operating improvements, not top-line growth. In contrast, most of Heineken’s TRS was due to a high zero-growth return and increased investor expectations. The company’s business growth and operating performance had little impact.
A more detailed decomposition of TRS can also offer insights into the drivers of shareholder returns in a sector as a whole. Take, for example, the stock market performance of the largest 25 European banks by market capitalization from 2002 to 2007 (Exhibit 4). These institutions are a good proxy for the entire European banking sector, as they represent around 80 percent of its assets. In aggregate, they have delivered a 15 percent TRS per annum over the last five years. A traditional TRS decomposition indicates that these returns largely reflect growth, suggesting that it is critical and that banks should focus on growth strategies.
Insight into a sector’s TRS
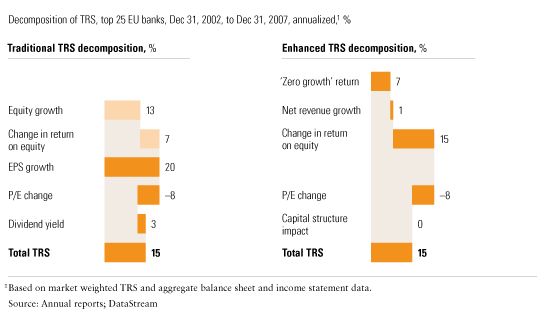
Once the analysis takes investment requirements and acquisition goodwill into account, however, it turns out that for the sample as a whole, growth didn’t drive shareholder returns. In reality, since 2002 better returns on capital have driven the creation of value in European banks, whose aggregate return on equity (ROE) increased to 23 percent, from 16 percent. This insight has several implications for managers. Going forward, value creation in the sector probably won’t come again from performance improvements, given the record profit levels of recent years. In fact, falling expectations show that investors believe that profitability will decline. Yet finding value-creating growth might be as big a challenge, since banks on average did not manage to generate TRS from growth in the recent past, when profitability was peaking. This leaves banks with a difficult problem: where to find attractive returns for their shareholders in the future.
Finally, executives can also use a finer-grained, fundamental TRS decomposition to evaluate potential performance tar-gets for shareholder returns. Too often, we see companies setting aspirations blindly—basing them, for example, on past TRS performance. If Company X earned 15 percent TRS annually over the last five years, you might think it reasonable to set 15 percent as the aspiration for the next five. But decomposing this TRS might show why it will be very difficult to con-tinue to achieve that level of returns.
Suppose that the 15 percent TRS of the last five years comprised 3 percent from operating performance, a zero-growth return of 8 percent (reflecting an initial P/E of 12), and 4 percent from the change in P/E (from 12 to 15 over five years). The challenge for Company X is that its zero-growth return is now 7 percent (because it has a higher P/E), and its current P/E is top quartile for its industry. Since the P/E isn’t likely to rise, there will probably be no contribution from that quarter. To reach a 15 percent TRS over the next five years, Company X will need to get 8 percent from operating performance—over twice its level during the last five years.
Related Articles