In the previous chapters, we described the behavioral shifts that the pandemic has caused in superstar cities and analyzed their impact on real estate demand. Although the shifts have happened everywhere we looked, the degree of change and the pace of recovery have varied significantly from city to city. A review of various components of this research—regression analyses, survey responses, and literature reviews—suggests that cities where the pandemic has strongly affected real estate demand tend to have certain characteristics. (We were unable to determine which of those characteristics correlated most strongly with the impact on demand.)
Here, we take a closer look at a few neighborhoods and cities, focusing on those characteristics, which fall into two categories. Some of them are related to the business mix in a city. Specifically, cities with a larger share of workers in the knowledge economy, a higher number of large firms, a higher ratio of commuters to residents, and more cultural acceptance of remote work tended to experience a greater impact on demand.1 Those factors lead to lower rates of office attendance, which reduce demand for office space directly, reduce demand for retail space by diminishing the number of office workers shopping at urban stores, and reduce demand for residential space by prompting people to move out of urban cores.
The other characteristics that correlate with the impact on demand are related to the urban structure of a city. Specifically, cities with office-dense real estate and little mixed-use development, as well as expensive housing and little green space, tended to experience greater impact on demand.2 Such characteristics make places less desirable for working, living, and shopping.
Two of those characteristics correlate with the impact on demand not just at the city level but also at the neighborhood level. We examined neighborhoods (defined by zip codes) in Manhattan, San Francisco County, and Harris County (home of Houston). According to our analysis, the larger the share of real estate in a neighborhood that was occupied by offices, the more out-migration from that neighborhood. Similarly, home prices correlated with out-migration: pricier neighborhoods experienced more out-migration. (Data limitations prevented us from finding out whether the other characteristics also correlated with demand at the neighborhood level.)
In this chapter, we focus on two Manhattan neighborhoods to see how those effects worked at the local level. We then study them in San Francisco, Paris, and Tokyo, cities whose real estate was affected very differently by the pandemic.
Business mix and urban structure make a difference at the neighborhood level
Two very different Manhattan neighborhoods show that business mix and urban structure correlate with demand at the neighborhood level. The business mix of the first neighborhood, the Financial District, is heavily skewed toward the knowledge economy; 50 percent of all office space there is occupied by knowledge-economy tenants, especially those in business services. The Financial District’s urban structure is office-dense: 80 percent of real estate is dedicated to offices, 17 percent to residences, and just 2 percent to retail. The average price of a home is roughly $1.5 million.
Now consider the nearby Lower East Side. The business mix is very different from the Financial District’s: just 22 percent of office real estate space is dedicated to the knowledge economy. The urban structure is different as well. Just 7 percent of all space on the Lower East Side is dedicated to offices, while 84 percent is residences and 9 percent is retail. The average home price, about $1.0 million, is considerably lower than in the Financial District.3
Those factors help us understand why the two neighborhoods were affected so differently during the pandemic. The domestic out-migration rate from the start of 2020 to the start of 2022 was 2.2 times higher in the Financial District than on the Lower East Side, for example. It stands to reason that residents of the Financial District could easily work from home, as the prevalence of the knowledge economy there suggests, and were therefore likelier to move to bigger homes far from their offices; meanwhile, expensive housing gave them another reason to leave.
At the city level too, business mix and urban structure drive differences
Three cities whose real estate was affected very differently by the pandemic—San Francisco, Paris, and Tokyo—demonstrate how business mix and urban structure explain pandemic-driven differences in demand for real estate (Exhibit 35). For example, in San Francisco, a city where the proclivity for remote work was high and mixed-use development was rare, demand was affected strongly. In Tokyo, a city different in both respects, the reverse was true.

San Francisco, a bastion of the knowledge economy, has been strongly affected by the pandemic
In San Francisco, the pandemic has led to particularly strong behavioral shifts. Office attendance has stabilized at about 50 percent of the prepandemic level, the third-weakest recovery among the ten largest US metropolitan areas.4 Migration out of San Francisco’s urban core reduced the population by a cumulative 5.8 percent from mid-2020 to mid-2022, and even the suburbs suffered out-migration and a population decline of 0.6 percent. Foot traffic near stores in the San Francisco metro area remains 24 percent below prepandemic levels.
As a result, real estate has experienced higher vacancy rates in San Francisco than in most of the cities we studied. From 2019 to 2022, the vacancy rate for office space increased by 13 percentage points (the largest change among the cities we studied), and the vacancy rate for residential space increased by 5.0 percentage points (a far larger change than the US average of 0.4 percentage point). Furthermore, during the same period, home prices grew by just 13 percent in San Francisco, much more slowly than they did in the United States as a whole (43 percent).
San Francisco’s business mix helps explain the impact. The city has long cultivated a technology-focused economy with a large population of office workers, especially knowledge-economy workers. It has many inbound commuters, as the employment-to-population ratio shows: that ratio, a proxy for the prevalence of commuters, is 0.87, starkly higher than the national average of 0.48. Furthermore, San Francisco’s employers, many of which are in the technology industry, may have been more likely to be aware of and adopt remote work technology when the pandemic began. And in our survey, respondents in San Francisco said that their ideal number of days to work in the office was 2.7, the lowest number in the cities we studied.
San Francisco’s urban structure also helps explain why the pandemic affected its demand so strongly. Home prices in San Francisco County are five times higher than the national average and almost twice as high as prices in the suburbs. And San Francisco has limited mixed-use development: offices represent 30 percent or more of all real estate in nine of San Francisco’s 26 neighborhoods, a far greater share than in Houston, where that is the case in only five of 39 neighborhoods.
Our model shows a dire outlook for San Francisco’s future. Residential vacancy rates there could be at least seven percentage points higher than their 2010–19 average by 2030. Demand for office space could be 20 percent lower than it was in 2019, and demand for retail space could be 17 percent lower. Demand for residential space could be 2 percent lower in 2030 than it was in 2019—the smallest such increase among the cities we modeled. (The model does not consider price elasticity; that is, it does not account for the fact that when demand decreases, prices fall, pushing demand partway back up. For more about the model, see chapter 2 and the technical appendix.)
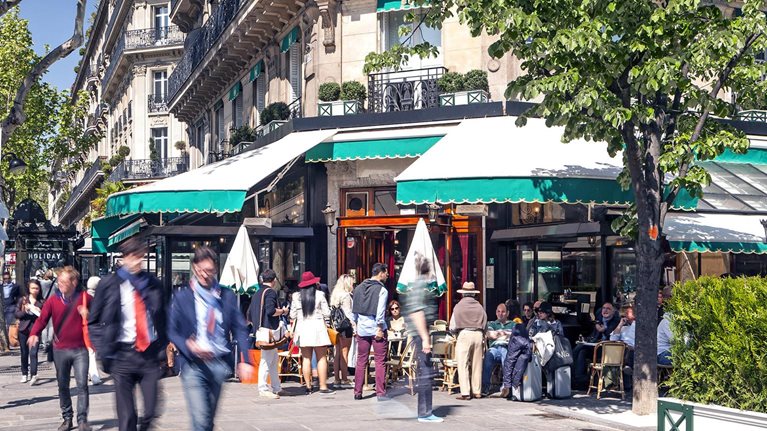
Paris, more diversified and less expensive than San Francisco, was less strongly affected
Pandemic-caused behavioral shifts have been less striking in Paris than in San Francisco. Office attendance in Paris has dropped to an average of 3.4 days per week, only slightly below the overall average in our survey (3.5 days). Net out-migration during the pandemic was not much greater than before. The city’s overall population trends have not changed much either; population continues to decline in the urban core and grow in the suburbs. But foot traffic near stores in the metro area remains 16 percent below prepandemic levels.
The behavioral shifts have increased vacancies and reduced projected real estate demand in Paris, though not as sharply as in San Francisco. From 2019 to 2022, vacancy rates in Paris increased by two percentage points for office space, two percentage points for residential space, and four percentage points for retail space.
Business mix helps explain why Paris was affected less severely by the pandemic than San Francisco was. Paris’s industry composition is diverse. Unlike San Francisco, which is heavily dependent on the knowledge economy, Paris is home to companies that are global leaders in a wide variety of industries, such as beauty, hospitality, consumer retail, defense, and finance.5
But Paris’s urban structure has features that push residents away as well as those that pull them in. On the one hand, home prices are twice as high in Paris’s urban core as in its suburbs and four times higher than the national average, perhaps explaining the out-migration from the urban core that has been happening since at least 2010 (Exhibit 36). On the other hand, Paris has a great deal of mixed-use development.

According to our model, demand for office space in Paris in 2030 could be 13 percent lower than it was in 2019, and demand for retail space could be 9 percent lower. Demand for residential space in the suburbs could be 9 percent higher in 2030 than in 2019, while demand in the urban core could fall by 4 percent.

Tokyo, industrially diverse and relatively inexpensive, was affected only lightly by the pandemic
The pandemic-induced behavioral shifts in Tokyo have been among the smallest we studied. As in Paris, office attendance has dropped to 3.4 days per week, only slightly below the overall average of 3.5. From October 2020 to October 2022, Tokyo’s urban core and suburbs grew at about the same pace—in stark contrast with most of the cities we studied, where the suburbs grew much more quickly. However, despite those relatively small shifts in office attendance and migration, foot traffic near stores remains 9 percent lower than it was before the pandemic in Tokyo as a whole. It is down 4 percent in the suburbs and 20 percent in the urban core.
Demand for real estate has therefore been affected less in Tokyo than in most of the cities we studied. While the vacancy rate for office space increased by six percentage points, residential vacancy was unaffected. Strong home demand in Tokyo’s urban core led home prices there to grow slightly faster than the national average rate from 2020 to 2022 (Exhibit 37).

Tokyo’s business mix is partly responsible for the city’s muted behavioral shifts and relatively rosy outcomes. The most common industry for workers to be employed in is wholesale and retail trade, in contrast with technology-dependent San Francisco.6 Like Paris, Japan has a culture that values being present in the office, in particular among employees of small and medium-size businesses; in our survey, respondents in Tokyo said that they expected to be required to be in the office 3.7 days per week, higher than Paris’s 3.3 days. Loyalty to employers is also common in Japan, as are lower rates of technology adoption than in San Francisco.7 Furthermore, online spending as a share of retail spending was lower in Japan than in any other country we studied; that may have contributed to higher office attendance and continued in-person retail shopping.
And with regard to urban structure, while Tokyo suffers from the same affordability problems that other superstar cities do, they are somewhat less severe. In Tokyo, home prices in the urban core are 2.1 times higher than the national average. In Paris, they are 4.1 times higher, and in San Francisco, they are 5.0 times higher.
Our model estimates that future demand for real estate will be healthier in Tokyo than in most of the cities we studied. Demand for office space is projected to fall by just 9 percent from 2019 to 2030. Projected demand for residential space grows by 12 percent from 2019 to 2030 (lagging behind only Houston and New York City), and projected demand for retail space falls by just 2 percent (lagging behind only Shanghai).
Related Articles

Chapter 2: The impact on real estate