At a glance
- The ongoing Strait of Hormuz disruption is the latest—and largest—energy supply disruption. It may not be the last. Two-thirds of energy trade transits maritime chokepoints, and one-third crosses geopolitical lines. Ninety-five percent of people live in a region dependent on energy imports.
- The energy system has so far proven more resilient than expected. This is due mostly to temporary buffers and bypass pipelines for oil. Trade has rewired globally as China curtailed imports and the United States released inventories. The global economy has in many ways accommodated a drop in oil consumption—but unevenly, and the refining system is especially stressed.
- As the clock ticks, regions are pulling structural energy security levers. They range from electrification to coal, from rewiring trade to inventories and demand management. By 2030, responses underway or under discussion could offset 35 to 70 percent of the Strait’s precrisis oil flows in the event of a future shock. But implementation is uncertain and comes at a price. New pipelines are the cheapest option, yet they divert rather than displace Gulf oil and are vulnerable to broader regional disruptions.
- It’s not just the Strait: With energy security, there are no easy exits but room to maneuver. Replacing imports with mature clean technologies could, in theory, displace up to nearly one-third of oil and gas use. But it can be slow and expensive, and it hits hard ceilings. As a result, a combination of new sources of supply, infrastructure to rewire trade, and inventories plays an important role.
- Energy security concerns are reshaping the business case for resilience. While measures require investment, they also can cut costs over time, enable business continuity, and drive growth. Decision makers should map their exposure across fuels, assets, and routes—and act on it, from improving energy efficiency to building flexibility in inputs, suppliers, and logistics.
The on-and-off closure of the Strait of Hormuz is the most consequential in a succession of disruptions reshaping global energy and its flows. Over the past decade, markets weathered US–China trade tensions, COVID-19, Russia’s invasion of Ukraine, and increased geopolitical fragmentation. Taken together, they moved energy security—an economy’s ability to access energy to meet its needs within economic constraints, even during disruptions—from the back burner of strategic decision-making to its center.
The world has been here before. Past energy crises offer powerful reminders of what can be at stake: gas pump lines in the 1970s, double-digit inflation, recession, political upheaval.
This disruption initially brought back fears of this 1970s-type, worst-case scenario. At its peak, around one-fifth of the global oil and liquefied natural gas supply was exposed to disruption. After the Strait’s initial closure in March 2026, the conflict waxed and waned with closures and partial reopenings, as well as new regional disruptions at the time of writing. This has led to substantial uncertainty across energy markets.
But much of the global economy has held up better than perhaps had been anticipated, at least so far (though some regions were particularly affected). Growth slowed down but remained positive globally. Brent crude topped $120 but has since declined, albeit with ongoing swings.
What gives? It largely reflects a less energy-intensive global economy that is more reliant on services and energy system resilience built up over decades. The 1973 embargo led to fuel economy standards, nuclear energy expansion in some countries, and the creation of the International Energy Agency (IEA). With the lessons from past crises, the world benefited from strategic petroleum reserves, bypass pipelines for oil, and a diversified global trade network that was able to rewire. The world has shock absorbers, albeit imperfect, that were much more limited 50 years ago.
While these have kicked in, they have real limits. Pipelines and alternate routes have themselves been disrupted. Inventories aren’t infinite. Stress in parts of the system, particularly refining, has led to some demand destruction, with vulnerable societies bearing the brunt of economic pain. Uncertainty persists regarding when the crisis might be resolved. These factors are leading to concerns about long-term energy security that will outlast this disruption.
This report explores how shock absorbers helped cushion the blow of the world’s largest energy shock, what it reveals about the resilience—and lingering vulnerabilities—of today’s system, and how countries and companies in the energy sector and beyond may prioritize energy security going forward.
Energy security is less about eliminating dependencies than managing them effectively. There is no single route to resilience. Decision makers will need to build a portfolio of levers to prepare for future shocks. Different measures work over different time horizons, in different contexts, and with different trade-offs—including their emissions footprint—at a time when the world is already not on track to meet the goals of the Paris Agreement.1
Ultimately, there are no easy exits, but there is considerable room to maneuver. For countries and companies that get it right, energy security need not simply be a cost to bear. It can reduce exposure to volatility, strengthen business continuity, and open opportunities to better navigate a more volatile future.
The shock and the shock absorbers
The 2020s have been marked by big disruptions affecting global energy and trade. But the Strait of Hormuz crisis of 2026 is in a category of its own.
How has the energy system borne the largest energy supply disruption in modern history? Thus far, it has proven more resilient than feared.2 Much of the blow was cushioned by security measures implemented after past crises—namely, inventories and pipelines.
Oil consumption has taken a hit, though a less energy-intensive global economy and users who were flexible enough to work around it reduced at least some of the economic damage.
On net: China imported less, the United States exported more, trade rewired.
But current resilience measures have limits. Prices have increased, inventories are thinning, the strain on refining systems is rising, pipelines have themselves been exposed to disruption, and the shock has not been borne evenly across countries.
The Strait of Hormuz disruption affected one-fifth of the global supply of oil and liquefied natural gas
The Strait of Hormuz is among the world’s most critical energy system arteries. Roughly 20 percent of global oil and the same for global liquefied natural gas (LNG) normally transits the Strait.3
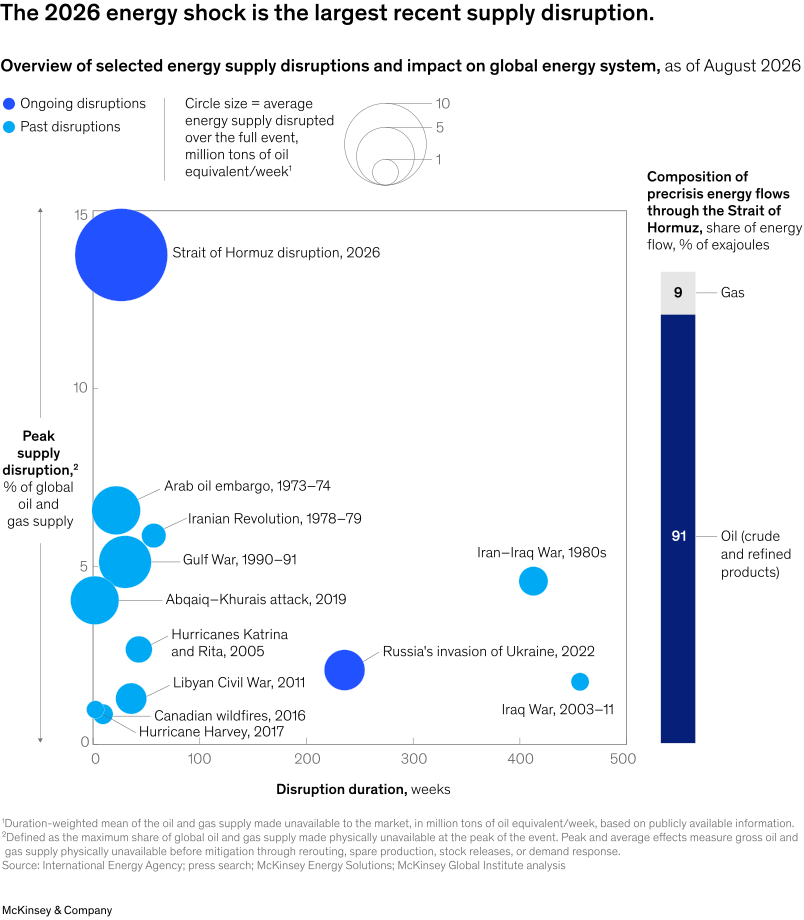
While the closure of the Strait has made an impact on many commodities, energy has been particularly affected.4 The largest hit so far has been to oil, including crude and refined products. Oil accounted for 91 percent of energy affected, while gas accounted for the rest. Used mainly for transport fuels (gasoline, diesel, and jet fuel) and petrochemicals, oil has few substitutes and is unevenly distributed geographically. That makes it a particularly challenging energy dependency to unwind. On the other hand, only 3 percent of gas supply has been directly affected. Even though one-fifth of LNG trade transits the Strait of Hormuz, LNG itself is under 15 percent of global gas supply.
All combined, at its peak the closure of the Strait disrupted 14 percent of the global combined oil and gas supply, more than double the relative size of the 1970s oil shocks and over six times Russia–Ukraine’s peak impact in 2022 (these lasted longer than the current disruption has so far) (Exhibit 1).
The energy system has thus far proven largely resilient, but unevenly
This is not the late 1970s or early 1980s. An oil shock the size of the current one would have depressed the US GDP growth rate by about 5.6 percentage points in 1980—about 20 times more than now—according to a Federal Reserve Bank of Dallas estimate.5
Brent crude oil prices temporarily spiked to four-year highs above $120 a barrel, but have since declined, and at least so far have not returned to those levels.6
It’s not the ’70s anymore: Inventories and bypass pipelines absorbed most of the shock before it reached oil consumption
Since the supply shock has been overwhelmingly to oil, it serves as the clearest test of the system’s shock absorbers. Around 21 million barrels per day (MMb/d) of oil—16 MMb/d of crude and 5 MMb/d of refined product—flowed through the Strait in the fourth quarter of 2025.7 Our analysis contrasted this with when the Strait closed, focusing on the second quarter of 2026.8
Importantly, not all flows had to be replaced (Exhibit 2). Some cargoes kept moving through the Strait (3.3 MMb/d), including Iranian ones. Additionally, the market came into the disruption flush with oil. China and others were building inventory for years in the lead-up to the shock. Halting this took demand out of the market without reducing end consumption, bringing the gap to only 15.5 MMb/d.
Rerouting via pipelines and increased production closed about 35 percent of that 15.5 MMb/d in the period examined. Two pipelines allowed crude to bypass the Strait: Saudi Arabia’s East–West pipeline and ADNOC’s pipeline to Fujairah. Running both harder helped move an additional 4.7 MMb/d around the closure.9 A further 0.5 MMb/d came from additional production, particularly in Brazil, Kazakhstan, the United States, and Venezuela.10
Inventories helped to the tune of an additional 20 percent, particularly emergency oil stocks established under the IEA after the 1970s. Countries tapped about 3.5 MMb/d of oil inventories (mostly crude, but also products).11 Of that, about 2.5 MMb/d came through coordinated IEA action, with the United States supplying the majority through its Strategic Petroleum Reserve (SPR). A further 1 MMb/d came from China.
Reduced oil consumption accounted for about 45 percent, or 6.8 MMb/d. Of course, there is uncertainty in some of these figures; nonetheless, the numbers here are representative of how key shock absorbers have worked.

While oil consumption did take a hit, flexibility reduced some of the damage globally
Reduced oil consumption between the fourth quarter of 2025 and the second quarter of 2026 was equivalent to a decline of more than 5 percent.12 But the global economy did not correspondingly shrink, influenced in part by the fact that it is now less energy-intensive than in the past.13 The International Monetary Fund’s forecast for 2026 global growth fell from 3.3 percent before the conflict to 3.0 percent in July. The impact was far more severe in the Middle East, where GDP is projected to swing to a 0.5 percent decline in 2026 from 3.3 percent growth in 2025, driven by disruption to energy production and exports, as well as the broader impact of the conflict.14
In Europe, Latin America, and North America, oil consumption barely dropped. Flexibility in energy use helped other regions to some extent.
China accounted for an estimated 35 percent of the global oil-use drop.15 China’s economy was slowing, so some of that was inevitable. But China also demonstrated the role that flexibility played in absorbing the shock, relying on capabilities it had built over decades. Its refineries helped manage transport fuel shortages by prioritizing its production with available crude while reducing naphtha production. China’s chemical industry compensated for the loss in naphtha through alternative inputs and production routes, including imported US ethane and coal-to-chemicals conversions. 16 While China reduced exports of transport fuels to protect its domestic demand, it was able to even increase exports of some petrochemicals.17 Other substitutions occurred, for example, more high-speed train use and less flying.18
Advanced Asian economies such as Japan and South Korea reduced their demand by almost 20 percent, or 1.2 MMb/d. Refiners there also prioritized producing transport fuels. To compensate, petrochemical imports from China rose.19
While flexibility has helped to manage the hit, supply disruptions led prices to increase globally, particularly in refined fuels. The International Monetary Fund raised its 2026 inflation forecast in July to 4.7 percent from 3.8 percent preconflict.20
And the developing world experienced genuine shortages and rationing, not just higher prices.21 In India, liquefied petroleum gas (LPG) for commercial use was rationed to protect households.22 In the Philippines, the government moved public offices to a four-day week to conserve fuel.23
While gas was less affected globally, its disruption was more concentrated and likely to be longer lasting
The global supply shock to gas has been limited, but some regions have been especially exposed. LNG through the Strait of Hormuz is a large share of imports for Asia in particular. Furthermore, physical damage to production in the Gulf has been extensive. Two affected liquefaction units, representing about 17 percent of Qatar’s export capacity, or 3 percent of all global LNG supply, were damaged and are expected to take three to five years to rebuild.24 As of late August 2026, benchmark gas prices in Europe and Asia were close to double their previous-year value.25
Some structural relief came from non-Gulf production, which in the second quarter of 2026 was 16 percent higher year-on-year.26 New supply offset roughly three-quarters of the loss in LNG relative to the previous year, led by US projects that mostly came online in the second half of 2025. The rest was met by demand reductions. In Asia, coal switching in the power sector helped, but other sectors were affected, for example, fertilizer production.27 In Europe, some of the shortfall was absorbed by a slower buildup of gas inventories for the winter.28
How China and the United States rewired trade and rebalanced the oil system
The shifts described above in global oil markets—inventory releases, pipelines, new production, demand changes—contributed to a rewiring of global trade.29 All told, more than one out of every five barrels of seaborne oil traded in the second quarter of 2026 was rewired relative to precrisis flows30 (Exhibit 3).
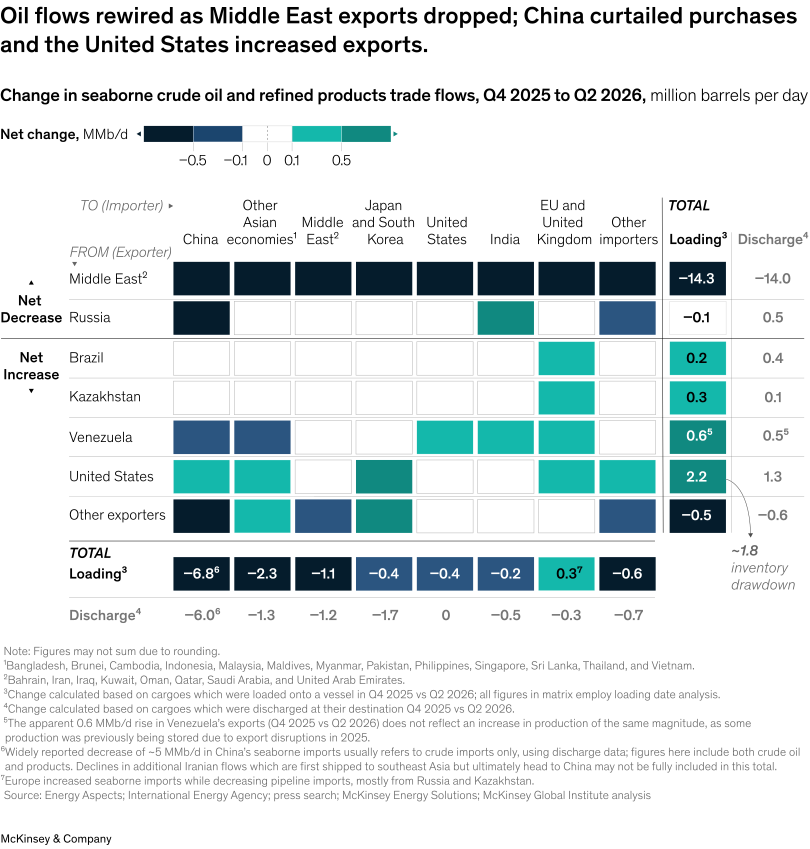
China played the largest role in absorbing the shock, moving from building to drawing inventories and reducing oil consumption.31 As a result, its imports of seaborne crude oil and refined products fell over 40 percent from preconflict volumes.32 This freed up cargoes for other importers in Asia.
The US release of inventories of 1.8 MMb/d and its own production increase allowed it to raise exports by 2.2 MMb/d (20 percent) from the fourth quarter of 2025.33 This helped Europe and South Korea avoid significant import reductions. Other producers also helped by increasing exports.34
Shock absorbers have limits, and the cushion is wearing thin
Today’s shock absorbers have worked better than may have been anticipated but have had their limits—which are becoming clearer. Refined-product prices have risen. Countries have not borne the brunt of the shock evenly, with some markets experiencing shortages. The East—West pipeline, a vital buffer to the shock, has itself experienced disruption, as have alternate shipping routes through the Red Sea.35
Importantly, inventories, which have been instrumental in managing the damage thus far, are seeing signs of strain. While aggregate figures show that the world is nowhere near running out of oil inventories, two issues are emerging. First, the specific inventories that have done the most work are being drained quickly. Second, the emerging bottleneck is increasingly refining, where buffers were thinner coming into the shock and are fragmented across products.
Take the first issue. By late August, about half a billion barrels had been drawn from inventories globally, equivalent to the global economy’s five-day need for oil (Exhibit 4). The US draw—the largest globally—was mostly from the government-owned reserves. The SPR had already fallen from about 600 million barrels before 2022 to around 400 million by the end of 2025; by late August 2026, it had declined further to less than 300 million.36 That’s at historical minimums and is gradually approaching the floor of how low it could go.37
Meanwhile, the largest remaining crude stockpiles sit in China, which entered the crisis holding around 1.4 billion barrels. Yet large stocks don’t automatically translate into large releases: China has so far drawn relatively little from them.
The second issue is that the refining system is under the most pressure and has the least cover. Gulf refineries have cut output by over one-quarter, not just because of disruptions to the Strait but also because many of them have been damaged.38 At the same time, close to 2 MMb/d of Russian refining capacity is estimated to be offline in mid-July.39 Refineries in other regions are running at almost full capacity but haven’t been able to fully replace that lost output. Moreover, efficiency losses are biting as refiners adapt to crude grades they were not optimized for, leading to lower yields of the products most in demand, such as jet fuel and diesel.40
Product inventories can bridge only part of the gap. Refined product inventories have so far been drawn more slowly than crude. More than 70 percent of the barrels made available by the IEA-coordinated release were crude.41 But that does not imply a longer-lasting cushion. Refined-product stocks are thinner than crude’s and fragmented by both fuel and location. Diesel cannot substitute for jet fuel, and stocks in one market may not readily relieve shortages in another. Aggregate figures can therefore conceal local scarcity. While product stocks in Japan and South Korea have held up, by late July inventories of many products, from jet fuel in Europe to gasoline in the United States, were hitting five-year minimums.
The combined effect of refining disruptions and limited product inventories has already translated into higher prices. While the clock ticks on the crisis, the damage could hit demand, especially if inventories are no longer able to respond as much as they have so far. The 1970s established strategic crude inventories; now 2026 may signal more efforts to shore up buffers for refined products.42
Oil inventories have been drawn unevenly across fuels and regions.
1Five-year minimum inventory level between May 2021 and May 2026.
2Historical minimums are recorded from 1984 for OECD countries and from 2010 for non-OECD countries, and up to February 2026.
3Based on officially known inventories.
4US Department of Energy, SPR statutory authority policy.
5Due to data availability, the displayed chart and rate of decline correspond to the March–May period, while declines in other regions correspond to the March–July period.

The energy system has proven more resilient than anticipated thus far. While our analysis focused on the period through the second quarter, developments at the time of writing present a mixed picture. On the one hand, crude oil flows through the Strait of Hormuz were reported to be picking back up, potentially easing some pressure, although the scale of any recovery—and whether it could be sustained—remained uncertain.43 On the other, intensifying conflict in the Red Sea and pipeline disruption threatened to disrupt alternative oil export routes that had helped bypass the Strait. The crisis remains far from resolved, and substantial uncertainty persists about how long the shock will last and whether widening disruptions could undermine the mechanisms that have helped cushion it.44
Against that backdrop, the limits of existing resilience measures are becoming apparent. Past crises show that such conditions, particularly linked to large and prolonged shocks, can yield lasting energy system transformations (see sidebar “Lessons learned from past energy shocks”). In the next chapter, we turn to the responses under consideration by economies and their implications.
Energy security in action: Can a Hormuz-shaped hole ever be filled?
Countries and firms are starting to act to lower exposure to the Strait of Hormuz and reduce energy security risks more broadly. Measures range from speeding up electrification and creating alternative oil and gas supply to building additional pipelines to circumvent the Strait.
We take stock of these efforts broadly and also assess what they could do for future reliance on the Strait of Hormuz specifically. We estimate that measures already underway or under discussion could offset between 35 and 70 percent of precrisis oil flows through the Strait by 2030, in the event of a future shock.45 This range depends largely on how many new 2026 discussions translate into realized projects.
This offers a real-world illustration that the energy security tool kit can achieve substantial results, but it is not a forecast. Implementation takes time and money and is not a given.
It also underscores that energy security is about managing vulnerabilities and trade-offs, not eliminating them. The measures being considered are unlikely to displace Gulf supply in normal circumstances. What they do is create optionality to flows through the Strait itself in the event of a shock—by both creating excess capacity elsewhere and enabling alternate routes. Bypass pipelines in particular drive most of the potential offset. They reduce exposure to the Strait but can leave Gulf oil still exposed to broader regional disruptions, including those that could threaten the pipelines and other energy infrastructure.
Economies are implementing a wide range of structural levers to build resilience
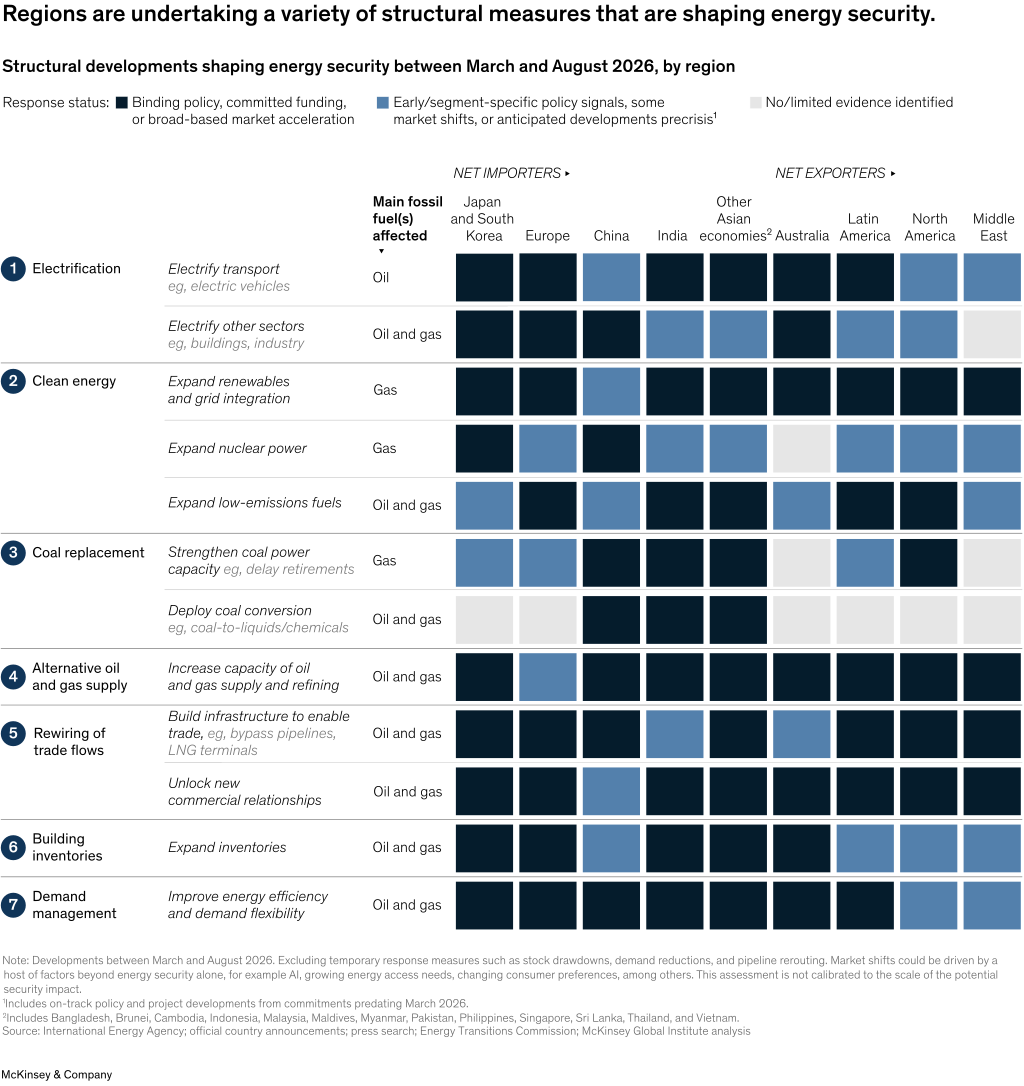
Regions are undertaking structural changes to enhance the security of their energy systems. We catalog market actions, policy shifts, and new project developments since March 2026 across seven structural energy security levers.46 We focus on actions that would directly transform how economies produce, trade, and consume energy. In some cases, these include measures influenced by broader market forces and policy goals, which also contribute to building energy security (Exhibit 5).
The first three levers substitute oil and gas with other forms of energy. Two of them also support greenhouse gas reduction:
- Electrification replaces oil and gas in end uses by deploying technologies like electric vehicles (EVs) and heat pumps, which are generally more efficient and can be powered by diverse—and domestic—electricity sources. Acceleration of this lever has been uneven globally in 2026. Global EV sales flatlined in the first half of 2026 year over year, mostly due to China and the United States.47 However, they grew in other regions, for example, more than 30 percent in the European Union during the second quarter of 2026 and roughly doubled in Australia, India, and South Korea. New policy measures such as AccelerateEU were launched to support further electrification.48
- Clean energy replaces oil and gas for electricity and heat generation, both in the context of existing uses and to power new electrified uses like EVs. Much of this effort centers on expanding domestic low-emissions power generation. The picture across regions is mixed. Globally, renewables capacity growth slowed in the first half of 2026, driven by China.49 But in many other regions, deployment grew over the same period, and new policy instruments were put in place.50 Investments in grids and storage have also stepped up to support reliability.51 Japan has accelerated plans to restart nuclear reactors.52 Implementation is also being catalyzed by forces outside of energy security, such as AI build-out.
- Coal replacement, like clean energy, powers electrification but increases emissions. Many countries have domestic coal resources and power capacity. Countries slightly increased coal-fired generation in the first half of 2026, in part to compensate for lost gas imports.53 More structurally, though, some Asian and European countries have delayed or are reviewing retirements of existing coal plants for several years to retain spare capacity.54 Coal can also be converted into fuels and chemicals to directly replace oil and gas. Coal-rich China and India have announced new coal conversion capacity.55
The next three levers secure oil and gas supply and use:
- Alternative oil and gas supply diversifies production and could reduce exposure to geographic chokepoints. Net exporters in the Americas are pulling this lever hardest. US oil output has risen to a new high, and new capacity increases have been announced.56 Argentina and Venezuela have accelerated ongoing projects, and Canada has announced increased ambitions.57 Norway and the United Kingdom are discussing new oil and gas capacity.58 Australia is studying its first new refinery since the 1960s.59
- Rewiring of energy trade flows enables existing and new sources to reach markets through a broader range of trade routes and partners, enabled by infrastructure and, in some cases, new contracts. Gulf exporters are building additional pipelines that circumvent the Strait of Hormuz.60 Canada and the United States are advancing LNG export infrastructure.61 On the import side, the European Union announced additional LNG import infrastructure.62 South Korean refiners started making operational adjustments to take a broader range of non-Middle Eastern crude, with SK Energy announcing plans for further retooling.63
- Building inventories provides a temporary buffer to shocks. Many countries with limited inventories have announced plans for new ones, including India, Pakistan, and the Philippines.64 Advanced economies that already held crude inventories are expanding their historically thinner product reserves; Australia has announced a new government-held reserve of 1 billion liters of diesel and jet fuel.65
The last lever reduces and better manages overall energy needs:
- Demand management reduces the energy required to perform a given economic activity or makes its use more flexible. Canada, China, and some European countries are preparing new efficiency standards for products from refrigerators to industrial electric motors.66 Some combine efficiency with electrification, such as programs that incentivize building insulation combined with heat pumps.67
Energy security levers offer optionality to the Strait, not displacement of Gulf oil supply
Many energy security measures being considered in 2026 could reduce reliance on oil flows through the Strait. How material could their impact be? How much would they cost? We examine structural levers that could have the most direct impact on security in the Strait.
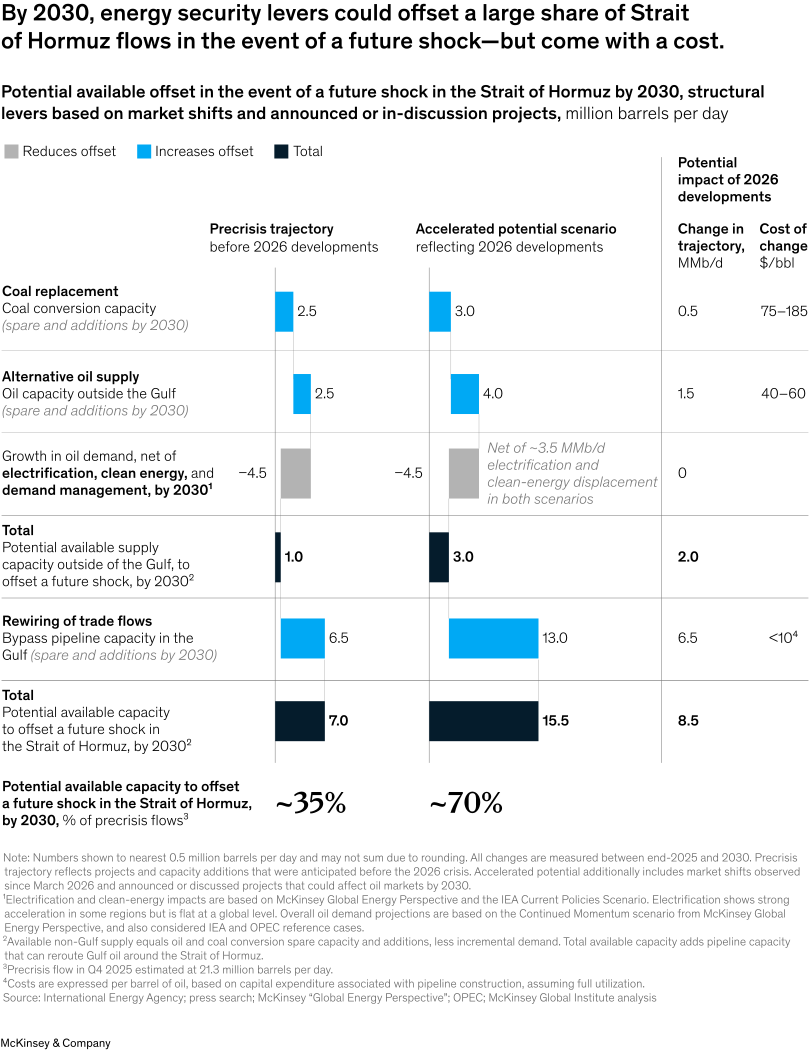
Our analysis considers a “precrisis” case, assessing the trajectory these levers were on before 2026. We also build an “accelerated potential” case factoring in developments since March 2026, including projects actively being discussed but not yet confirmed as of August 2026.68 Stacked, these levers reach 7 MMb/d of offset on the precrisis trajectory and as much as 15.5 MMb/d in the accelerated case, if all discussed projects came to fruition. Using Strait of Hormuz oil flows as a yardstick, this corresponds to about 35 to 70 percent of preconflict transit (Exhibit 6).
Available supply capacity outside of the Gulf to absorb a shock is limited, but bypass pipelines could play a significant role
To absorb a potential future shock, both existing spare capacity and new additions could play a role. Accounting for this, we estimate that coal conversion and oil supply capacity could each contribute around 2.5 MMb/d by 2030, on a precrisis trajectory.69 Additionally, they’ve experienced a post-shock acceleration of 0.5 and 1.5 MMb/d by 2030, respectively, based on announced projects.70 For oil, this includes a potential 0.5 MMb/d from Venezuela (further potential beyond 2030 is discussed in chapter 4). Put together, these developments add up to 5 to 7 MMb/d of capacity.
But this capacity will have to meet rising oil demand. Central scenarios imply roughly 4.5 MMb/d of net oil demand growth by 2030. This is even after accounting for increased efficiency, electrification, and clean energy—the latter two were on a precrisis trajectory to displace about 3.5 MMb/d of gross oil demand by 2030. 71 Why don’t these levers play a bigger role? Take EVs as an illustration. Sales are on track to be 30 percent of all new car sales globally by the end of 2026. However, they account for less than 5 percent of cars on the road.72 Transitioning the current stock of fossil-fuel-burning assets—from cars to boilers—takes time. Furthermore, electrification and clean energy trends have not yet shown evidence of post-shock acceleration at a global level, and even accounting for the regions where they have, the uplift in oil displacement has been relatively small.73
Combined, the supply and demand views suggest only about 1–3 MMb/d of potential available supply capacity outside the Gulf by 2030.74 While of course there is uncertainty around future demand, energy systems generally add supply to keep pace with it rather than maintain large amounts of idle capacity.
The last major lever being considered to bolster security is bypass pipelines. They could move the needle much further in terms of offsetting flows from the Strait in a shock, based on announcements and discussions to date. Bypass pipeline spare capacity around the Strait was already at 4.5 MMb/d before the crisis and was on track to reach 6.5 MMb/d by 2030.75 Since the crisis, many additional routes are being discussed, such as an Iraq–Turkey pipeline and a third pipeline connecting interior fields in the United Arab Emirates with the Fujairah port that could bring total diversion potential to 13 MMb/d in the accelerated potential case. The feasibility of them being built by 2030 is highly dependent not just on when projects are approved but when construction starts.76
Energy security around the Strait could rise—but measures come at a price and offer insurance, not displacement of Gulf supply
The actions being considered reveal important realities and trade-offs of energy security.
First is that implementing measures comes at a price. To understand it, we analyzed the cost of the extra offset potential announced since March 2026. New coal-to-liquids conversion plants run at $75–$185/bbl and potential new oil supply outside of the Gulf at $40–$60/bbl, against Gulf oil, where most supply runs below $30/bbl.77
Electrification’s economics vary widely by market and use case, and it can often deliver a positive business case over time relative to conventional high-emissions technologies. This is because up-front capital expenditures are offset by lower operating costs. Nonetheless, the up-front outlays can be large, posing a barrier particularly when financing is constrained. The up-front cost of the incremental electric passenger cars sold by 2030 alone is about $1 trillion more than the equivalent internal combustion fleet.78 From an emissions perspective, electrification would generally contribute to lower emissions—unlike coal, which would increase them.79
Pipelines can be comparatively cheaper. Large pipelines generally cost under $10/bbl, assuming full utilization.80 But they also come with a significant upfront capital outlay. As an example, the United Arab Emirates’ planned parallel pipeline to Fujairah has been reported at about $3 billion.81
Second, increasing energy security around the Gulf is not the same as displacing its crude. The distinction turns on whether the Strait is open or closed. If it’s the latter, these levers could substitute lost barrels and so may be worth having even if costly. But Gulf crude sits at the bottom of the global cost curve—from about $5/bbl in the United Arab Emirates to around $30/bbl in Iraq (Exhibit 7).82 If the Strait is open, none of the levers displace them. They largely buy insurance against disruption on the Strait.
Gulf oil supply sits low on the cost curve.
1Breakevens are Brent-based and reflect forward-looking cash costs (operating expenses, taxes and royalties, maintenance capex) for existing production and half-cycle costs (ie, cash and development costs, excluding land costs) for new production. In all cases, breakevens include projected free cash flow from associated gas and natural gas liquids production and sales. Breakevens incorporate a 15% discount rate for all future cash flows.
2Oil production from new wells started in 2025.
3Production is split into country-resource type segments, with segments of <1 MMb/d grouped together.