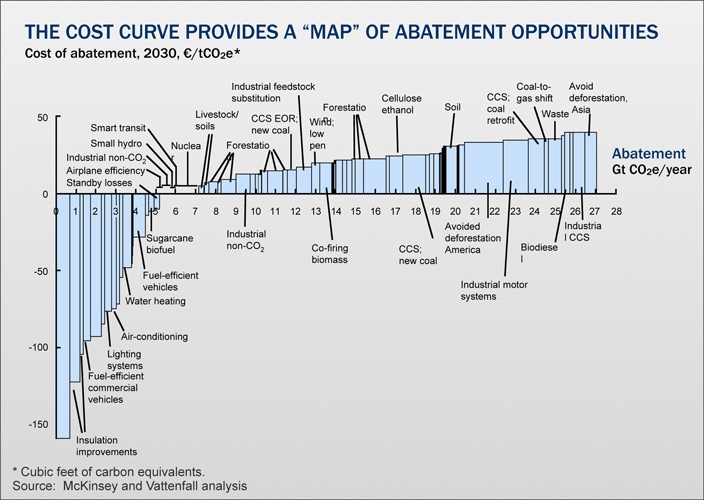
The global "carbon abatement cost curve" developed jointly by McKinsey and The Vattenfall Institute of Economic Research provides a map of the world's abatement opportunities ranked from least-cost to highest-cost options. This cost curve shows the full range of actions that we can take with technologies that either are available today or look very likely to become available in the near future. The width of the bars indicates the amount of CO2e that we could abate while the height shows the cost per ton abated. The lowest-cost opportunities appear at the left of the graph and the highest-cost to the right.