US equity markets stretched once again into record territory in April, setting new highs on both the Dow and the S&P 500 indexes. That’s good news for investors—it wasn’t that long ago when the market was headed in the other direction. The question on everyone’s mind, though, is where the market is headed next.
In the short term, of course, there’s no telling what will happen—and speculation is risky. Investors and companies alike are notoriously weak at timing their investments to the market. But those are short-term questions; what really matters from a corporate-strategy perspective is the long term, and what really counts in the long term is the market’s relationship to the real economy.
In fact, much of the equity market’s performance in the United States, as we’ve seen over at least the past 50 years, is clearly linked to the performance of the real economy, including GDP growth, corporate profits, interest rates, and inflation—in spite of short-term volatility. And in the absence of some disruption of that link, the market should continue to thrive. In a nutshell, if GDP were to grow at rates comparable to the 2 to 3 percent annual real growth of the past 50 years and inflation is kept in check, investors should be able to expect annual stock-market returns of 5 to 7 percent in real dollars over the next 10 to 20 years.1
Of course, it’s worth remembering the old saw about economists predicting nine of the past four recessions: in economics, it’s often easier to predict the long term than the short term. The same applies to the stock market. So while we’d never attempt to forecast periods as short as even five years—affected as they are by volatile shifts in investor expectations—today’s fundamentals make us relatively sanguine about the market’s performance over the longer term. Indeed, it would take catastrophic changes in real economic performance spread over multiple decades in the real economy or a fundamental shift in investor behavior—unlike anything we’ve seen in more than a century—to reduce long-term equity returns to below around 5 percent in developed markets. In this article, we’ll first examine the connection between equities and the real economy and then consider the likely causes of breaks in that connection over specific periods of time.
Stock-market performance and the real economy
Over the past century, stocks have earned about 9 to 10 percent per year. Adjusted for inflation, that means investors have earned annual real returns on US common stocks of about 6 percent per year.2
That 6 percent is no random number—and understanding where it has come from in the past tells us something about how likely it is to continue in the future. In fact, that number is a natural consequence of economic forces derived from the long-term performance of companies and industries in aggregate and from the relationships among economic growth, corporate profits, and returns on capital—and how they convert into shareholder returns (TRS). Once these relationships are made clear, the connection between the stock market and the real economy becomes apparent, and historical returns make sense: that is, share-price appreciation combined with cash yield3 has resulted in about 6 percent real TRS—depending on the precise measuring period. Here’s how it works, using the last 50 years of the S&P 500 index as an example.
Share-price appreciation. From the end of 1962 through the end of 2012, real share prices grew at 2.7 percent per year, roughly the same rate as real profit growth and real GDP growth. Share prices and real profit tend to grow at the same rate because the P/E ratio tends to revert to a normal level of around 15 times earnings—as long as the economy, inflation, and interest rates are in a “normal” range of stable longer-term levels. In fact, both theory and the data show that a P/E ratio of 15 is consistent with average returns on equity of 13 percent, a real cost of capital of about 7 percent, inflation of 2 percent, and long-term profit growth of 2.5 percent.4
Cash yield. Over the 50-year period, investors earned another 3.1 percent per year in dividends and share repurchases, as companies paid out around 55 to 65 percent of their profits to shareholders. That payout ratio, combined with an average P/E ratio of 15, results in a cash yield on stocks between 3 and 4 percent per year. Payout levels may be volatile over the short term, but over the longer term, dividend and share-repurchase payouts are driven by company cash flows—the profits a company earns less the portion of these profits it must reinvest to grow. Anything left over must eventually be paid back to shareholders, even among companies that sit on their cash for years.5
Combined, that level of share-price appreciation and dividend yield results in a total real return of 5.8 percent per year, slightly lower than the 100-year average due to recessions and high inflation in the 1970s. It’s not inconceivable that fundamental economic forces might tilt the balance and undermine the equity markets. Radical shifts in investor risk preferences, for example, could permanently shift the long-term P/E ratio from 15 to some other number. So could extreme changes in the performance of the economy, such as substantially higher or lower long-term GDP growth or a large change in the ratio of corporate profits to GDP, bigger than the one that has taken place in recent years.6
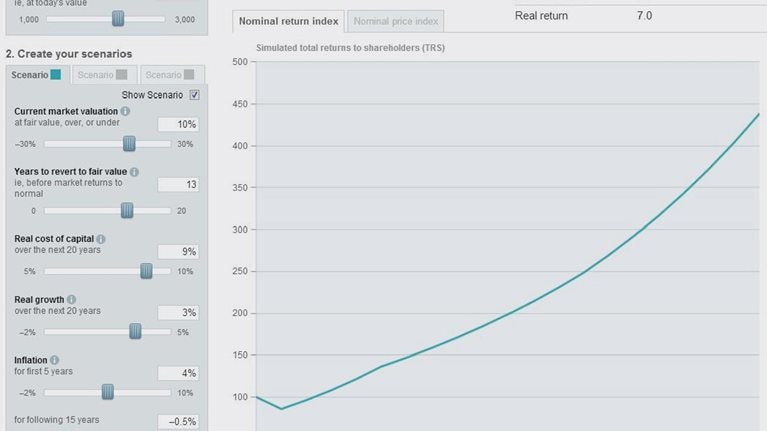
But such things haven’t happened thus far, and as long as they don’t, shareholder returns are unlikely to deviate much from the 6 percent real long-term return. In fact, even with relatively extreme assumptions about long-term earnings growth, it is difficult to foresee real long-term shareholder returns of less than about 5 percent (Exhibit 1). (Readers can explore the likely impact on shareholder returns of a range of assumptions on earnings growth and on the value of today’s share prices relative to historical norms using an interactive calculator. For more, see “Whither the US equity markets: An interactive simulator.”)
Absent radical shifts, returns are unlikely to deviate much from the long-term norm.

Stock-market eras, 1962–2012
It would be hard to argue that the market’s movements can be explained by anything other than a random process over periods as short as a day, a week, or even several years. There are simply too many moving parts. Shifts are often as much about changes in expectations as they are about actual performance. Market observers like to focus on trough-to-peak periods, like the 11 percent real returns from 1983 to the market’s peak in 2000. But linking the market to the real economy does let us tease out the impact of different fundamental forces behind its performance over longer periods. By understanding what shaped past events, we are in a better position to explain where we are today and what the future might look like.
To better understand why the market has deviated from its long-term trajectory in the past, it helps to look at its performance through the lens of underlying economic trends rather than the usual approach of examining calendar decades or peak-to-trough cycles. We defined five eras in the past 50 years, distinguished by key events in the real economy—inflation, interest rates, and corporate-profit growth (Exhibit 2).
Five eras illustrate the market’s connection to the real economy.

The era from 1962 to 1968 was a robust period, with a fast-growing economy and low, stable inflation and interest rates. Not surprisingly, then, the real return to shareholders was 9.4 percent, above the long-term average.
Contrast that fairly short period of calm to the years 1968 to 1996, when real returns fell below the long-term average to about 5 percent. During the first era of this much longer period, from 1968 to 1981, inflation (and the resulting high interest rates) slowed the real economy and the stock market and led to low P/E ratios. As most economics observers understand, when inflation is high, companies are unable to increase their returns on capital enough to make up for it. This leads to higher investment and lower cash flows for a given level of growth, and therefore lower P/E ratios. Inflation also depresses P/E levels because investors discount expected cash flows at a higher cost of capital. Indeed, high inflation and interest rates drove down the P/E ratio from 17 in 1968 to about 9 in 1981, when inflation was 9.4 percent and interest rates were nearly 14 percent. That decline in P/E ratios, plus the negative effects on economic growth, resulted in real returns to shareholders of –1.3 percent per year.
As inflation was brought under control in the early 1980s, P/E ratios and economic growth returned to normal levels. Real returns to shareholders were 13 percent per year. While commentators have held those returns up almost as a golden age of stocks, the reality was more mundane; it was just a return to normalcy.
The years 1996 to 2004 appear very different depending on whether you look at the total return over the entire period or only at what happened in the middle. From beginning to end, real returns to shareholders were about 6 percent. What everyone remembers, though, is what happened in the middle. The S&P 500 index went from 741 at the beginning of 1997 to a peak of 1,527 in mid-2000 before falling back to 1,212 at the end of 2004.
This movement was caused not by a market-wide bubble but by a very large sector bubble in technology and megacap stocks, whose P/E ratios ballooned in 1999–2000 to twice those of rest of the index.7 The S&P 500 index is weighted by the value of its stocks—and while the range of P/Es is typically fairly narrow, movements in a handful of the largest stocks can shape the entire index. The collapse of the bubble in 2000 led to a convergence of P/Es and a return to normal over the next four years.
Similar circumstances define the period from 2004 to 2012. This time around, it was unusually high corporate profits, not a high P/E ratio, that drove the S&P 500 up to a new high of 1,565 in October 2007. These profits, however, were concentrated in the energy sector, with oil prices reaching $145 per barrel, and in the banking sector, with overoptimistic assumptions about the value of loans and unsustainable speculative activities. In their initial panic over the credit crisis, investors drove the S&P 500 index briefly as low as 676 in March 2009. That lasted just a couple of months, however, as investors realized that as bad as the recession might be, the long-term outlook couldn’t be so bleak. For the rest of the period (2010 to 2012), corporate profits and P/E ratios began to return to normal. At the end of 2012, corporate profits and GDP had not yet returned to long-term trend levels, leading to subpar real shareholder returns of about 2 percent for the 2004–12 period.
By early March 2013, as the S&P 500 again neared record-high levels, the forward P/E multiple stood at around 16. However, at this writing, there is still great uncertainty about the trend in corporate profits and whether GDP and corporate profits will return to long-term trends in 2013 or 2014.
Unlike the market for fine art or exotic cars, where value is determined by changing investor tastes and fads, the stock market is underpinned by companies that generate real profits and cash flows. Most of the time, its performance can be explained by those profits, cash flows, and the behavior of inflation and interest rates. Deviations from those linkages, as in the tech bubble in 1999–2000 or the panic in 2009, tend to be short-lived.